R-0224 Dabur break out GO LONG CMP 515 TGT 544/571 SL 4881. Symmetrical Triangle breakout on the daily charts
2. Volumes have gone up along with the price rise in the recent past
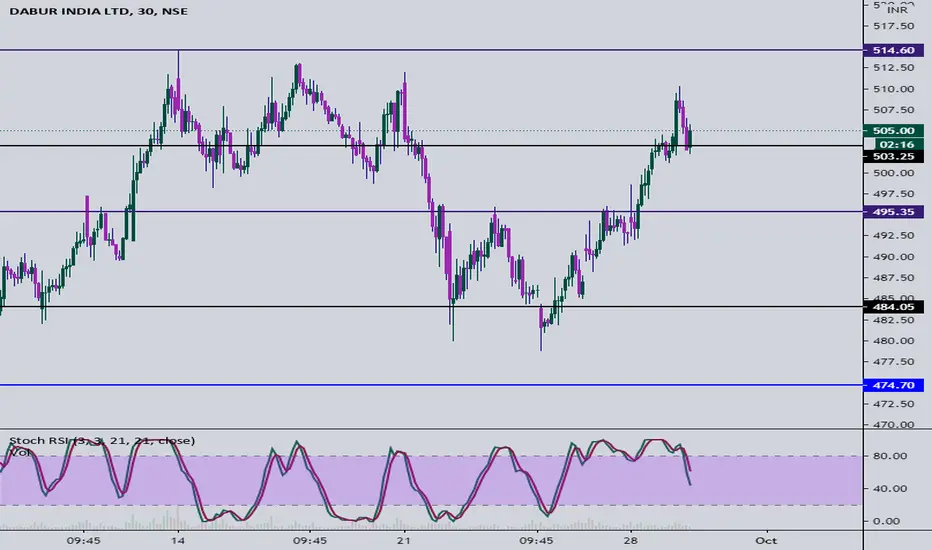
3. Stock price has surpassed the previous top resistance of 514.70
4. Long build up is seen in the October series, where OI has gone up more than 15% with price rise of 5.5%
5. ADX indicator crossed –DI line on the upside, indicating starting of a bullish momentum, RSI and MACD are also
showing strength in the current uptrend
6. Considering the technical evidences discussed above, we recommend buying the Dabur October Future at 515-516
and average at 497, for the upside targets of 544 and 571, keeping a stoploss at 488.
DABUR

Dabur - 4th Re-test of All Time High regionThanks for coming to this update.
Before you start reading kindly hit that like button. It motivates me to keep doing such work for free.
Thanks
Dabur is re-testing the 515-525 region for the 4th time now. In the last trading session, it was consolidating below resistance which is a good sign for people wanting to go long.
A break above this could give some upside momentum.
It is also making an ascending triangle on the Daily chart that has a higher probability of breaking towards the upside.
One thing to note though is that volume is not great in the up move and this could result in a failed rally or trap.
Please beware of this and trade safe.
Please note: These are my views and not trading advice. Please consult your financial adviser before making any trading decision.
In the end, either you follow your rules, or get eaten

LOOK WHAT I FOUND IN DABUR.Company has a great potential to grow you just have to get an entry point and some patience and you will be definitely rewarded

Short Term TargetsBuy Dabur around 503 to 506
Targets 511/514
Stop Loss 500
#NSE call
*Disclaimer : I just shared my view. Please trade with your own and comfortable views.

Dabur - Break of 500 resistanceThanks for coming to this update.
Before you start reading kindly hit that like button. It motivates me to keep doing such work for free.
Thanks
Dabur had been making an ascending triangle on the daily chart and has broken towards the upside.
The upside breakout came with more volume than average for the past few sessions but not very substantial, thus I would be a bit careful I decide to go long (both from positional or intraday perspective).
This could also be a trap for retail traders.
Next level of resistance:
R1 - 516
R2 - 524
Support region:
S1 - 590
S2 - 580
Please note: These are my views and not trading advice. Please consult your financial adviser before making any trading decision.
“If most traders would learn to sit on their hands 50 percent of the time, they would make a lot more money.” - Bill Lipschutz


DABUR -- INTRADAY TRADING SETUP FOR 26 AUG 2020 1 THIS IS FOR ONIY EDUCATION
2 WHEN TREND LINE BREAK TAKE ENTRY
T1 495.5 T2 498.5 T3 503.5
SL 485.5


DaburNSE:DABUR
If it holds 500(with a spike towards 497-498) but closing above 500
Then we can see 527
I am long with sl below 495
Low risk trade
Will update levels
once closes above 510 zone

R-0122 Short Term Cash Buy DABUR @510.40-513.4 SL 501.7 TGT 531Short Term Cash Buy DABUR @510.40-513.4 SL 501.7 TGT 531
MACD cross over + TK cross over => bullish sign

Dabur_Long CallDate: 13 July 2020
Dabur (CMP 484.50)
Ascending Triangle Pattern Breakout. Target 532
PCR=0.35. Max Call Option (4.13 lacs) at 500 strike price
RSI=67
Increasing volumes.
Price has sustained above its 200 DEMA in the last 10 trading sessions
Target: T1- 495, T2- 513, T3- 532; SL- 460


daburlooks like dabur is in an uptrend, maybe will retrace a bit and then again on the upper side. let's see #my_opinion


DABUR - Double Breakout - Long SetupNSE:DABUR had a breakout from bull flag as well as resistance zone.
Buy on dips advised. Levels for reference shown.


Dabur from 21 June 2020Dabur is showing signs of upside. .. multiple doji candle can be expected but stil
good upside movement possible ...
safe traders buy above 448.70 == volume tested support
risky traders can buy above 445 == above volume tested resistance
target of 454 -> 470
if touched 481 then complete reversal to uptrend can be seen !!


DABUR - How wonderfully Trendline retest plays outDABUR - How wonderfully Trend-line retest plays out

DABUR - Time to BounceThe Trendline breakout has been seen on the dabur intra charts and the said breakout is followed by the trendline retest.
The Trendline which was earlier working as resistance are now supposed to be working as support.
The said trenline support is aligned with the harmonic cypher pattern support@ 460 levels.
This is small risk trade with a stop at 452 levels, with a initial target of 475 and 490 levels.
