USDCAD Trend Analysis Week of April 1stWeekly= Bullish.
Daily= Bullish.
4H= Bullish.
Weekly is in consolidation (Flag Pattern). Daily in bullish parallel channel.
1H bullish pennant breakout currently. Long-term expecting price to reach top of weekly consolidation/flag pattern (1.38800) then breakout to continue bullish movement to weekly zones. 1.41000 & 1.42000
Daily Charts

ETH/USDTHello everyone, let's look at the 1H ETH to USDT chart as we can see that the price is moving below the local uptrend line.
Let's start by setting goals for the near future that we can include:
T1 = $3,454
T2 = $3,603
T3 = $3,710
AND
T4 = $3,845
Now let's move on to the stop loss in case of further market declines:
SL1 = $3,189
SL2 = $3061
AND
SL3 = $2,884
Looking at the RSI indicator, you can see how we remain low below the downward trend line, while the Stoch indicator approached its trend line, which may trigger a rebound again, it is worth watching whether the downward trend will be broken.

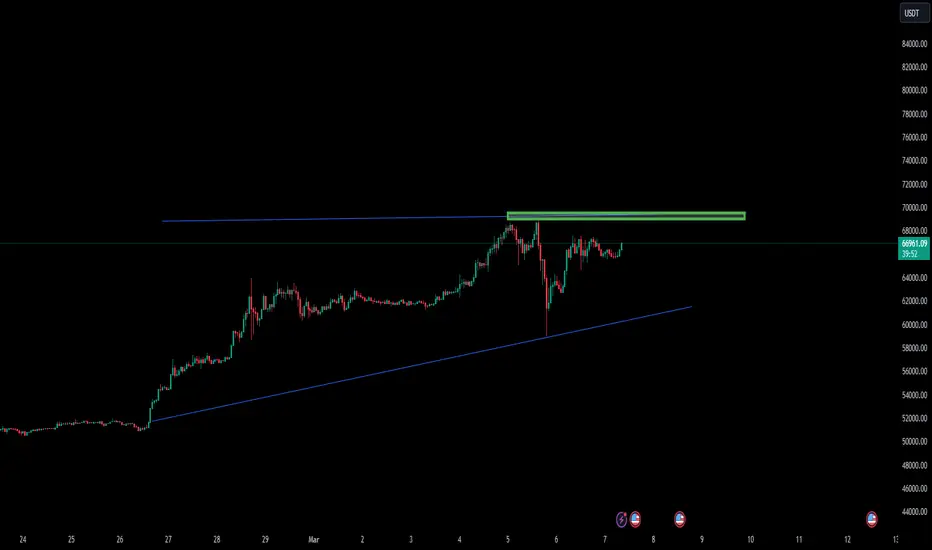
Goldmine for breakout tradersMorning folks,
So, it seems that "222" Sell last time was not a bad idea at all. Despite that BTC stands in rectangle we've got two nicely looking downside bounce. Now we have some nuances with the BTC performance, but to keep it simple it is mostly suitable for those who like to trade breakouts.
If you do not want to wait a bit for clarity on daily chart, in what direction market still will follow, but want to trade today we could offer you few options.
First, is, if you want to bet on upside breakout and take long position - try to do it as closer to the rectangle bottom as possible. For example - it is nice "222" Buy is forming and almost ready to go.
The opposite is true for bearish position. Now we have no patterns, but they could appear later.
Finally, for the breakout, if you do not care on direction. The simplest way to act is to use Stop Sell and Buy orders at once, placing them just outside of rectangle. When breakout happens, you just cancel the opposite order. That's all.
I mark today's idea as "neutral", because it is volatility-based.

The macd on btcusd.This is a time to be very careful, already having a ready strategy on the possible scenarios that will arise. The price has been gravitating around the previous ath for days, this could mean that the test of the highs could last a while, if we then look at the macd, a slowdown is evident which could indicate an ongoing short-term correction. So far it is going well and the movements seem harmonious most of the time, with intraday corrections that often do not reach the minimums, remaining with an ascending sequence of highs and lows. The strength of the bulls is still very high, my hypothesis is that the buyers cannot give their all in these moments, trying to snatch better prices, the orders in the books become slightly smaller placed at the lower levels. The market is at a crucial moment, with the halving approaching, the situation could suddenly heat up after the monthly close.

Control the riskMorning folks,
So, our H&S is done well, and already has reached the minimal target. Now the major question whether it will go to 74.3$, a kind of "bonus" upside target. Maybe..
But, today we would think about protection and risk control, rather than about some bargain. On daily chart we've got bearish grabber that is taking the shape of '222" Sell here, on 1H chart. We're coming to PCE report and long Easter Holidays. BTC could go higher, but today we would focus on risk control instead.
Think about some risk management of long position - booking totally or partially, stop tightening etc.
Bears by the way, could think about short entry. Chances on success are low, but potential money risk is small as well. If you succeed, result will be 10K+ per coin. It worthy at least to think about it...
Let's mark this report as "bearish"due described issues.

2nd attempt is betterMorning folks,
So, let's go back to our H&S pattern, which is a 2nd attempt to go long. You could see that it starts working. Right arm stands in place and now we could move stops to breakeven.
Second is - we could estimate targets. First one is H&S AB=CD around 69.70K. If we get lucky, we could see 1.618 expansion to 74.3K.
Finally, if you've missed entry but still would like to step it - on 1H chart we have local "222" Sell. Here you could watch for two nearest support levels. Just avoid buying if we get strong downside action. Drop under 64.50K Fib support also will be a bad sign, because it breaks the nature of reverse H&S pattern that should be bullish. And strong drop with erasing of the right shoulder definitely will be the sign of H&S failure.
Keeping this simple rules in mind should let us to pass this journey without big shocks.

2nd chance for long entry?Morning folks,
Despite how great Monday's setup was looking, BTC was not able to compete it. H&S has failed and BTC dropped almost to ~60K area.
Still, the same context is still valid - BTC at daily oversold. But this time it is also at strong K-support area. Thus, our attempt for to take the long position continues. This time, pattern looks better, and hopefully it will be more successful. 63.5-64.5K is an area to watch for...

CHF Loses Ground After The SNB Rate CutToday, the Swiss National Bank cut its interest rate, dropping from +1.75% to +1.50%. Last time we saw any changes made in the rate were back in June 2023, when the Bank lifted the rate from +1.75% to +1.50%. After the release of the news CHF devalued against all of its major counterparts, even against the currently-weak USD.
Looking at the technical picture of EASYMARKETS:USDCHF on our daily chart, we can see that the pair popped higher today after the SNB release. The rate rose above a key resistance barrier, at 0.8886, which is the highest point of February. As long as EASYMARKETS:USDCHF continues to trade above that barrier, we will stay positive, at least with the near-term outlook.
Given that the pair had already reached and overshot one of our key resistance areas, at 0.8954, we will continue aiming higher. That's when we will target the 0.9052 obstacle, or even the 0.9113 level, marked by the highest point of November 2023.
In order to shift our attention to some lower areas, a break of a short-term tentative upside support line taken from the lowest point of December 2023, is needed. This way a directional change of the current uptrend may occur, possibly inviting more sellers into the game. EASYMARKETS:USDCHF could then fall to the current lowest point of March, at 0.8730, a break of which may set the stage for a move to the 0.86500 area. That area is marked near the inside swing highs of January 29th and February 1st.

Nice bullish signalMorning folks,
Although we were a bit sceptic last time about good entry chance, because we saw how BlackRock just buying out any, even minimal deep on the market. Still, market was able to reach 65K area that we've discussed on Thursday.
65K is also daily oversold. Since we have strong upside momentum, upside bounce should be at least 5/8, which is around 70K, but this is minimal target, it could move higher.
On 1H chart we have great pattern on the back of this idea - reverse H&S. It is not totally completed yet, but shape is becoming clear. So, depending on what AB-CD pattern we will get, based on this pattern, we get corresponding upside target. For now it is around 71-72.5K
We consider no shorts by far.

Bullish Gold #XAUUSDSo far, all signs are showing an additional advance to the area of 2200.xx.
However, watch out for a daily/weekly close below 2146.xx for a sell signal
The idea presented in the picture isn't a signal. Share your thoughts in the comments section please!

The macd on the btcusd daily.Correction in progress, macd reporting a new cycle but we knew this well. Now the thing to do is to wait and understand how long this correction will last, because there are still many buyers. The indicator here is drawing a high and agrees with the price, a signal that the bullish trend is very strong, this is in addition to the other bullish signals we have on btc, including the sequence of highs and lows on intermediate period and time, because by drawing the maximum at 73k usd, the price canceled the previous short-term correction made between December and January. I remind you that it is not enough to have a sequence of ascending highs and lows, but it is also necessary for the price to remain upwards for longer than downwards.

Low chances for good entry piontMorning folks,
So, BTC keeps it unstoppable rally, and is strongly overbought on weekly chart. But for now market totally ignores this. Yes, upward action is slowing, we have small tactical bearish grabbers on 4H chart, but it gives low chances on moderate retracement.
BTC successfully holds above previous ATH, showing no significant retracement and no doubts - this is bullish sign. Besides it has no strong resistance levels above, right up to our 85-88K target.
That's being said - common technical rules recommend to not buy and way for the pullback. But would you wait or not - you need to decide by yourself.
Here we just acknowledge that we do not have attractive entry point. Only, if by some reason, market will show pullback to 65K or at least to 68K, it might be interesting.
The same is for bearish positions - no reasons by far.

EURCHF Longer term / Swing Shorts As per the video I think EURCHF is at a good place with great RR to enter some short positions. For months the trend has been downwards and I'm hoping to catch that trend again down to the next point.

BİTCOİN-CASH / D / TECHNICAL ANALYSISThe BINANCE:BCHUSD.P is moving within a parallel channel on the chart. I have marked my target on the graph.
Like and comment if you find value in our analysis.
Feel free to post your ideas and questions at the comments section.
Good luck

BTC INCRAESE VOLUMEBTC seems on a low time frame to show a new increase in volume for the daily trend.
We will follow to see if BTC is able to confirm.
Better to wait a bitMorning folks,
So, on Monday we've sent relatively modest target - around 65.5K, it was completed.
Now BTC stands at weekly overbought and strong upside continuation is hardly possible immediately. Still, intraday scenarios are also not perfect. At first glance, on 4H chart, with the grabbers aboard, we could count on tactic downside deep. But, on 1H chart (not shown here), price performance is not quite bearish.
If we consider bullish position instead, we could take it only when grabbers will be erased, but this put entry level too close to the previous top that is upside target for now, because BTC is at overbought.
Thus, both scenarios are not perfect and care higher risk than usual. That's why our conclusion is to wait...

Ethusd well on the way to its channel breakout target.Just an update of this chart and the breakout eth has confirmed of its long standing channel consolidation. I also expect it to hit the second target on the left of the chart that is slightly higher not long after that as well. That target is from a wedge ethereum broke up from long ago. *not financial advice*

EOSUSDTHi guys
In my opinion, the rising guard of the chart is quite evident.
The condition of the above scenario for us is to maintain the support range of $0.6. Be sure to note that the reviewed process is long-term.
On the 4-hour time frame, we have a head and shoulder pattern at the end of the downward trend. Would you like to check on your chart (;
what do you think!?

NZDCADOANDA:NZDCAD
Weekly and Daily timeframes are bullish. Price on the daily made a pullback/retest to the Daily Area of Interest/ key support area @ around 0.82446. Entry is based on the bullish engulfing candlestick of the double bottom reversal pattern formed on the 4h @ 0.82446 daily key support

BONKUSD Appears to b ready to trigger the double bottom breakoutTwo potential channels here to consider on this double bottom breakout on BONKUSD (of which its possible for both to be valid). We will see soon enough if both targets get hit. Based on the current overall bull cycle I’d say probability is high they are both hit *not financial advice*

Time to take a look at big pictureMorning folks,
Well, as all targets that were standing inside previous swings are done, now its time to increase the scale. No much comments are needed here. Our next upside target is 85K. Also action between 65 and 69K levels seems important. If downside retracement will happen - we could get upside butterfly as well an entry chance around 40-45K area.

Solana’s breaking above an invh&s that’s also a right shoulder Priceaction is currently above the neckline of this daily chart inverse head and shoulder pattern on solusd with one daily candle close above the neckline so far. Should it trigger the breakout the measured move target is $135 which would put price action above the neckline of a much bigger weekly chart inverse head and shoulder pattern’s neckline. The measured move breakout target for that larger invh&s. Pattern would be around $242. Last October we saw the Dow Jones Industrial chart also start to break above a big inverse head and shoulders pattern that also had a right shoulder which was it’s own smaller inverse head and shoulders pattern just as we are seeing come to fruition now on the Solana chart. We must remember on that chart we had an initial fakeout above both necklines around July so there’s always a chance the initial break above the necklines for this solana chart starts as a fakeout too. However since then, The DJI chart has hit the target of it’s smaller inv h&s target and is very close to hitting its bigger inv h&s target so I’d say using that as a precursor, probability is rather high for solana to also hit both of its breakout targets within the coming months. *not financial advice*

Great Pump, but what's next?Morning folks,
Well, rally looks great, but absolutely unnatural and has no relation to normal market dynamic. It is pumped externally. This is not a surprise when 80% of spot market and all transactions and depository operation stand in one hands. Bubble? Yes, but it is not totally ripen yet, need some time to grow more...
Our setup has worked perfect whatever you've done - either use Stop "buy" order for breakout or just bought near the lows of our consolidation. Our next upside targets are 70K, i.e. previous top and 80-85K.
Now price is at overbought and it makes sense to wait for some relief. We will be watching DiNapoli patterns, based on the thrust - either DRPO "Sell" or B&B Buy.
It seems that any analysis of BTC market very soon will become useless, because it is not controlled by market natural force any more, it is concentrated and market goes with the direction that BlackRock& Co will choose.
