Weekly and Daily Update on NQ FuturesPlease have a look at these levels and also my forecast for next week. have a great trading week ahead and let me know in the comments if this helps. i would love to engage with day traders like me and would love to put more daily updates as much as possible.
Daily Charts

GBPUSD Daily Outlook!Hello Traders This is the Daily $GU Outlook overall we are on a Bearish Movement we broke a Huge Structure to the downside we gonna fall to the next Support level at 1.2020 before that i think we gonna Pullback to the Previous Support that will become Resistance So we must Retest the 1.2330 and i found A setup in 1.2364 So it could Reach these Areas Beetween 1.2330 - 1.2380 Next Week till the continuacion of the Fall of FX:GBPUSD

27 and 26.40 for accumulationMorning folks,
So, based on some recent news, which we think definitely are overpriced, BTC was able to show upside bounce. Our view that the major events are still ahead and 30K level should show whether the major rally starts or not. But, first - BTC has to get there.
Now we have short-term bullish context and consider position accumulation around 27 and 26.40K support area, suggesting that downside retracement might be a bit deeper.
Vital level for this setup is 26K lows. It price drops below it - upward action is over and we're going to 25K.
If everything will be OK, then BTC should try to test 30K area.

GBPJPY SELLFX:GBPJPY
A break below Daily and Weekly support on an overall bearish structure. Waiting for a retest to the Daily and/or Weekly resistance to continue bearish move on GBPJPY

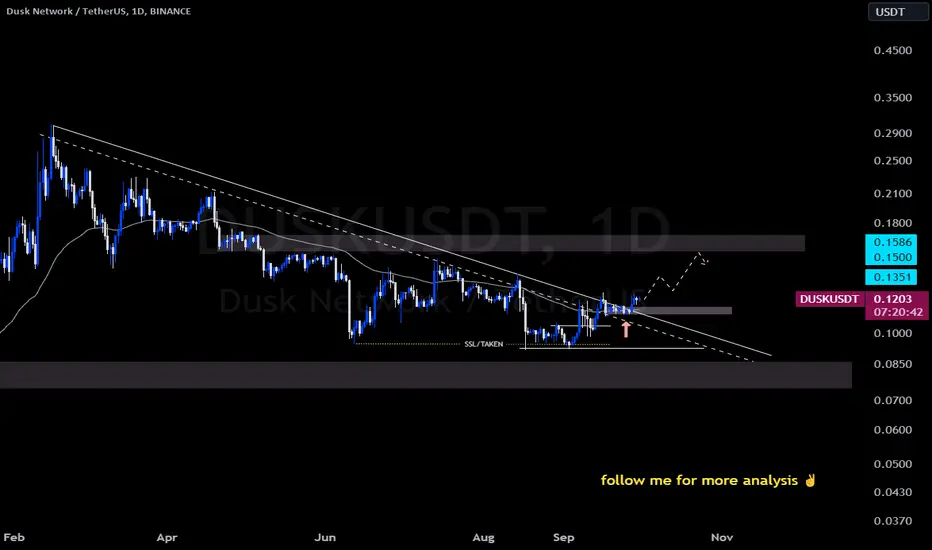
SasanSeifi 💁♂️dusk / daily Hey there! 😊
▫️ In the daily timeframe, as you can see, following the breakout from the downtrend line, the price has been accompanied by positive reactions from the $0.11 range. Currently, it is trading around the price level of $0.1200. An expectation we can have is that if the support range between $0.11 and $0.1060 holds, we might witness positive fluctuations toward the resistance levels, as indicated in the image above.💹
▫️ Additionally, if the price falls below the support ranges and maintains itself below, there could be a higher likelihood of a more significant correction.
✨What's your opinion? Do you agree?
🔵Remember, always conduct your own analysis and consider other factors before
making any trading decisions. Good luck!"✌️
❎ (DYOR)...⚠️⚜️
Sure, if you have any more questions or need further clarification, feel free to ask. I'm here to help!
if you found my analysis helpful, I would appreciate it if you could show your support by liking and commenting. Thank you!🙌✌
SasanSeifi 💁♂️BTC daily / updateIn the daily timeframe, as you can see, based on past analysis, after a correction from the important resistance zone, the price started moving positively and is currently trading around the price range of $26,900. From a technical perspective, the previous report remains valid, and in the long term, we might witness a price correction towards the correction targets in the price range of $22,600.
Currently, the key resistance levels ahead are $27,300 and $27,800. Possible scenarios to consider are as follows:
If the price manages to break above the important resistance levels on the daily timeframe and holds above them, there's a possibility of further growth towards the liquidity zone at $28,200 and the supply area at $29,200. In this case, keep an eye on how buyers respond, as a confirmation of selling could result in a price rejection.❗
On the other hand, if the momentum weakens and confirms on lower timeframes below the resistance levels at $27,000, we might observe a price correction.❗
✨What's your opinion? Do you agree?
🔵Remember, always conduct your own analysis and consider other factors before
making any trading decisions. Good luck!"✌️
previous analysis👇

25.8-25.9K targetMorning folks,
Any rally are rejecting fast due to overall fundamental background. And this is not surprising when you have 10-year yield around 4.6% (which will be 5% within a month, we think) and collapse on stock market.
As you could see recent rally has been rejected fast. Now we have few targets, but nearest one is based on bearish engulfing pattern, which we treat as the nearest one. It creates Agreement with Fib level. Thus 25.8-25.9K is the nearest thing to watch...

GBPJPY SELLFX:GBPJPY
Price on GBPJPY is consistently rejecting at Daily resistance. The Daily, 4H, and 1H time frames are bearish, hence we will have a sell bias on GBPJPY.

25.6-25.8K is the next oneMorning folks,
As we've said emotional reactions never stands for long and fundamentals sooner rather than later will take the domination again. BTC not just has reached our 26.4K target but also has broken the K-support area that was around.
Now we're turning to the next one - 25.6-25.8K and do not exclude return back to 25K lows in perspective of 1-2 weeks

26.4-26.5 pullbackMorning folks,
BTC has completed our target of 27.4K. Since current background is not friendly for any rally on BTC, we expect normal market reaction on completion target and strong daily resistance level, watching first for 26.4-26.5K support area.

27.4K still on the tableMorning folks,
Situation has not changed significantly since Thu update. We still keep our short-term upside target around 27.4K. Now price is coiling around 4H K-resistance after completion of COP target (0.618 AB-CD extension).
Here we have two bullish signs. First is - tight standing right under the level suggests attempt of breakout. Second - we have bullish dynamic pressure when MACD goes down while price is not. It points on the same.
That's being said, until next update on Thu, BTC should try to break resistance up and touch 27.4K target

STEPN $GMT Daily Looks close to bottom. Bids around sup 3. Also possibility that it doesnt hold and new all time low is achieved, so i'll only look for spot buys no perps. Mostly depending on BTC pa

LTC Short-Term 1HIntervalHello everyone, let's take a look at the LTC to USDT chart on a one hour time frame. As you can see, the price is moving above the local downtrend line.
After unfolding the Fib Retracement grid, we can determine a support zone from $63 to $62, then we have a second zone from $60 to $59, and then strong support at the price of $57.
Looking the other way, we see that the price is struggling with the resistance zone from $64 to $65, then we have resistance at $67, and then strong resistance at $70.
Looking at the CHOP indicator, we see that there is still some energy to continue the upward movement, while the RSI indicator is approaching the upper limit, but we also have some room to go higher.

GBPJPY SellFX:GBPJPY
GBPJPY broke below 183.094 Daily support and made a retest to previous support now turned into resistance. I am anticipating a move to the downside during the Asian session going into London session.

27-27.4K is possibleMorning folks,
BTC now is living from one news to another, with record low trading volume and no interest to the market from investors. Despite any short-term spikes, BTC has nothing to offer when Fed rate is around 5.5 and forward stock market yield is already lower than short-term T-Bills one.
It makes us think that long-term bearish tendency is intact. In short-term, market has some upside momentum, after completion of our 24.7 XOP target and grabbing stops under 25 lows. Based on this momentum, it could try to climb slightly higher, to 27-27.4K area.
But before this happens, we suggest that BTC will show deep retracement, so we should get new "C" point for our AB-CD upside pattern.

EURUSD wave counter, daily time frameIt is assumed that the ideal pattern is forming with the breaking of the big wave one.
w1=161.8 w3 , w3=61.8w1

Analysis of BANKNIFTY index on Daily chart (1D)Looks beautiful on the daily chart... I'm happy to see the breakout candle of the H&S pattern trendline (pink line)... Now, we can see the higher resistance shifted to 45300 / 45900 and support is shifted to 44500 / 44100
It's just a view of what I observed on the chart. I'm sharing my observation on this platform purely for education purposes and It's not a trading idea. I'm not a SEBI registered technical analyst, so consult your financial advisor before trade and trade based on your own knowledge and risk management...

Nothing to change - 24.7K on the tableMorning folks,
BTC is totally dead, very anemic and tight action. 54% of all transactions now is just deposit/withdrawal operations from broker accounts... We have three reasons to keep our bearish scenario and 24.7K target intact: uncompleted downside AB-CD (XOP) target, signs of bearish dynamic pressure (MACD is bullish while price action is not) and high level of the US bonds yield.
Whether pullback will happen or not - we will see, but definitely not before 24.7K target been reached.

Grayscale ETF hype has vapoured out fastMorning folks,
As we've warned on Thursday - all this hype around Grayscale ETF is purely emotional and speculative. This topic just was used to shake the boat - that's all. Two days after everything returns back.
As we've said already - we do not expect any rally if even Fidelity, BlackRock or whatever else ETF will be approved by SEC. Yes, minor emotional jump could happen but it doesn't change the fundamentals which are totally bearish for BTC.
What really matter - is US yields, that are raising again. BTC recent performance looks bearish and we keep the same target valid - 24.7K, at least. We do not consider any long positions by far.

When the dust settlesMorning folks,
Poor BTC has got occasion to show the rally on a background of Greyscale Hedge Fund and its SEC dispute. SEC has been obliged by court to review its decision, but, guys, to be honest - how this relies to BTC pricing? Whether it will be Hedge fund or ETF, what's the difference. Its just the way of money investing.
Besides, SEC intends to make appellation and could find just different reason to deny. Anyway - we see purely speculative activity around this event that doesn't correspond to BTC pricing or value. And we think this is temporal.
As a result of these conclusions, we keep valid our 24.70K daily XOP target and consider current levels interesting for short entry, as soon as we get some bearish pattern, such as "222" Sell, for example.

No activity - no changes.Morning folks,
So, markets are a bit frustrated by recent J. Powell speech and its indecision. Fundamentally nothing has changed - we still have bearish view on BTC market in long term. High interest rates and coming new spiral of inflation in the US leaves no chances to non-interest bearing BTC.
When T-notes and T-bills already give 1.8% premium to S&P dividend yield.
In short-term, we do not see any activity since our last update. This week we get the bulk of important data so, investors prefer to wait when they will get the numbers. Still, Strong downside momentum and flat action makes us think about 24.4-24.7K target as very probable one.

SasanSeifi 💁♂️INJ👉1D🔻 6.50$ / 5.50$Hey there! In the daily timeframe, as you can see, the trend fluctuates within the price range of $5 and $10.
▫️ Currently, it's trading around the $7.20 price range. The expectation we can have is for the price to continue towards the price range of $6.50 and the support zone of $5.50 with a corrective trend. To better understand the continuation of the upward trend, it's important to observe how the price reacts to the support levels during this correction. Otherwise, if the price manages to break above the resistance level of $8 and establishes itself, we might witness further growth towards the $9 price range. For now, the trend appears to be corrective.📊
🔵Remember, always conduct your own analysis and consider other factors before making any trading decisions. Good luck!"✌️✨
❎ (DYOR)...⚠️⚜️
Sure, if you have any more questions or need further clarification, feel free to ask. I'm here to help!
And if you found my analysis helpful, I would appreciate it if you could show your support by liking and commenting. Thank you!🙌

BTCUSD DailyThere re 2 posibilities tht i have in my analysist.
Red path and Blue path.
Red Path : not able to break from nearest demand area, then go up until nearest supply area, then goes down again to retest demand area on 265xx
Blue Path : able to break nearest demand area then go to nearest support or next demand area. after that, it will bounce up to supply area around 298xx, then will go down again to 171xx with a couple of sideways ofcourse.
overall, it's starting to show the downtrend. use confirmations if u wanna buy or sell.
don't forget stop loss.
