Deeper retracement is possible. 104-105.2 for short entryMorning folks,
So, last setup worked just partially - action started from 101K as suggested but BTC completed only 1.27 butterfly target, showing sharp reversal.
Current reversal is important because market is neither on some target, resistance or overbought. It means that reversal is driven by external factors. Although our long-term bullish view is still valid, with "at least" 110K target, the road to the target might be bumpy, with moderate pullback first.
It means that right now weekly/daily traders should sit on the hands and wait when retracement will be over. While daily/intraday traders could consider short entry from 104-105.2K resistance area by our view.
Daily Charts

ETH is still Bullish!!Hello TradingView Family / Fellow Traders. This is Richard, also known as theSignalyst.
📈This week, ETH has been in a correction phase. However it is still overall bullish long-term trading within the rising channel marked in blue.
Moreover, the green zone is a strong demand and structure.
🏹 Thus, the highlighted blue circle is a strong area to look for buy setups as it is the intersection of structure and lower blue trendline acting non-horizontal support.
📚 As per my trading style:
As #ETH retests the blue circle zone, I will be looking for bullish reversal setups (like a double bottom pattern, trendline break , and so on...)
📚 Always follow your trading plan regarding entry, risk management, and trade management.
Good luck!
All Strategies Are Good; If Managed Properly!
~Rich

101K to 110KMorning folks,
So, since Monday situation barely has changed. As we said - retracement should be small and we pointed 101K support area. 98K is also nice but it is a kind of vital area for this setup.
Now you could see everything goes great. Market is moving out of 101K.
Here is two shapes might be - immediate upside action by butterfly, or still, a bit deeper retracement in a way of "222" Buy. But anyway market has to stay above 98K to keep this scenario valid.
So let's see. By far everything looks very accurate and predictable.

110-111KMorning folks,
So, everything goes with the plan and we still consider 110-111K area as the nearest target.
At the same time this area agrees with weekly and daily overbought, so direct upside breakout hardly possible.
Naturally, when the market is already near the target it doesn't show deep retracement. Thus, we suggest that either upward action continues right from flag shape or 101K support. 98K support area looks cool, but it is more for stop placement and invalidation level rather than for expecting of real retracement there.

102.5K nearest upside target. 110K is the next oneMorning folks,
So, the pullback to 88-89K area that we discussed last time has not happened. Market turns to direct upside continuation. Now it has no big barriers ahead, which means that 110K is the major target for now.
On Intraday charts we have another one - 102.5K which is the nearest one. We consider no shorts by far. For long entry you could use any deep that you would like to. We suggest that 97.50-98K area is quite suitable for this. Deeper retracement will look suspicious.
Watching for 88.5-89KMorning folks,
So, upside spike has happened and our 3-Drive + butterfly patterns are done. Although we haven't got continuation to 98K area that also was on a table.
Now short-term sentiment has changed. Recent data shows that the Fed doesn't need to hurry up with rate cut, yields turns up, so BTC also could follow the common tendency with deeper retracement.
This is the reason why we do not consider any longs today. As a nearest area that might be reached we consider 88.5-89K support.
So, for bulls it is nothing to do. If you're intraday trader, you could consider bearish positions from predefined Fib levels on the picture. 3-Drive hasn't reached its target yet, so 92.5-93K area still could be reached...

XRP is Back!Hello TradingView Family / Fellow Traders. This is Richard, also known as theSignalyst.
📈XRP has been overall bullish from a medium-term perspective trading within the rising channel marked in blue.
Moreover, the green zone is a strong structure!
🏹 Thus, the highlighted blue circle is a strong area to look for buy setups as it is the intersection of structure and lower blue trendline acting as a non-horizontal support.
📚 As per my trading style:
As #XRP approaches the blue circle zone, I will be looking for bullish reversal setups (like a double bottom pattern, trendline break , and so on...)
📚 Always follow your trading plan regarding entry, risk management, and trade management.
Good luck!
All Strategies Are Good; If Managed Properly!
~Rich

98+ actionMorning folks,
So, market mostly stands at the same place where we leave it last time :)
But now our monthly bullish pattern is officially confirmed, so mid term direction is up with 110K target at least and potential progress up to 127K.
Now we see a lot of minor bullish signs pointing on upside breakout attempt. Last time we talked about 3-Drive, but today it seems that it could go out of its limits. Not just to 97K but up to 103 K AB-CD upside target.
Until price is above 91.5K lows we do not consider any shorts. Following expected downside pullback is still on the table but not for this week probably. We return to it later as soon as upside action will be over.

97K and 88KMorning folks,
So picture almost has not changed since our last talk. Now we get great setup on monthly chart with upside potential starting from 110K and up to 127K. And our task now is to join this coming action.
It would be great to get a pullback, but the shape of intraday market has changed slightly and it seems that BTC is forming 3-Drive "Sell" with target around 97K. Hopefully this pattern will trigger the pullback that we need.
If it happens, then the next area that we will be watching is around 88-90K, which is nice support area .
That's being said, our strategy for now is action to ~97-97.3K first and pullback to 88-90K second.
I mark this update as "bullish" due to our first point, but you've got the idea.

Pullback to 87-88KMorning folks,
So, our 2-week journey successfully over, market hits 93K targets and even overcome them a bit, completing H&S AB=CD extension. Now what?
In general we expect very good 1-3 months for BTC based on our recent fundamental report. Speaking about short-term situation. Market is obviously overbought a bit. So we prefer to wait for pullback somewhere to ~87-88K area before considering any new longs.

Will BTC emerge from the local downtrend channel on top?Hello everyone, let's look at the 1D BTC to USD chart, in this situation we can see how the price is moving in a downtrend channel in which we can currently observe an attempt to exit on the top. In such a situation, it must be borne in mind that often exiting the channel gives energy for growth close to the height of the channel itself, which in this situation could give a valuation in the region of $ 100,000 for 1 BTC.
However, before this happens, the price must positively exit the channel and break the first resistance line at $ 88,800, and then a significant level at $ 94,200.
Looking the other way, when the price bounces off the upper boundary of the channel and starts to fall again, we have a visible support zone from $ 85,150 to $ 83,000, and then a second very strong zone from $ 77,200 to $ 74,100.

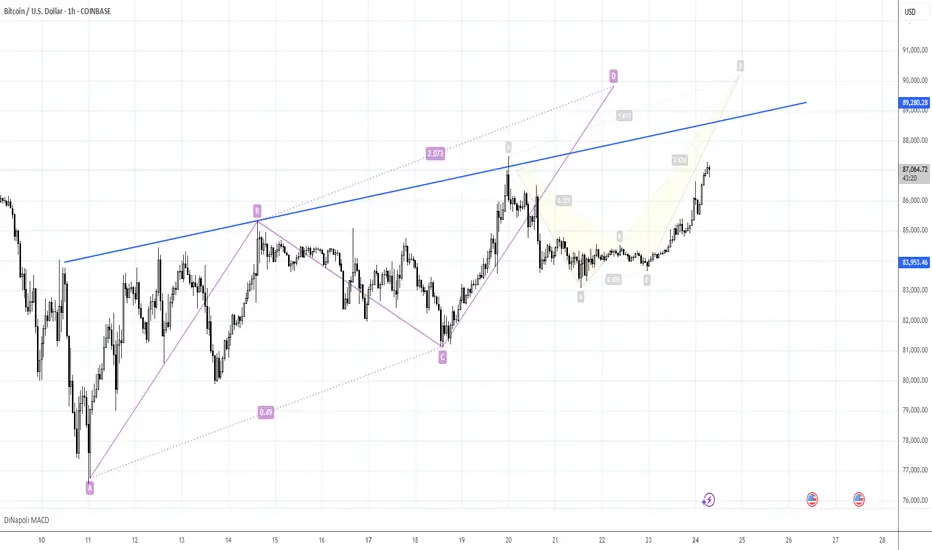
88.5KHappy Easter,
So, our bullish trade is started well. But for now we wouldn't consider too extended targets. Based on AB=CD that we have on 4H chart , next extension is around 93K.
But here is a tricky moment exists and it relates to the H&S shape and strong 87-89K daily resistance. The point is that the right arm is yet to be formed, and it could be started right around 88.5K 1H chart targets.
That's why we're focused on just near standing targets. If Somehow, BTC will jump above 90K, then, the different scenario could appear. But for now we think it would be better to not take more risk and try to extract as much as good result from current positive position.

TradeCityPro | Bitcoin Daily Analysis #67👋 Welcome to TradeCity Pro!
Let’s move on to the analysis of Bitcoin and key crypto indicators. In this analysis, as usual, I want to review the New York futures session triggers for you.
✔️ Yesterday, the price was rejected from the 85,550 area, and today could be a sensitive and important day for the market.
⏳ 1-Hour Timeframe
In the 1-hour timeframe, I mentioned yesterday that the 85,126 trigger had been activated and if the price pulled back to this area and broke above 85,550, we could witness a bullish move and the start of an upward wave. But that didn’t happen—the price was rejected from the 85,550 high and started moving downward.
👀 Currently, with the price stabilizing below the 85,126 area, selling volume has entered the market, and the price is moving down. The last candle closed below the 84,363 area, and the RSI has entered the oversold zone. If the move continues, the price could experience a bearish leg and move down to 83,233.
🔽 In that case, a break below the 83,233 area could be a good short position trigger, as it would give us confirmation of a trend reversal. But if the move doesn’t continue, this level could turn out to be a fake-out, and the price might head back toward the 85,550 high.
🎲 So today, you can enter a short position with a break of 83,233, and a long position with a break of 85,550. Pay attention to volume and RSI, as they can provide many confirmations for the next price trend.
👑 BTC.D Analysis
Let’s look at Bitcoin dominance. Yesterday, dominance dropped another leg and broke the 63.76 low, but now it has returned to this area and is stabilizing above it.
📈 For a bullish confirmation, dominance needs to stabilize above the 64.12 area, and for a bearish one, it needs to stabilize below 63.12.
📅 Total2 Analysis
Now for the Total2 analysis. This index was rejected from the 965 area yesterday and is now stabilizing below 954. If the bearish momentum continues, the next support level that could hold the price is 932.
🔼 To turn bullish, a break above 965 is required, with the main trigger being 980.
📅 USDT.D Analysis
Let’s look at Tether dominance. Yesterday, it made an upward move and was supported at the 5.44 level. It has now reached 5.52.
✨ If 5.52 is broken, we’ll have confirmation of a bullish trend in dominance. If 5.44 is broken instead, we could anticipate a bearish move and potentially a break of 5.39.
❌ Disclaimer ❌
Trading futures is highly risky and dangerous. If you're not an expert, these triggers may not be suitable for you. You should first learn risk and capital management. You can also use the educational content from this channel.
Finally, these triggers reflect my personal opinions on price action, and the market may move completely against this analysis. So, do your own research before opening any position.

BTC has upside chances until it holds above 81K areaMorning folks,
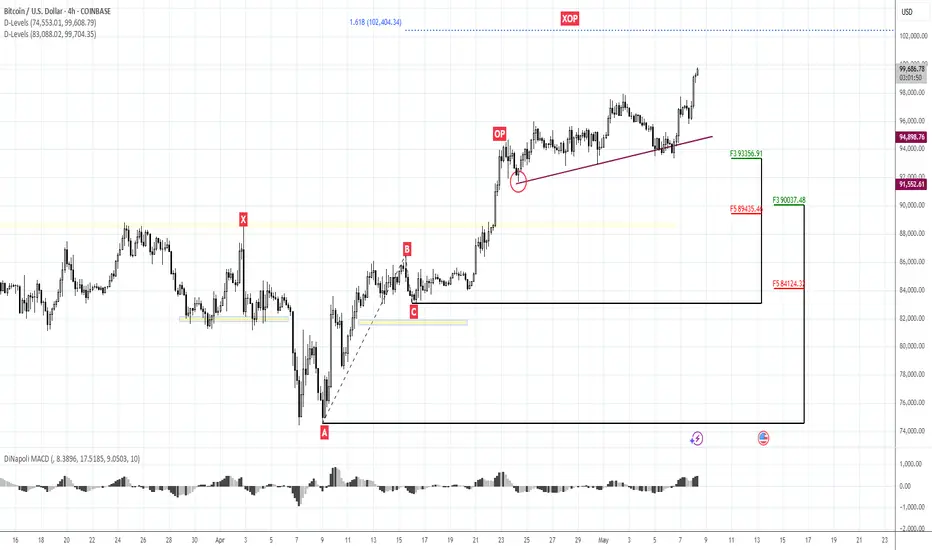
So, picture barely has changes since our last discussion. Right now we do not see any ready-to-trade setups. But suggest some bullish support to the market. After major XOP target has been reached - BTC has not dropped but remains in tight consolidation. This is more a bullish sign.
In general, we could suggest here a kind of reverse H&S shape. It makes us think that until BTC price is above ~ 81K area, it keeps chances on upside breakout. Drop below 81K will lead BTC back to the previous lows.
So, if you would like to buy - try to do this as closer to the lows of consolidation as possible. We consider no shorts by far.

87-88K seems natural targetMorning folks,
So, our 80-85K trade was nice. Now we think that it is not time for big trades, mostly because many markets, and especially US bonds and dollar are overextended. That's why for a few sessions we're focused on near standing targets.
BTC daily chart shows strong resistance around 87-89K area, which is also might be the neckline of potential reverse H&S. We already talked about this previously.
It is the 2nd reason why it would be better to focus on something close. Thus, on 1H chart setup might be looking like you see on the chart. We hope that 83K support will hold. Otherwise, this trade has no sense, because stop placement below 81K support makes risk/reward ratio unattractive.
Thus, supposedly 87-88K is an upside target. And we hope that BTC will stay above 83K.

80K pullback is done, but it is not for selling anymoreMorning folks,
So, the upside bounce to 80K resistance that we were watching is done now. It has happened even twice. D. Trump so efficiently tarrifying markets, and them provides them the relief that BTC mostly is just a hostage of this so called "news stream". Actually as well as all other markets.
Once 90 day tariffs postpone has been provided, stocks jumped and liquidity returns, supporting all other things around. It might be temporal? Sure. But nobody knows what in the old Donny's head.
By looking at current action, it seems that 80K support is more reasonable to use for long entry with 85.5 target at least. Definitely it would be better to not sell by far...

XAUUSD big fall incoming?
OANDA:XAUUSD
The price has gone crazy today. I haven't seen a daily candle like this in a long time. I will be looking to short the market, since I still stand with the statement that on Trumps' tariffs plan, and we can also see a supply zone on a daily timeframe, although I've heard that the federal reserve will cut rates, meaning bearish TVC:DXY therefore bullish for OANDA:XAUUSD . There is also an FOMC meeting today, so I will keep an eye on the decision and change of policies.
Anyone short? Any thoughts?
Pullback to 80KMorning folks,
So, our long-term bearish journey that we were following for 4-5 weeks comes to an end. BTC more or less hit our 74K target and strong weekly support area .
The next one stands around 69K, but market strongly needs a new driving factor to break ~70K support area, and hardly this will happen this week.
Taking in consideration that market is oversold, now we set a tactical target- pullback to 80K resistance area , and then we will see, should be sell again or not.

86K for another short sellMorning folks,
So, not occasionally we said in previous 2-3 updates that BTC action doesn't look bullish and we suggest a new nosedive. Now we have bearish engulfing pattern on weekly chart . And consider these two Fib levels for another short entry attempt. Of course, 86K would be just perfect, but it could start earlier. One of the possible shapes we consider a downside butterfly.
In general, re-test of 70-73K area on average fits to our long-term view.
In a case if 86K will be broken, it could mean that market is tending to 93.5K target, based on daily AB=CD pattern . But we consider this scenario as less probable due on overall BTC heavy performance in a recent few weeks.
Thus, for now, if you want to make a scalp long trade, you could try, but better to set initial target not higher than 86K.
Our major scenario is bearish and we consider 84K and 86K Fib levels for accumulation of a bearish position, unless something extraordinary will happen.
Profit to everybody, Peace.

BTC DAILY - MA compression On the daily timeframe something very interesting is happening. A convergence of price around the blue KEY S/R is very interesting when you factor in what the moving averages are doing around this level also.
1D 200 EMA is completely flat having lost all of its momentum with the months of chop and then the sell-off into current levels. For a bullrun to be credible you want to see price above this level and a steady/steep slope up. Due to the lack of direction of this moving average price is able to climb above and drop below very easily and therefor it is neither support nor resistance until there is a trend.
1D 25 EMA is a different story, now that BTC has put in a local top and trending down, the 25 EMA is resistance but has been flipped in the last few days with price bouncing off the level 4 days in a row. This is good news for the bulls but the longer we linger here there is more chance dropping back under it.
Diagonal resistance as simple as it is has 4 points of contact and will be a big point of resistance and one many traders will be keeping an eye on.
On the lower timeframes we're seeing a bullish channel, a loss of this channel would be a huge red flag and a catalyst for a risk off event IMO, continuing the downtrend.

90-91K Short setup updateMorning folks,
So, today we need just 1H chart as not many events happened. In a recent two weeks people start making upside revisions on BTC price, based on recent JPow comments on QT contraction.
We agree that it has some reasons and supportive to BTC, but they forget that GDP forecast was cut, while inflation increased, which points on stagflation signs.
This is the reason why we do not want to overestimate the positive effect of QT contraction. We still think that BTC could show the pullback to ~70K area.
Now we have three different patterns that point on this level. Since our last update we've got the flag consolidation, that suggests upside continuation. AB-CD based pattern also point on 90-91K area.
So, we still keep our idea to consider shorts around 90-91K area

Watching for the same 90K area Part IIMorning folks,
Here is just minor update to our last idea. BTC mostly was flat in recent two sessions, so action is started only today.
So, the plan that we've prepared remains valid. Since an area around 90K is a strong resistance, we think that short entry attempt there is relatively safe, and at least should give us the chance to turn it to breakeven trade.
Now, on 1H chart we have two patterns that point on the same area.
90-91K seems interesting for short sellingMorning folks,
So, our worryings were not in vain - we've got action to 88-89K area. Now our 4H "222" Sell is completed.
At the same time, now we have the bigger one on a daily chart. Since 90-91K is a rather strong resistance area, we suggest that attempt to sell there should be relatively safe, once the upside AB=CD target around 90.5K will be completed.
So, I mark this idea as "bearish" although price could raise a bit more.
