Daily review of BTC interval 4HHello everyone, let's take a look at the BTC to USDT chart over the 4 hour timeframe. As you can see, the price is moving above the local uptrend line.
Let's start with the designation of the support line and as you can see the first support in the near future is $ 23,945, if the support breaks down, the next support is $ 23,754, $ 23,578 and $ 23,422.
Now let's move from the resistance line as you can see the first resistance is $ 24,258, if you can break it the next resistance will be $ 24,493, $ 24,690 and $ 24,882.
Looking at the CHOP indicator, we can see that in the 4-hour interval we have a lot of energy and the MACD indicator shows a local downward trend.
Daily Charts

Tactical bearish setup is readyMorning folks,
Our long term view stands intact - we do not exclude action up to 30K or even to 36K resistance within 6-9 months due changes in fundamental background - starting QE activity from the Fed and massive US government programmes up to $1 Trln. This should flow more liquidity on the markets. This is the way how Democrats would like to create the visuality of success, prosperity before November elections...
In short-term our XOP on 4H mostly is done, as well as butterfly. Thus, bears could think about position taking with initial stops above daily K-resistance of 26.35K. But this is tactical pullback by far. Do not merry the position, and better to focus on the lower border of daily channel, as the target by far.

this is my NJ 4hr/ daily mark up within this chart mark up i have tabs listed with details of my analyst feel free to review and even put the trades in demo first lets goooo

GBPUSD for a new test of the 1.23 🦐GBPUSD on the 4h chart after the recent lows retraced at the 0.5 Fib level below an important resistance.
The market is moving between the 0.5 and the 0.382 level.
How can i approach this scenario?
I will wait for the EU market open and IF the price will break above we will check the opportunity for a nice short order according to the Plancton's strategy rules.
------
Follow the Shrimp 🦐
Keep in mind.
🟣 Purple structure -> Monthly structure.
🔴 Red structure -> Weekly structure.
🔵 Blue structure -> Daily structure.
🟡 Yellow structure -> 4h structure.
⚫️ Black structure -> >4h structure.
Here is the Plancton0618 technical analysis , please comment below if you have any question.
The ENTRY in the market will be taken only if the condition of the Plancton0618 strategy will trigger.

Next target is 25.5-26.2KMorning guys,
As we've said few weeks ago - the Fed strategy is changing and we take off the table 9K and 12K target for at least 6-9 months, when BTC could feel pretty nice. Recent CPI data also should have long lasting effect, letting Fed to act with more freedom and not as aggressively, which is inspired stocks and crypto markets.
As NFP report as CPI data supports our short-term scenario with 25.5-26.2K targets. It could be finalized by butterfly on 4H chart. Once it will be completed - bears could consider short-term position taking with stops above 26.2K resistance on daily chart, while bulls just need to wait for the pullback out of the same area to consider position taking once pullback will be over.

Short-term context is bullishMorning folks,
So, upside action has started accurately once the butterfly and XOP target have been completed, based on our previous update. BTC feels safe on the background of recent Fed money market activity. Last week was injected about $25 Bln, so should be no problems from this side. The only risk factor this week is CPI on Wed.
As we've said recently - we do not consider the new shorts by far. On 1H chart market is going with the reverse H&S pattern. If you have missed both chances to buy - as on our previous update, as later, when H&S was formed, now the chance could come after OP target completion.
Since we have major target around 25.3-26.2 area, the XOP target here, which is around 24.6K also should be completed, right? Thus, if BTC will show any pullback once OP is done - this could be the chance for long entry. It is vital that price remains above the neckline. Thus, support area around 23.3-23.5K looks OK to consider long entry.

I see confirmation to go long Currently the market is at a major key area and as seen on higher timeframes it shows that EURUSD is in a uptrend, my trendline at the bottom confirms it as well..

Eur/Jpy Short Eur/Jpy is on its Trend Continuation level. Waiting for a chart pattern(Double top or RSI divergence in 1h) or candlestick bearish signal than going short.
What you guys think???

EURUSD can move higher? 🦐EURUSD on the daily chart after the recent low started a retracement move to the upside.
The market reached the 1.02500 level and start a range between the resistance and the 0.5 fib level.
Currently the price is testing the upside resistance and further bullish move can be expected with the vs US pair gaining strength.
How can I approach this scenario?
I will wait for the break above and in that case I will look for a nice long order according to the Plancton's strategy rules
––––
Follow the Shrimp 🦐
Keep in mind.
• 🟣 Purple structure -> Monthly structure.
• 🔴 Red structure -> Weekly structure.
• 🔵 Blue structure -> Daily structure.
• 🟡 Yellow structure -> 4h structure.
• ⚫️ Black structure -> >4h structure.
Here is the Plancton0618 technical analysis , please comment below if you have any question.
The ENTRY in the market will be taken only if the condition of the Plancton0618 strategy will trigger.

NZDJPY on a bearish move? 🦐NZDJPY on the daily chart is currently testing the weekly support after a few rejections by the strong descending trendline at the highs.
The market right bounce today to the upside to gain the strength for a break below.
How can i approach this scenario?
I will wait for a potential break of the support area and in that case i will look for a nice short order according to the Plancton's strategy rules.
--––
Follow the Shrimp 🦐
Keep in mind.
🟣 Purple structure -> Monthly structure.
🔴 Red structure -> Weekly structure.
🔵 Blue structure -> Daily structure.
🟡 Yellow structure -> 4h structure.
⚫️ Black structure -> <4h structure.
Here is the Plancton0618 technical analysis , please comment below if you have any question.
The ENTRY in the market will be taken only if the condition of the Plancton0618 strategy will trigger.

22-22.4K is potential reversal areaMorning folks,
As Fed has chosen money printing strategy we postone scenario with downside collapse to 9-12K area for 6-9 months. Now, additional liquidity flow should stabilize as stocks as BTC market, and even let him to rise a bit.
In short-term we consider the same 21.95-22.25K support area on 4H chart as then one, where BTC potentially could turn up again and keep moving to our 25.5-26.2K target. But the shape of reversal might be different, although it has minor value to the overall scenario.
Personally, I like this one - if price finally completes our XOP target here and finalizes it by butterfly. But it is no problem to buy right now and not to wait for butterfly, if you able to place stop below 21.9K area.
We do not consider taking short positions by far.


AUDUSD looking up 🦐AUDUSD on the 4h chart after a downtrend that started from the 0.7600 level reached the weekly support at the 0.67500 area and bounced over it.
The market after a couple of attempts to break the support area started a retracement to the upside and broke the 0.68500 zone.
How can i approach this scenario?
I will wait fro a clear break of the 0.7000 resistance and in that case i will look for a nice long entry according to the Plancton's strategy rules.
–––––
Follow the Shrimp
Keep in mind.
🟣 Purple structure -> Monthly structure.
🔴 Red structure -> Weekly structure.
🔵 Blue structure -> Daily structure.
🟡 Yellow structure -> 4h structure.
⚫️ Black structure -> <4h structure.
Here is the Plancton0618 technical analysis , please comment below if you have any question.
The ENTRY in the market will be taken only if the condition of the Plancton0618 strategy will trigger

Bullish divergence on 1h chart - idea for today 01.08.2022Hello last mine ideas went good soo, here is mine another idea. BTC went down a bit as i predicted yesterday. But today we can see bullish divergence on 4h chart and 1h chart. also ichimoku cloud is under the price on 4h chart that means we are still in uptrend. confirmation to went up over 23800 would be bullish sign.(there is baseline there)

Fundamental background has changedMorning everybody,
Under negative GDP numbers and Fed trash talks, there are few who signed a shift in fundamental background. US government and Fed are defeated by inflation and turn back to QE(as well as ECB). Fed fails to keep QT pace, buying less bonds that it has promised. In fact, with spending money from US Treasury deposit - there was no tightening but easing for $250 Bln since the start of the year. Now, new J. Biden programmes on semiconductors and climate should pump additional $1Trln.
All of them sooner rather than later go to the markets. As a result, in nearest 6-8 months we should see the visuality of prosperity when stocks and BTC will stop falling and US yields will stop rising. But this is temporal relief. Inflation remains and will keep going higher, to 20%. Collapse is postponed but it is not cancelled, and will happen anyway.
Still, in short-term, BTC easily could re-test 28-32K area within few months. We keep our long-term 9K and 12K targets, but its reaching aso postpones. Now we do not consider taking new strategic bearish positions.
In short-term it seems that 22-22.3K area and 20.3K area are interesting to consider long entry, with invalidation point below 20K. We endure daily upside channel with next upside target around 25.5K and 26-26.2K major daily resistasnce.
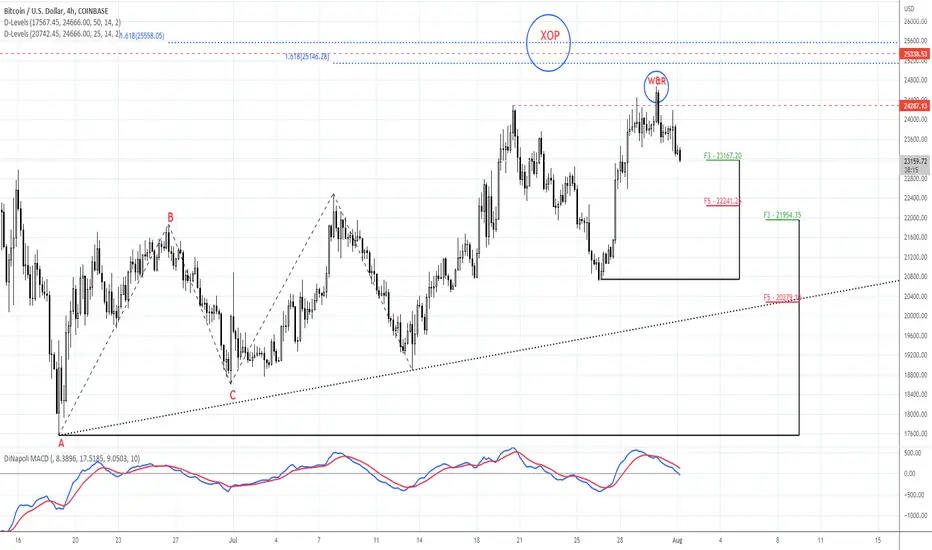
ABB BreakoutThe stock has broken out and retested in the daily charts, therefore may undergo a reversal rally. Trade is supported by Supports Nearby.
Risk Reward Ratio - 2:1
SL is placed below the support zone & the lower trendline. The target is placed near resistance.

S&P 500 ideas for next week.S&P possible scnario: S&P will bounce somewhere around here downside. making hidden bearish divergence and stops around 3 900 support area that there will be potential reversal zone. I am monitoring other markets on weekend and seems correction is needed. When it will bounce from 3900 will make inverted head and shoulders.

USDJPY AnalysisThis is a long term analysis!
USDJPY has hit a resistance on the monthly time frame and choch has occurred on its chart on the daily time frame!
And we have the possibility of falling to the following targets:
TP 1 >>> 129.72 ✅
TP 2 >>> 116.352 ✅
TP 3 >>> 111.254 ✅
of course the analysis will be updated!

usd cad bearish idea based on traders positioninghello traders after a while im back, not so much to say but ill be posting more often , for now just to mention that this is an idea base on traders positioning, im using 4 and 2 hours atr for finding the best tp and sl

RETRACEMENT IN ACTION! USOIL CHART AND MARKET BREAKDOWNAnother breakdown of USoil chart based on monthly, weekly and daily trading timeframe. A potential bullish cycle to test our key resistance zone/liquidity sell POI. Overall, the price is now in a retracement/pullback frame to collect liquidity for continuation downward on the DAILY AND WEEKLY timeframe.
ALL EDUCATIONAL PURPOSELY!!! NOT INVESTMENT ADVICE*

GDP will help?Morning folks,
So, BTC keep showing upward pullback and recent dovish Fed decision has let it to start upward action from predefined level:
As we expect negative GDP numbers, in a moment it should weak the US Dollar, which in turn, should be supportive to BTC and could let it to reach next 25.5-26K resistance area. For position taking you could use most recent swing with invalidation point at 20.7K lows.
But this is only if you like data release games. Otherwise, just wait for the numbers.

EURUSD AnalysisCurrently, the EURUSD is in a downward channel in the daily time frame, and if it breaks this channel upwards, the first resistance zone it has is the range of 1.06710 to 1.07930 .
if it breaks the channel from the bottom, the first support zone is the range of 0.97509 to 0.96.
You can also switch between channels !

At the eve of collapseMorning folks,
So, miracle has not happened and BTC stucked around 23K area - first major daily resistance area. On intraday charts we do not have any bearish patterns yet and could even say that bulls have theoretical chances on upside action to 25.5-26.2K next resistance area, but...
we do not believe that this will happen...
and here is why. With coming big bulk of fundamental data - almost all of them should be negative to stocks and BTC. First is, Google and Microsoft reports on 27th of July supposedly will be worse than expected. 1% rate hike from the Fed also hardly bring optimism to the markets, finally, we expect negative IIQ GDP numbers on Thu, and official US step in recession stage. That's why we stay aside this week from any purchasing of BTC. Maybe we will be wrong, but we prefer to get worse entry price but with clear background, rather than gambling on big statistics.
Technically, we suggest that 20K area is an edge. Downside breakout suggests bearish reversal and downside trend continuation. If you believe that BTC will go up and have different view on coming data - then you could keep an eye on two support areas where BTC stands. First one is 3/8 major support. Next one is 20.15K area, another Agreement with XOP. If BTC is really bullish and tending to 26K area - then it has to stay above these levels.
