Fed is cheatingMorning folks,
BTC was able to show a bit higher pullback, reaching minor 3/8 Fib resistance around 21.30K, although we've expected direct downside continuation. Why we've made a mistake? Well, we've trusted to the Fed promise that it should sell 48.5 Bln assets off the balance... But they have lied. In June they have sold six times smaller amount - just around 0.7 Bln. But it is not all yet guys. Since May, the US Treasury deposit decreased for 300 Bln. Money was withdrawn and sent into economy. It means that net liquidity inflow is + 250 Bln, instead of -48.7B as it should be. So, feel the difference.
Of course the bulk of these money flow to the stocks, which explains why they are stopped dropping. As BTC has 90% correlation with NSDQ, it also gets some money...
But, since the start of the July Fed has sold about 20 Bln (look TW chart WSHOSHO). And markets immediately have turned down again. Thus, it is simple explanation with no changes in fundamental background. This also makes us to not change our opinion and wait for 12K area - our next target. We do not consider any long positions now.
For the short entry you could use bearish flag pattern on daily chart and few Fib levels to decide where to hide the stop. Besides, this week we get new CPI numbers. As liquidity has not been contracted - numbers probably will be above expectations, which provides more pressure on BTC as well...
Take care,
S.
Daily Charts

butterfly re-shapedMorning folks,
As we've suggested last time - butterfly could be re-shaped if BTC shows upside AB-CD action but it makes no impact on its target and on the direction. Now we have three technical reasons to expect downside continuation on BTC market . First is the same bearish dynamic pressure on the daily chart, where MACD stands bullish but price action is not, forming pennant consolidation. Second is, the shape of price now. It is very choppy and indecision, showing no signs of reversal or thrust. Finally - our butterfly on 1H chart with the same 18K target.
Thus, we do not consider any long positions by far and downside action should continue sooner rather than later...

DXYUSDTJuly 5
hi traders
here in the chart we are sharing our idea on apple for you as you can see chart in the daily time frame we have a NAEEM wolf :) wave pattern and we expect these targets.
Good luck my friend NAEEM .

NZDCAD buy idea Daily TFNZDCAD on a buy following previous market chart patterns, two different patterns are signalling a buy. Tend not to trade on a monday, however this is looking more promising.

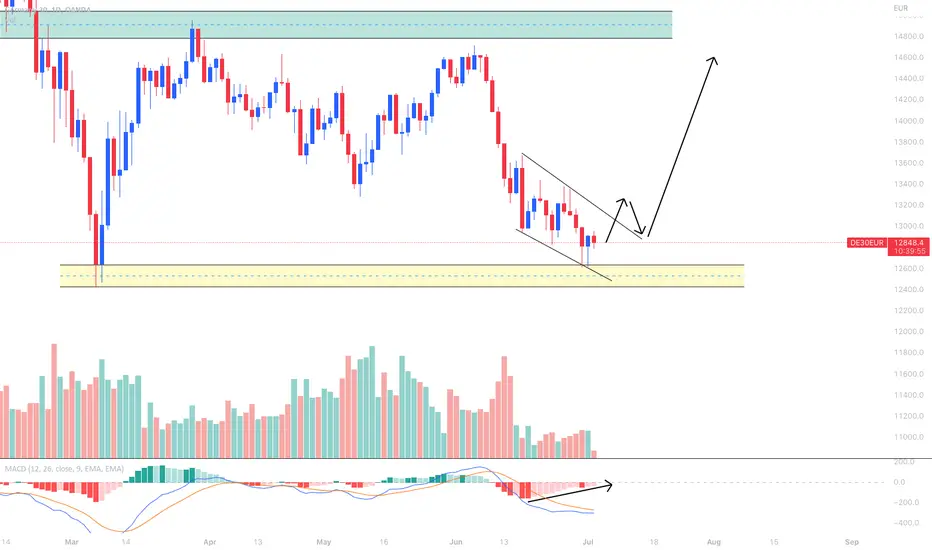
Swing Trading Setup For The DAX 30 – Falling Wedge PatternHi Traders,
Having a look at the DAX30 on the Daily.
We see a potential falling wedge with accompanied divergence across the MACD.
I would like to see a break and retest of this pattern before jumping in.
This is the daily time frame so this would be quite a long swing position.
It's all about patience haha.
Let's see how it plays out.
My target would be previous daily resistance.
Enjoy your Monday!
The Vortex Trader
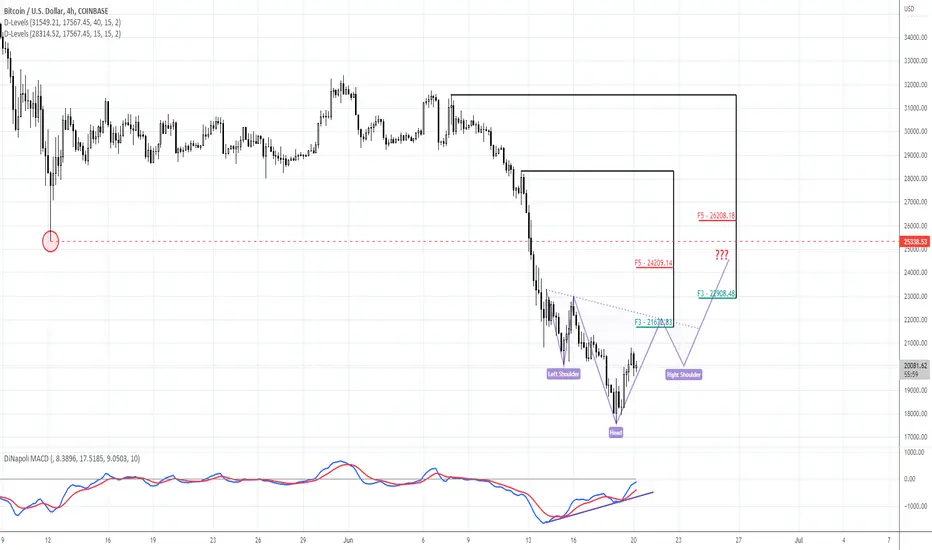
Watching for 18KMorning folks,
It is not occasionally every time we point that we do not consider any long positions on BTC market, despite that show you bullish patterns from time to time. Based on our Fundamental view - it is too early to speak on reversal as Fed has not started the tapering yet, but BTC already has lost 60% of capitalization. So, our approach is to watch for bullish patterns for better estimation of short entry areas.
And take a look - the reverse H&S pattern that we've discussed last time has failed. Although BTC shows slow downside action, but we see few bearish nuances suggesting that it is temporal and sooner rather than later BTC should renew the lows.
Currently it is difficult to find more or less clear pattern, but it seems that on 1H chart it might be the downside butterfly with nearest target around 18K area. The only question is whether downside action starts immediately or BTC will try to form minor AB-CD pattern.
That's being said, we suggest to not buy BTC right now. If you search the way to go short - maybe this setup will be interesting to you.
Take care,
S.

Watching 23-24K for short selling #2Morning guys,
So, H&S that we've mentioned week ago is working slowly. It is not necessary to talk alot about it. Since bearish fundamental background has not changed and we still have long term 12K target - we consider this pattern as the chance to get better entry price on the short side. Thus, if miracle happens and it works, then 23-24.2K area seems like nice resistance for selling.
Conversely - H&S failure and drop below 20K lows is not the worse scenario for the bears. It also tells that upside party is over.
For the bulls - if you have taken position with this pattern, move stops to breakeven and watch the movie.

Bitcoin in 1 Minute - Day 10Hello TradingView Family / Fellow Traders. This is Richard, as known as theSignalyst.
I just started a new series where I will analyze Bitcoin in 1 minute for 500 Days!
Let me know if you like the idea.
Always follow your trading plan regarding entry, risk management, and trade management.
Good Luck!.
All Strategies Are Good; If Managed Properly!
~Rich


USDCAD moving higher 🦐USDCAD on the daily chart is trading below a weekly resistance.
I would expect some more bullish development and a test of the 1.33 area can be expected.
How can i approach this scenario?
I will wait for the EU market open and check for a possible break above the structure.
IN that case, i will search for a nice entry point according to the Plancton's strategy rules.
--––
Follow the Shrimp 🦐
Keep in mind.
🟣 Purple structure -> Monthly structure.
🔴 Red structure -> Weekly structure.
🔵 Blue structure -> Daily structure.
🟡 Yellow structure -> 4h structure.
⚫️ Black structure -> <4h structure.
Here is the Plancton0618 technical analysis , please comment below if you have any question.
The ENTRY in the market will be taken only if the condition of the Plancton0618 strategy will trigger

How to find local tops in a downtrendIn my previous post I published the idea of a massive bear market rally.
This idea is still in the books, however, it may take days if not weeks to play out (if it does)
As a result, it is important to spot local tops and re-balance lower (not just to maximize your profits but more importantly to avoid getting rugged)
When we started the daily, the main idea was that we will definitely wick below the daily open and into the body of the previous daily candle without erasing more than 50% of its gains
(I expected the wick to touch 19582 and it came really close, got an entry around 19600 - more about how to spot local bottoms in another post).
As for the local top, I was expecting it to be between the wicks of two recently printed candles that we haven't visited since they were printed.
Normally, I would look for candle bodies (textbook PA). However, I knew from recent price action that there were many stops around the 21k area so I looked for wicks instead (liquidity hunting).
The main idea was that PA will try to stop those who shorted the top of yesterday's wick as well as FOMO anyone who sold that yesterday's wick to buy back into the market (and get trapped at a higher price)
At the same time I thought that PA would not allow people who bought the top of the wick of 17/6 to sell (exit) without a loss.
My thesis was enhanced by the Distribution that took place in the Low Time Frames (More about Distributions in another post) as well as the liquidity hunt that happened before the rug pull.
This resistance worked like a charm. I am sure we will break it next time but first we need to go lower and find demand / exhaust sellers.

Watching 23-24K for short sellingMorning folks,
Well, as you know - we're sceptic on any bullish setups that BTC is forming, just because we know the fundamental situation and it has no chances to normalize within few years. Thus, we keep valid our long-term targets on BTC of 12-13K and next is 8-9K.
Now market has big technical problems - it has no more strong supports, it is not at oversold and it is re-testing previous vital top of 20K. If price breaks it down - bitcoin sets the new "old" trading range of 3-20K. But, this is a bit longer-term story.
In short-term, market is taking relief after tough week, and all assets show the pullback, including interest rates. Thus, BTC could try to do the same, although, last time it was not able to form even minor reverse H&S on intraday chart, that we've shown you.
WE do not plan to trade any bullish pattern, but we use it for special purpose. If pattern is formed - it shows us what levels to watch for short entry. Right now, if miracle happens and H&S pattern will be formed - supposedly 23.5-24K area might be interesting for new short entry.
Still, it is not forbidden to make scalp long trades. We ignore it because trading time scale and because they are very unstable in current environment - but if you feel confidence, you could try.
Is It Over, Are We There Yet? Bitcoin DailyI know the question that is on most people's minds right now...
Is the drop over for Bitcoin?
Is the bottom in?
Bitcoin Daily Chart Analysis
We are looking at the daily timeframe for the BTCUSD pair.
Yesterday we hit a new low set at $17,605.
It is the first time Bitcoin see this price since November 2020.
It is only the second time that Bitcoin goes through $18,000 on the downside...
Now, as for your questions, we have to wait.
Yesterday marked a new low and a break of a very long-term support level and that is the $20,000 level.
Since we just lost $20,000 as support for the first time in years, we have to wait for several additional sessions to close before we can have a better picture.
TD Sequential is at -8 and can easily go lower but that is why we need to wait and see.
The RSI hit its lowest level since March 2020.
We call it weak/oversold but there is room for lower even if prices recover.
We wait for this daily and weekly candle closure.
Prices can grow and close above $20,000 weekly sending out a positive and sure recovery signal, but if instead the weekly closes below we have to be very careful and wait a bit longer to see how things develop.
We will look together at the weekly timeframe later on today and I am hoping that you can join me.
Other factors to consider
Mercury is now fully direct and out of its post-shadow phase, with Saturn going retrograde this can only signal one clear thing... WORK!
To me work translate into a green market and we count this one as a bullish signal; not enough, we need more.
The crypto fear and greed index is almost at its lowest ever... The sentiment reads extreme fear and normally this reflects a market that is bottoming out or going through a crash/bear-run.
The signal in this case is in reverse just like the RSI.
When the indicator is weak, for us it signals that things can easily turn.
When the sentiment is bad down, it is time to prepare to buy because for the majority of people it takes time to adapt to new market development and conditions, they don't know that things will soon change.
While we were looking at the bottom/low, the crash, bear-run, etc. back in January, February, and March of this year, most people are only realizing it now.
While we start to prepare for the next bull phase and the Altcoins market bull run, people are in a panic thinking that cryptocurrency is really done for.
I am not sharing this to degrade the masses or talk baldly about other people...
I am sharing this to point out this amazing tool that we have.
Even though this is public, this is specialized information and can work in our favor.
Knowing things beforehand can lead to success in the long run.
Conclusion
It doesn't matter what happens, after the next drop prices grow.
After a bearish wave comes to a bullish wave...
Patience is key.
We buy and patiently we hold.
Long-term.

NZD/JPYPossible entry could be a retracement on the daily candle and then have it push to the downside to fulfill imbalances in the daily candles. Should we have a break past our stop loss we re-look entry points for a bearish trendline

#TheStrat BTC Broadening Formation 13k to 16k BottomWeekly Chart shows a longer term broadening formation with the purple box as my potential bottom at 13k-16k for BTC
Daily Chart shows we continue to fail to push towards the high of the broadening formation and continue to break lower
4hr Chart shows that we are quickly approaching the long term broadening formation
I would watch the price action around this lower broadening formation and look for bullish reversals.
Educational purposes only, this is not financial advice.

USDCAD moving higher 🦐USDCAD on the daily chart is trading below a weekly resistance.
After the FED decision to increase the interest rates we can see some more bullish development and a test of the 1.33 area can be expected.
How can i approach this scenario?
I will wait for the EU market open and check for a possible break above the structure.
IN that case, i will search for a nice entry point according to the Plancton's strategy rules.
--––
Follow the Shrimp 🦐
Keep in mind.
🟣 Purple structure -> Monthly structure.
🔴 Red structure -> Weekly structure.
🔵 Blue structure -> Daily structure.
🟡 Yellow structure -> 4h structure.
⚫️ Black structure -> <4h structure.
Here is the Plancton0618 technical analysis , please comment below if you have any question.
The ENTRY in the market will be taken only if the condition of the Plancton0618 strategy will trigger

Tactical pullback to 25-25.4KGreetings everybody,
So, BTC goes with our long term view, that suggests next target around 12.17K. Meantime, as market takes the rest after yesterday's thrilling session, minor tactical bounce could happen. If H&S works - BTC could re-test broken lows, which is also 25K-resistance area as well. H&S should start from ~ 21K. If BTC doesn't do it - be prepared for further downside continuation.

USDCHF can retrace to the 0.97 🦐USDCHF on the 4h chart after our previous analysis is looking for a retracement to the upside.
The price perfectly bounced over the support area and is currently trading below a minor resistance.
How can i approach this scenario?
I will wait for a possible break of the structure and in that case, i will look for a nice long order according to the Plancton's strategy.
--––
Follow the Shrimp 🦐
Keep in mind.
🟣 Purple structure -> Monthly structure.
🔴 Red structure -> Weekly structure.
🔵 Blue structure -> Daily structure.
🟡 Yellow structure -> 4h structure.
⚫️ Black structure -> <4h structure.
Here is the Plancton0618 technical analysis , please comment below if you have any question.
The ENTRY in the market will be taken only if the condition of the Plancton0618 strategy will trigger.

EURCHF a turn at the 0.5 Fib 🦐EURCHF on the 4h chart after the test of the 1.05 level retraced at the 0.5 Fibonacci level.
The market, after a few tests of the support area can start a new impulse and is now trading above a weekly resistance.
How can I approach this scenario?
I will wait for the EU market open and check for a possible break above to set a nice long order according to the Plancton's academy rules.
--––
Follow the Shrimp 🦐
Keep in mind.
🟣 Purple structure -> Monthly structure.
🔴 Red structure -> Weekly structure.
🔵 Blue structure -> Daily structure.
🟡 Yellow structure -> 4h structure.
⚫️ Black structure -> <4h structure.
Here is the Plancton0618 technical analysis , please comment below if you have any question.
The ENTRY in the market will be taken only if the condition of the Plancton0618 strategy will trigger.

US30 LONG ON DAILY TFMarket tanked from the anticipated supply / OB / Retail resistance.
We are waiting for the price to come to our demand / Bullish OB / Support.
The market has huge momentum towards the downside, however if in the coming week we see a decrease in volatility and the market goes to the OB and the market might respect out entry level.
However, if this activates i recommend to always make the position risk free at 1:1 RR.

23.5K and then 21KMorning folks,
Those who read our weekly reports on FPA site on fundamental analysis of the US economy probably are not surprised with the BTC collapse. As BTC as the stock market are doomed. We expect 2500 level on S&P on mid-term perspective with further drop below 2000 in longer-term, which means that our long term targets on BTC is 12K and 8K...
Now BTC is challenging the last bullish outpost around 25-26K. This is last 5/8 all time Fib support on BTC. Lower is just a "free" space. Thus, currently we intend to go from one tactical target to another and control oversold levels.
Now daily oversold level is ~21K. Potentially market could reach two extensions. First one is 1.27 and it stands at 23.5K, next one is 1.618 - 21K, that is very close to daily oversold. This is the program until Thursday, guys.
If Fed rise rate for 0.75 - downside action should accelerate. Intraday upside retracement should not be too strong. At first glance, it seems that 26.2K and 27-27.4K are two levels that worthy of our attention, where we could consider short entry.
Obviously we consider no new long positions.

GOLD is moving higher? 🦐XAUUSD on the 4h chart reached as expected the 1870 level and is now testing a daily support.
The market after the break of the structure seems to have enough strength to move to the next structure around the 1890 area.
How can we approach this scenario?
I will wait for the EU market open and check for a possible break of the resistance area .
In that case, i will search for a new entry point according to the Plancton's strategy rules for a nice risk-reward trade.
--––
Follow the Shrimp 🦐
Keep in mind.
🟣 Purple structure -> Monthly structure.
🔴 Red structure -> Weekly structure.
🔵 Blue structure -> Daily structure.
🟡 Yellow structure -> 4h structure.
⚫️ Black structure -> <4h structure.
Here is the Plancton0618 technical analysis , please comment below if you have any questions.
The ENTRY in the market will be taken only if the condition of the Plancton0618 strategy will trigger

BTC might see 50k levels in near futureI know it's been pretty dull for BTC lately but I see possibility of 50k levels to come soon, confirmation of strong bull trend will be when bottom indicator moves above 0 or yellow line.
One reason for above observation is that lately price action has been compressed and I feel its an indication of big player interest area, do not be surprised if current levels are avg price for the most big players when the price ends up really going to 50k
I can't speak on time required for this but I estimate at least 4-5 months.
