NZDJPY - DAILY TECHNICAL BIAS WITH FUNDAMENTAL BIAS#NZDJPY
NZDJPY should be slightly SELL because the MARKET RISK is off now. Also, since NZD RATES are high, we expect NZDJPY to go UP again. We look forward to the future behavior of NZDJPY. The reason is because the interest rate of NZD is higher compared to JPY.
Either way, NZDJPY should be a LONG TERM BUY.
Anyway, the PRICE can go down again on the NZDJPY MAIN SUPPORT, if the MARKET RISK remains in the OFF state, to the 79.56 LEVEL. Earlier NZDJPY was SELL due to strong JPY and MARKET SENTIMENT is RISK OFF. After that, you can definitely BUY at 86.86 LEVEL. For that, MARKET RISK should be ON. STOCK UP, VIX DOWN, JPY WEAK. Besides, the USD should be WEAK.
Dailyanalysis

CAD/USD is going up!I can suggest that we have reached support zone at this price, so it would be okay to make some small trade, but with pretty tight stop loss.
Be carefull - it's not financial reccomendation, just my analysis.
Have a nice day!

AUDJPY - FUNDAMENTAL + TECHNICAL BIAS#AUDJPY
AUDJPY is going down a bit due to MARKET RISK OFF in the previous days. But even now we see that the MARKET is somewhat MARKET RISK ON. We expect AUDJPY to RETRACE to higher resistance.
Anyway, if AUDJPY goes DOWNSIDE again, VIX should go up, JPY should go up, and STOCKS should go down. The dollar should continue to strengthen in this way. If MARKET RISK is ON, you can definitely BUY at 96.63 LEVEL. Currently, the market risk is off. But somehow it may go down to 91.543 LEVEL before going UP. After that, AUDJPY may go up to 96.63 LEVEL.
To buy AUDJPY, VIX must be DOWN and SNP500 must be UP. Further, the TREND LINE should be BREAK. And COMMODITIES should definitely be UP. We are waiting for the change in the above mentioned MARKETS.
If the dollar is strengthened by the FED, MARKETS RISK should be off. Then AUDJPY may become LONG TERM SELL after JPY STRONG.

EURGBP - FUNDAMENTAL AND TECHNICAL VIEW#EURGBP
- Currently the MARKET SENTIMENT for EURGBP is slightly UP SIDE. The main reason for that is the POSITIVE RISK SENTIMENT for EUR. The reason for NEGATIVE SENTIMENT in EUR is USD SELL. All MARKETS including STOCKS are UP due to MARKET RISK being ON. It affects the EUR in a big way.
- EURGBP can definitely go up to the high RESISTANCE LEVEL. EUR may be slightly WEAK due to USD STRONG at the moment. Accordingly, EURGBP can go up slightly until the 0.9136 LEVEL. And after that EURGBP can be SELL to 0.8510 LEVEL.

XAUUSD Daily Projection 26/09/22XAUUSD
XAUUSD finally broke out and fell into the range 1629 - 1646. An attempt to make a correction occurred and was immediately rejected, so the possibility of Loco landing at support 1628 is very possible. Be careful because the price may correct the resistance as well as the MA8 at 1658 before continuing to land at support 1629.
Possible to take
SELL LIMIT 1658.12 SL 1676.72 TP 1629.47
R3 1678.300
R2 1668.290
R1 1659.800
PV 1646.100
S1 1628.440
S2 1616.870
S3 1608.120

EURUSD Daily Projection 26/09/22EURUSD
EURUSD continued to fall and reached support 0.96858 and entered the range 0.96858 - 0.97564. Price correction will be carried out first at the beginning of this week to a minimum to the MA8 which is at resistance 0.97871 before trying to land and break support 0.96858 again and land to 0.96387.
SELL LIMIT 0.97751 SL 0.98622 TP 0.96400
R3 0.98930
R2 0.97871
R1 0.97564
PV 0.96858
S1 0.96387
S2 0.95255
S3 0.94749

AUDUSD Daily Projection 26/09/22AUDUSD
AUDUSD still fell 2 more ranges to close last week. AUDUSD enters the range 0.64428 - 0.65490 and most likely at the beginning of this week AUDUSD will correct the price to resistance 0.65706 before continuing its journey towards support 0.64428.
SELL LIMIT 0.65919 SL 0.66770 TP 0.64488
R3 0.66890
R2 0.66535
R1 0.65720
PV 0.65490
S1 0.64428
S2 0.63828
S3 0.63112

GBPUSD Today's Projection 21/09/22GBPUSD
GBPUSD again tried to penetrate the support area 1.13502 - 1.13695 for the third time this week and re-ejected. The downtrend is still quite visible in this pair with a reversal point at resistance 1.16714. Tonight's FOMC will determine whether the Cable will continue to fall deeper through this support or start a reversal and end the downtrend.
We test the waves with BUY LIMIT at 1.13750 SL 1.13397 TP 1.15400
R3 1.16714
R2 1.15414
R1 1.14139
PV 1.13695
S1 1.13502
S2 1.10793
S3 1.08693

XAUUSD Daily Projection 21/09/22XAUUSD
Like our analysis yesterday, GOLD is trying to break through support 1660 again after being unable to get out of the sideway range 1660 - 1678. The downtrend still looks quite strong at Loco so support 1660 becomes the support to determine whether GOLD can continue to fall or will be stuck in this sideway range until it breaks out occur.
We are waiting for the support at 1660 to be broken before looking for a good SELL entry position.
R3 1685.570
R2 1678.300
R1 1668.290
PV 1659.800
S1 1646.100
S2 1628.440
S3 1616.870

EURUSD Daily Projection 21/09/22EURUSD
The MA Pattern in this pair is again scrambled and unclear after yesterday's false break at resistance 1.00232. The price fell again trying to break support 0.99650 and landed at the support at 0.99228 again. The current price can still be said to be in the sideway zone 0.99650 - 1.00232 which since last week, MA8 has not been able to penetrate its MA100 at all to confirm its reversal.
USE HALF LOT for each position. BUY LIMIT 0.99695 SL 0.98622 TP 1.01033. BUY LIMIT 0.98970 with the same SL and TP.
R3 1.01172
R2 1.00232
R1 0.99923
PV 0.99649
S1 0.99228
S2 0.98930
S3 0.97871

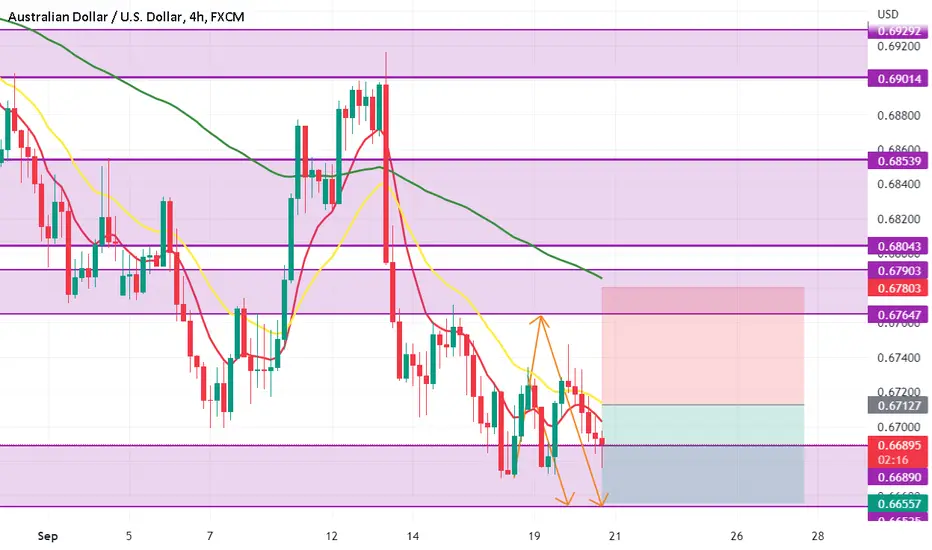
AUDUSD Today's Projection 21/09/22AUDUSD
AUDUSD tried to break support 0.66890 to land at support 0.66535. the price is still in the range of 0.66890 - 0.67647 at the moment where this range seems to be the determining range for AUDUSD whether the downtrend will end soon or continue with a break of support 0.66535.
Doing a SELL does not get a good RR.
R3 0.68043
R2 0.67903
R1 0.67647
PV 0.66890
S1 0.66535
S2 0.65720
S3 0.65500
NASDAQ Daily Projection 21/09/22NASDAQ
NASDAQ is still in its big range at 11675 - 12211. MA Pattern is dipping again, trying to confirm the index's downtrend again. The price most likely will touch support 11675 as long as the MA20 is no longer broken.
Doing a SELL does not get a good RR.
R3 12647
R2 12441
R1 12211
PV 11675
S1 11578
S2 11470
S3 11368

DOWJONES Daily Projection 21/09/22DOW JONES
DOWJONES again tried to break the support at 30535 but failed again. The price is back in the range of 30535 - 30937 with the downtrend pattern that looks strong again. Support 30535 will be the support to determine whether the downtrend continues or not in this index.
CUT HALF 30757 and SL PLUS at 30887
R3 31756
R2 31317
R1 31093
PV 30937
S1 30535
S2 29948
S3 29633

BEARISH INDEX!!! GER30 PRICE ACTION AND CHART ANALYSISWelcome back to another video, today's video is about analysing GER30 (DAX) using the monthly, weekly and daily timeframe to understand and see price movements for possible next direction (either downwards or upwards trend).
P.S NOT A FINANCIAL ADVISOR... JUST EDUCATIONAL AND LEARNING PURPOSE ONLY...

USDJPYThis is my analysis on USDJPY. we are in a long term uptrend on the monthly tf to 4hr tf so our bias for now is to the upside, we can see the retracement to the 4hrs demand zone before we resume the continuation. unless we break the demand no need of selling

NASDAQ Daily Projection 15/09/22NASDAQ
NASDAQ corrected the price to MA8 which is also its 12211 resistance and is ready to go down today. Most likely today the NASDAQ will continue its downtrend towards support 11675 unless resistance 12211 is broken again and breaks the ongoing downtrend pattern.
SELL STOP 12100 SL 12345 TP 11700
R3 12800
R2 12647
R1 12441
PV 12211
S1 11675
S2 11578
S3 11470
