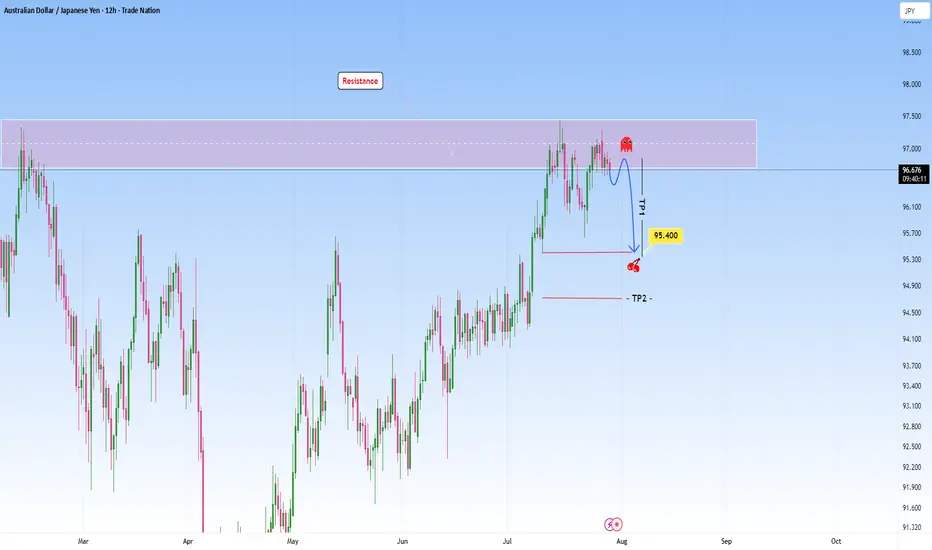
AUDJPY at Resistance: Could we see a reversal here?The market on this pair shows us a classic scenario where price presses into a resistance zone after a sustained bullish move. Price action approaching this zone appears hesitant, with smaller candles and wicks showing signs of exhaustion, meaning the possibility that buying momentum is weakening. There is a clear intention in this structure and I am anticipating a reversal here.
My first target (TP1) at 95.400 is placed just above a previous structure low and it’s a logical level for a partial exit, as price may pause or react there. The second target (TP2), placed even lower, hints at a full mean reversion idea targeting the origin of the previous bullish leg.
The setup requires patience, waiting for confirmation perhaps in the form of a strong bearish rejection before committing to the short. Overall, it’s a disciplined setup that mirrors the kind of analysis I like to gravitate toward: structured, simple and driven by high probability reversal zones.
Disclosure: I am part of Trade Nation's Influencer program and receive a monthly fee for using their TradingView charts in my analysis.
Dailychart
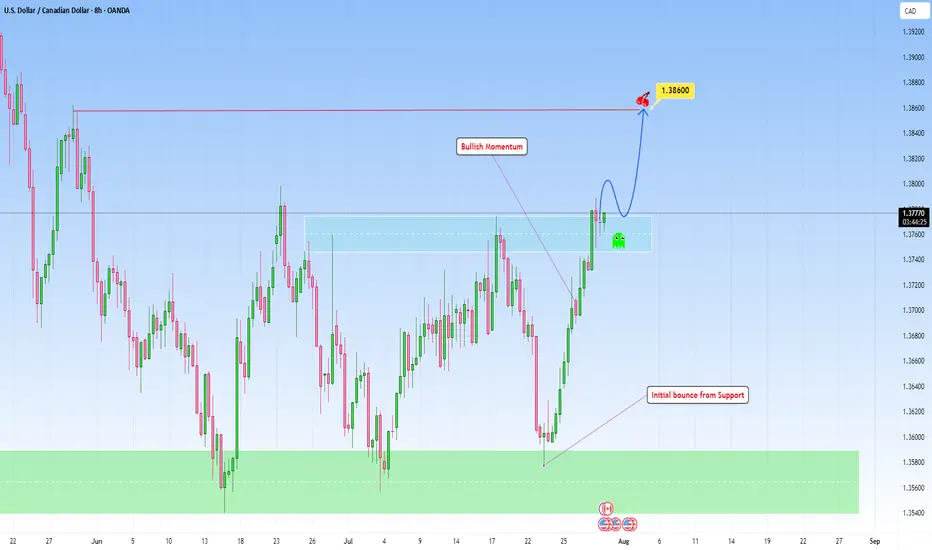
USDCAD bounced from Support and can continue higherLooking at the chart and the overall structure, I think we can favor the continuation setup with a emphasis on price action at key zones, particularly when price breaks out then can revisit this structure for a retest.
This bounce off support has been accomplished in my previous analysis:
Here, if price breaks with strength and dips back into the area and holds with bullish confirmation (likely a wick rejection or bullish engulfing on lower timeframes), that would be the cue to get in.
I am projecting the next target to 1.38600 that makes sense as a logical level for trend continuation and that I find achievable.
XAUUSD – Weak recovery, selling pressure still dominatesHello everyone! What do you think – is it time to buy or sell gold?
After clearly breaking the ascending trendline late last week, gold made a slight rebound from the 3,325 zone. However, in my view, this bounce was relatively weak and mostly technical in nature.
Currently, price is retesting a key confluence area around 3,345–3,355, which includes the previous trendline and a nearby resistance zone.
If we see a clear rejection candle form at this level, there's a high chance the price may reverse and continue its downward trend. The short-term target I’m watching is 3,300 USD – and if that level doesn’t hold, we could see stronger reactions near 3,283.
According to the VRVP indicator, volume is concentrated around lower price levels, suggesting that liquidity is still sitting near previous lows. Structurally, the market continues to form lower highs and lower lows, and with the EMA sloping downward, my primary bias remains to SELL on rallies within the trend.

EURUSD: Buy or Sell?Dear friends!
On our 1D chart, after careful observation, we can see that a wedge pattern is forming. After EURUSD breaks out of the previous trend and completes the correction phase, a new downtrend is likely to be established.
Adam's target is to break above the 1.16000 support level and head towards the lower support level of 1.140000, which is where the pine attracts a large amount of buyers.
And you, do you think the price will go up or down? What is the target for your thinking?

DXY attempting an inverse H&S breakoutSeeing a big green candle today on dxy after confirming the neckline of the inverse head and shoulders pattern as support on the previous daily candle.
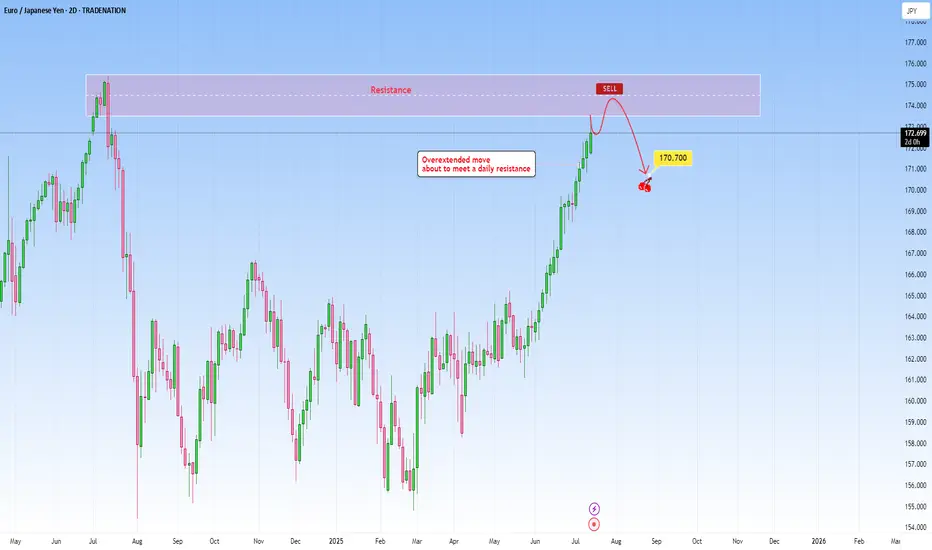
EURJPY: Overextended move to meet daily resistanceThe current market context on EURJPY shows an overextended move that has been pushing higher as price is about to reach a well-established daily resistance. The rally into this resistance lacks healthy retracements, and momentum is likely unsustainable without a deeper correction. The probability of a pause or reversal here under this circumstances increases substantially.
This extension exaggerates this imbalance making it a high probability setup. Volume and price action near this level becomes critical in this case. Signs such as long upper wicks, bearish engulfing patterns will hint that the move may be running out of steam.
I would be targeting a decent pullback towards 170.700.
Just sharing my thoughts for the charts, this isn’t financial advice. Always confirm your setups and manage your risk properly.
Disclosure: I am part of Trade Nation's Influencer program and receive a monthly fee for using their TradingView charts in my analysis.
XAUUSD: Bearish Bias SetupI am watching for a possible reversal in XAUUSD, predicting a rejection with a downside target around 3.300.
This downside target is reasonable based on this setup, as it is based on a previous bullish move, from which price could find support and bounce, or break below, and the downside momentum could start to continue down.
I am just sharing my thoughts on the chart, this is not financial advice. Always confirm your setup and manage your risk accordingly.

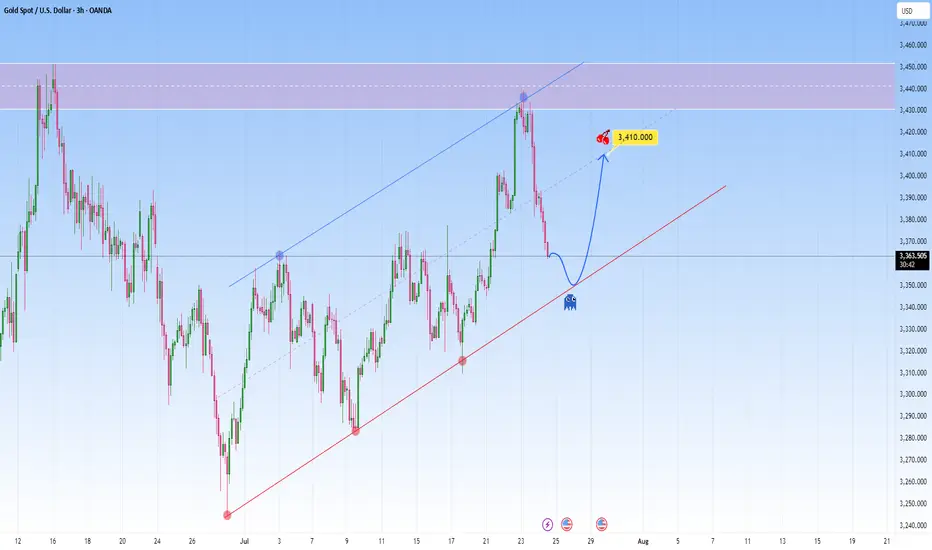
GOLD Reawakened: Corrects firmly but conditions remain bullishFrom a technical perspective Gold is climbing in a parallel channel, clearly bullish with a rhythm that’s hard to ignore. Price just bounced off the resistance with force, a classic overextension flush.
And the market is now approaching the lower boundary of this projected channel. This confluence of technical support is likely to attract renewed buying interest.
I expect it to bounce back toward 3,410, somewhere around the middle of the channel. The move up may not be determined right away. It could be consolitaing, fake dips first, or sudden acceleration.
GBPAUD: Possible bounce at supportI am watching for a possible reversal GBPAUD, expecting a rejection with a upside target at around 2.073.
This area is where it can become a decision point, either price finds support and bounces, or it breaks below, and the move can start to extend lower.
Just sharing my thoughts for the charts, this isn’t financial advice. Always confirm your setups and manage your risk properly.
Disclosure: I am part of Trade Nation's Influencer program and receive a monthly fee for using their TradingView charts in my analysis.

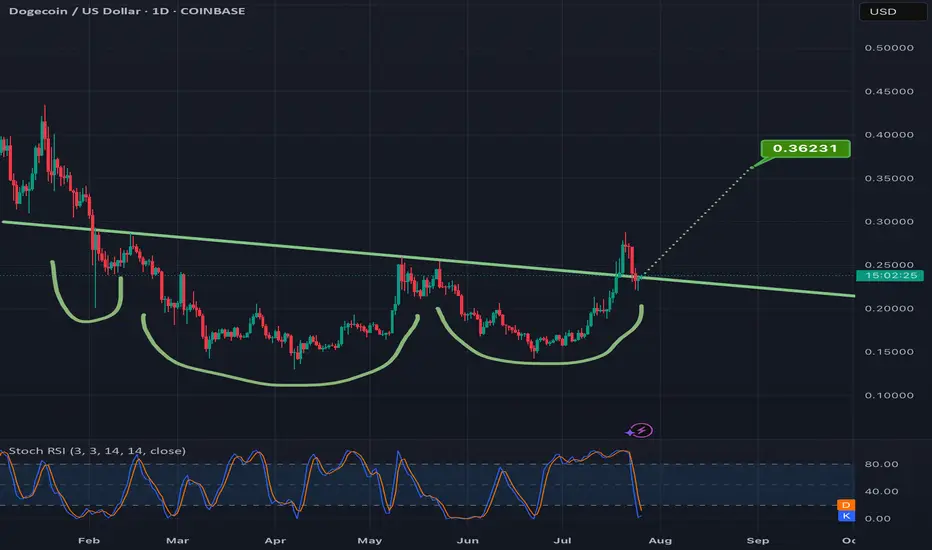
Confirming the breakout of this invh&s on doge can = 50% gainsAlready went above the neckline once and the current daily candle is currently back above the neckline for a second time. Hitting the full target would mean a good 50% gain from current price. *not financial advice*
Gold technical outlook – Signs of exhaustion at channel topOANDA:XAUUSD is climbing within a well-defined ascending channel, and price is now brushing up against the upper boundary, a dynamic resistance zone that has historically triggered pullbacks. If price gets rejected here, we may see a healthy correction toward the key support at 3,350, offering a potential reload point for bulls.
Should buyers step in and defend this level, the bullish structure remains intact, setting the stage for a renewed push higher. On the other hand, a clean break below 3,350 could open the door for a deeper retracement toward the lower edge of the channel, where more significant demand may lie.
All eyes should be on price action and volume in this regio, watch for reversal patterns like bullish pin bars or engulfing candles to confirm entries. As always, risk management comes first. Don't trade assumptions, trade confirmations.
What’s your take on this setup? Drop your thoughts below and let’s discuss!

NAS100 Bigger Picture. Uptrend to be resumedLooking at the current structure through the lens of a trend trading approach, what we saw on NAS100 is more than a simple price bounce, it’s a trend continuation trading within a high-volatility environment. As price is approaching a key resistance level, how price is behaving around this dynamic trendline will be key.
This recent retracement and rejection happening near what we can call a demand zone cluster, was confirmed by a beautiful bounce off the support range. And right now price is respecting the upper and lower bounds nicely.
What happens next? Price is showing signs of bullish exhaustion, but the higher-timeframe structure supports a continuation.
My projected target is towards the upper resistance line, that’s my 23,100 zone as shown.

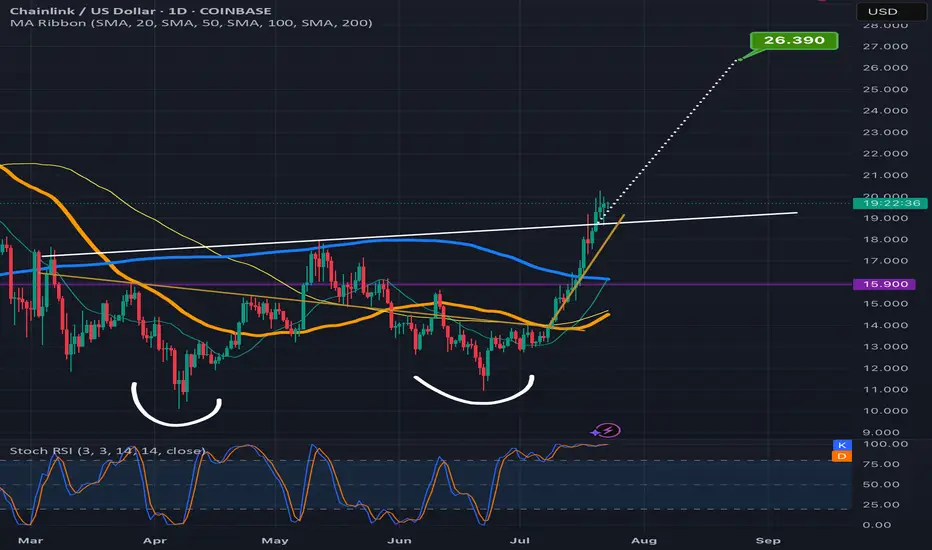
Chainlink climbing the measured move line staircaseLooks like Chanlink is ready to confirm the double bottom breakout here as the past few candles have already started to climb up the measured move line like a staircase.Always possible for a dip back below the neckline at this point but probability slightly favors the readout being validated instead for now. *not financial advice*
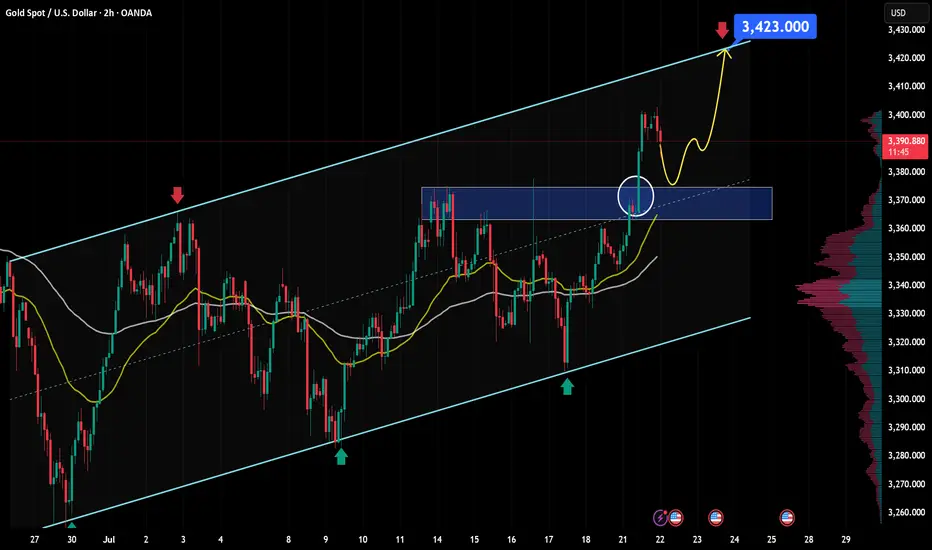
XAU/USD outlook: Bullish momentum building after breakoutGold saw a powerful rally yesterday, surging from $3,350 to nearly $3,400 — an impressive $50 move, equivalent to 500 pips.
From a macroeconomic perspective, this recent uptrend in gold is driven by a combination of supportive factors. First, the U.S. dollar has shown clear signs of weakness following dovish signals from several Federal Reserve officials, who hinted at potential rate cuts if the U.S. economy begins to slow. In addition, geopolitical risks such as renewed U.S.–China trade tensions, instability in the Middle East, and slowing growth in China are all pushing investors toward safe-haven assets like gold. Another key driver is the ongoing accumulation of gold by central banks worldwide — particularly China and Turkey — highlighting gold’s growing appeal as a strategic reserve asset. Together, these factors have built a strong foundation for gold’s upward momentum, explaining why prices remain above yesterday’s opening level, despite the current short-term pullback.
From a technical and short-term outlook, gold (XAU/USD) continues to show a bullish setup supported by both price structure and market sentiment. On the H2 timeframe, gold remains in a clear uptrend, with a series of higher highs and higher lows. After breaking through a strong resistance zone around $3,374 (aligned with the 0.5 Fibonacci level), price surged to a peak of $3,403 before entering a healthy retracement phase.
Currently, the $3,367–$3,374 zone is acting as newly-formed support — a key confluence area that aligns with:
A former resistance now flipped into support,
The 0.5–0.618 Fibonacci retracement cluster,
And a bullishly aligned short-term EMA structure.
In the short term, as long as this support zone holds, the bullish outlook remains valid. A successful retest of this area could reignite buying pressure, with the next target set around $3,423 — in line with the projected extension of the previous bullish leg.
However, if buyers fail to defend this zone, the bullish setup could be invalidated or lose momentum. This area warrants close monitoring of price action and volume behavior to confirm the next directional move.
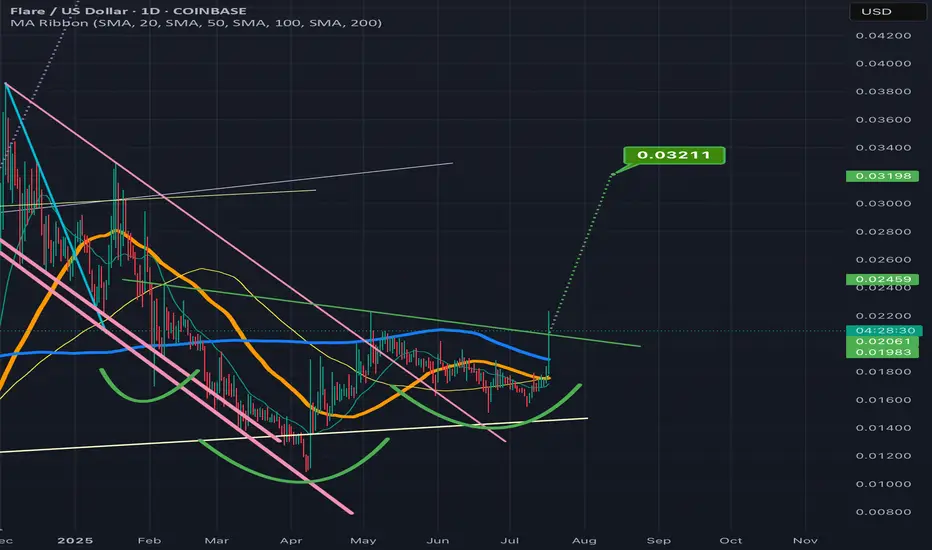
FLRUS breaking above the invh&s necklineNice it confirms the breakout the target is around 3 cents. Could always dip back below the neckline a time or two before that happens, but considering how it feels lke we are finally confirming an altseason here with bitcoin dominance taking a big dump probability highly favors an eventually validation of this breakout on flr. *not financial advice*
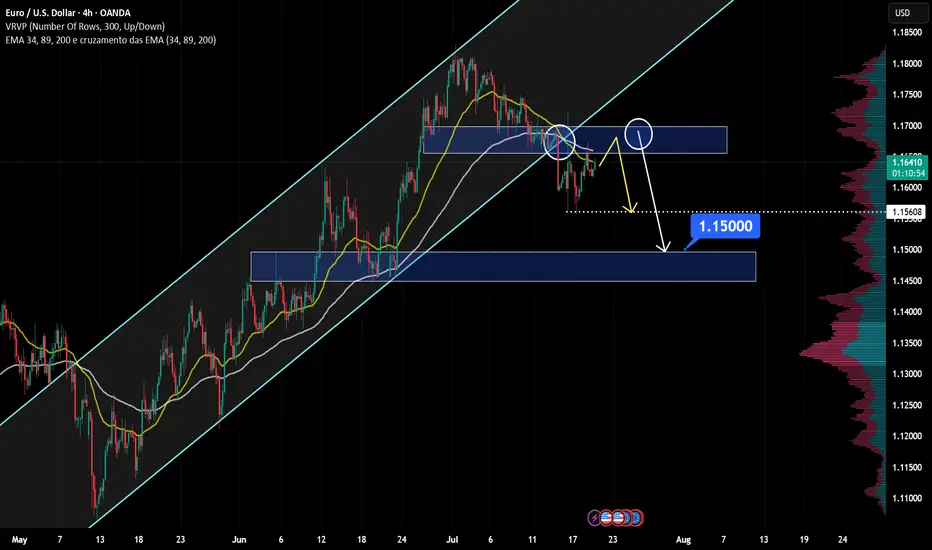
EUR/USD at Resistance – Will Sellers Push Price Down to 1.15000?Hello fellow traders! What’s your take on EUR/USD?
From Brian’s personal perspective:
This currency pair is approaching a key resistance zone, which previously acted as a strong support level. This area aligns with historical price reactions and could serve as a solid foundation for potential bearish movements.
If sellers confirm their presence through bearish price action, I anticipate the price could move toward 1.15000. However, a clear break above this resistance level may signal the possibility of further bullish continuation.
Let me know your thoughts or any additional insights you might have!
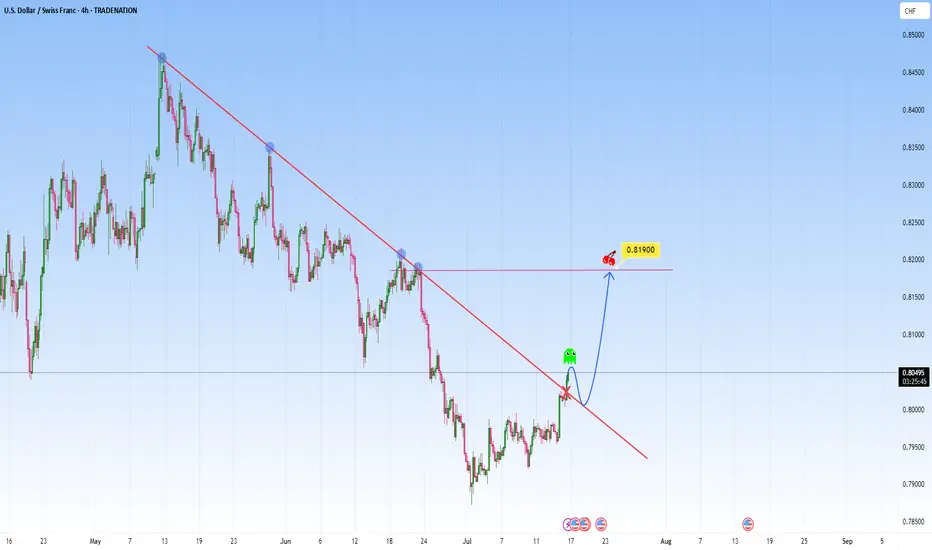
USDCHF: Could be telling a story of break-retest-reversalThe price action on the USDCHF presents an opportunity of structural transition. The descending trendline has acted as dynamic resistance, has contained each rally attempt beautifully. This trendline is marked by multiple rejections, reflected bearish dominance, a controlled downtrend in motion.
The recent movement though could signal a shift. The market has started to break above this descending structure, and it could early suggest that bearish momentum is weakening.
I will be waiting for the price to return to the broken trendline, treating former resistance as newfound support. It’s a confirmation pattern in order to filter false moves, a structure retest that reinforces breakout reliability.
From this base, I am expecting it to target the 0.81900 level, as shown. This area coinciding with horizontal resistance that aligns with previous reactions. Such levels as natural “gravitational pivots”.
An ideal approach here would involve observing the character of the pullback. If the market returns to the trendline with declining bearish volume and forms higher lows on lower timeframes, it strengthens the bullish case.
The trendline break on the chart is not just a signal, it’s a storyline unfolding. It marks a shift with a story. And if volume, price structure, and timing align as they appear poised to, this move could be the first move in a broader upside correction or trend reversal.
Just sharing my thoughts for the charts, this isn’t financial advice. Always confirm your setups and manage your risk properly.
Disclosure: I am part of Trade Nation's Influencer program and receive a monthly fee for using their TradingView charts in my analysis.
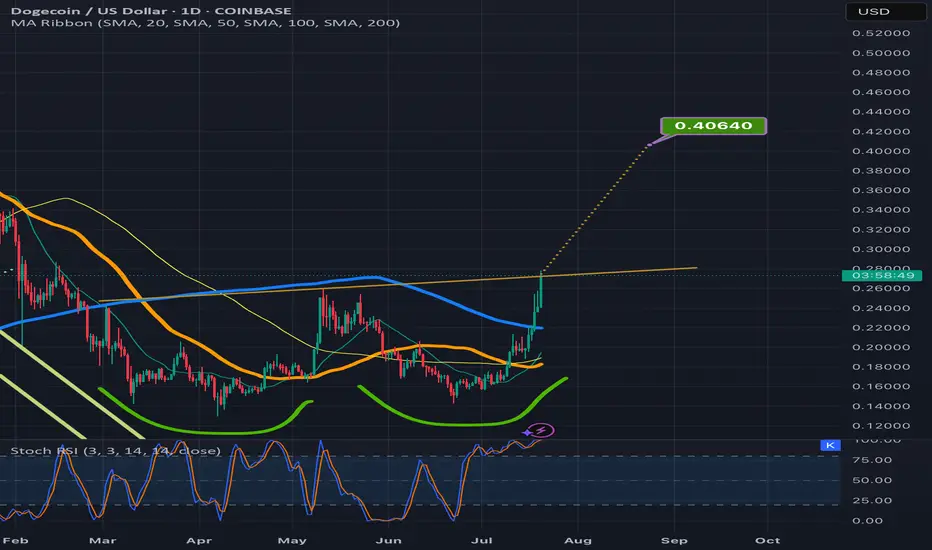
Doge inching above the double bottom necklineIt could easily dip back below the neckline a tie or two before it validates the breakout but definitely getting closer to doing so. Target is around 40-41cents. *not financial advice*
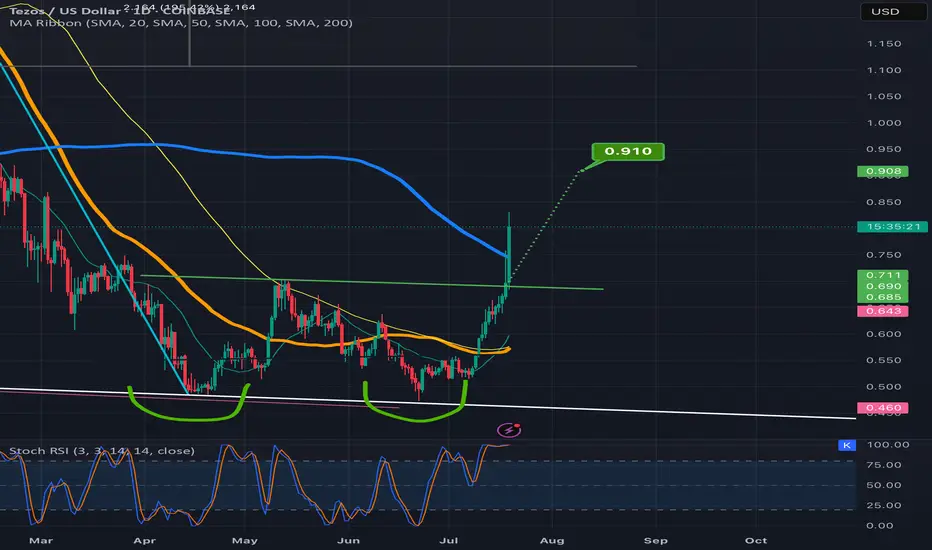
Tezos heading for a double bottom breakout targetPrice action is well above the neckline and already over halfway to the target. *not financial advice*
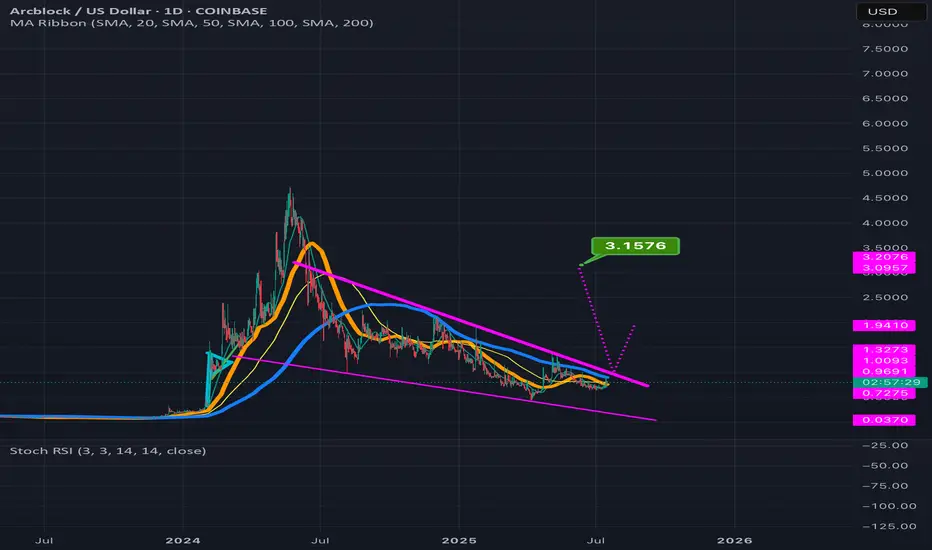
ABT can potentially 4x in value reading up from the wedge its inThe smaller pink dotted measured move line is for the inv h&s pattern its formed inside the wedge with the top trendline of the wedge doubling as the invh&s pattern’s neckline. Hitting that smaller target is more or less a 2x from current price action. If we hit the full falling wedge target that’s a 4x from where it is currently. *not financial advice*
The daily chart for total2 to look at the impending golden crossWanted to also post a daily chart tie frame of my previous idea. I first posted it in weekly to fit the entire cup and handle breakout target in the frame, but wanted to also post the daily time frame to provide both a close up of the inverse head and shoulders pattern as well as the impending golden cross on the daily time frame. Loos very likely that alt season may finally be approaching here. Gonna pay close attention to both this chart and the bitcoin dominance chart btc.d to know for sure. *not financial advice*

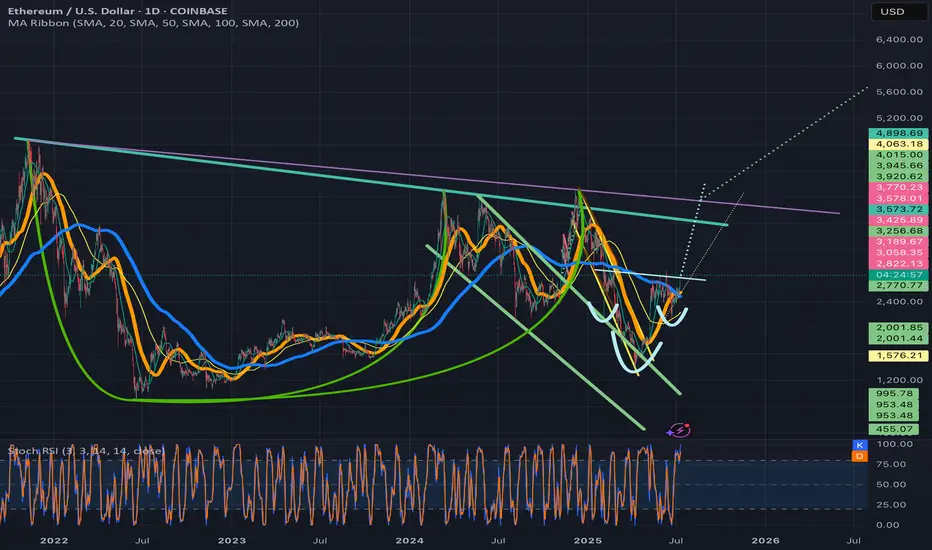
Ethusd breaking above invh&sEthusd chart has a similar set upas the total2 chart, a cup and handle that is breaking up from a smaller inverse head and shoulders that will complete the handle to the cup. Ethereum actually has two potential to trendlines for its cup and handle and I wouldn’t be surprised if both are valid. The breakout target for the inverse head and shoulder pattern will take price action above both of them. Once we solidify the top trendline for the cup and handle patterns as support the breakout target for it is $7161. Ethereum just recently had a golden cross on the daily which adds to the probability the inverse head and shoulder pattern breakout will be validated. *not financial advice*
XLMUSD inv h&s at the threshold of the necklineNo confirmation yet but market currently feeling very bullish here. Likely to breach this neckline in the next few candles. *not financial advice*
