TELL ME WHAT YOU SEE IN GBP/USDPlease if you found this helpful drop a like and follow, let us discuss it in the comment section.
To me, this trend looks like expanding and also counting the ELLIOT wave inside the trend. We should be looking for a buying opportunity if the price continues holding the particular zone
Dailychart

SasanSeifi 💁♂️AVAX👉1D 🔻▪️ Hello everyone ✌️
As you can see, after the almost 30% price drop from the 14$ price range; Currently, the price is trading in the 11$ range.
According to the behavior of candles, the scenario we can consider in the daily time is that if the support range of10$ is maintained, the price will grow to the Fair Value Gap-FVG range of 12.50$ and the important resistance range of 14$. And then, if it is confirmed from the resistance range, we will see the price correction.
In case of a positive fluctuation, to better understand the continuation of the movement process,We have to see how the price will react to the resistance ranges. Otherwise, in case the price penetrates above the important resistance range of 14$ and stabilizes it, We may see more price growth. Possible trends are also identified.
❎ (DYOR)...⚠️⚜️
What do you think about this analysis? I will be glad to know your idea 🙂✌️
IF you like my analysis please LIKE and comment 🙏✌️

AUDCAD at daily horizontal support... The RBA are likely to continue raising rates, more so than the BOC. The real fundamental bias is based on the economic data, though - Australia has released much more attractive economic figures than Canada. In fact, the AUD is a clear buy for me, if and when the price action agrees.
We could see price reverse from the current support at 0.8815. If not, the next key levels are 0.8750 and 0.8600...

ETH/USDT 4HInterval resistance and supportHello everyone, let's look at the ETH to USDT chart on the 4-hour time frame. As you can see, the price is moving above the local uptrend line.
Let's start with the support line and as you can see the first support in the near future is $1712, if the support is broken then the next support is $1694, $1676 and $1650.
Now let's move on to the resistance line, as you can see the first resistance is $1746, if you manage to break it, the next resistance will be $1767, $1784 and $1801.
Looking at the CHOP indicator, we see that there is a lot of energy for the move, the MACD indicates a return to the local downtrend, while the RSI also has a rebound and room for the price to go a little lower.

EURGBP I Trading plan and forecast Welcome back! Let me know your thoughts in the comments!
** EURAUD Analysis - Listen to video!
We recommend that you keep this pair on your watchlist and enter when the entry criteria of your strategy is met.
Please support this idea with a LIKE and COMMENT if you find it useful and Click "Follow" on our profile if you'd like these trade ideas delivered straight to your email in the future.
Thanks for your continued support!

SOL/USDT 1DInterval Resistance and SupportHello everyone, I invite you to review the SOL chart in pair to USDT, on a one-day interval. Let's start by marking with a yellow line, an uptrend from which the price went down and entered a downward triangle marked with blue lines.
Moving on, we can move on to marking support areas when we start a larger correction. And here, the first support is at $19.91, the second support is at $17.66, the third support is at $15.21, and then we can see a drop to $12.12.
Looking the other way, we see that the price will first have to break through the strong resistance zone from $23.41 to $27.01. However, if it manages to break out of this zone upwards, the next resistance will appear at the price of $ 32.20, and then at the price of 38.80.
Please look at the CHOP index, which indicates that we have a lot of energy for the upcoming move, MACD indicates that we are in an uptrend, while the RSI shows an increase to the upper part of the range with minimal rebound.

Don't be fooled by reversal candlesticks this pair BULLISHUSDJPY may be slowing down in pertaining to bullish momentum, but a few other things need to happen for a short. A correction trendline has already been broken which is the first sign. The following must occur on the intraday 4H timeframe for me to short. I need to see a Lower low along with the moving average crossover to the downside. then a retest to the neckline and providing indecisiveness and volatility on the 1H. My first target for any shorts will be the major 38.2 PRZ level. Because this pair is massively bullish, all targets for buys are locked in at -27% then then next daily resistance since price is creating record highs.

Bitcoin daily chart 260523 : On the daily chart we can see that BTC broke the support of the symmetrical triangle formation with a failed attempt to brake back into the triangle (with 27k acting as resistance). Previous failed attempts to brake this resistance line were followed by deeper corrections.
This theory will be invalidated if BTC manages to brake 27,5k and flip it as support.
4-h chart detail of the symmetrical triangle with a retest of 27k and MA50-line as resistance :

USD/JPY BEARISH BUILDING UPBearish building up for USD/JPY. All traders should look for a sell position.
Goodluck

USD/CHF - long positionWe have the USD/CHF on the daily time frame. We can see the downtrend, which is confirmed by indicator 200 EMA. Indicators SAR and RSI remains in the bullish control zone. It may be the right opportunity to take a long position. Final target, take profit, entry price and stop loss are in the chart.

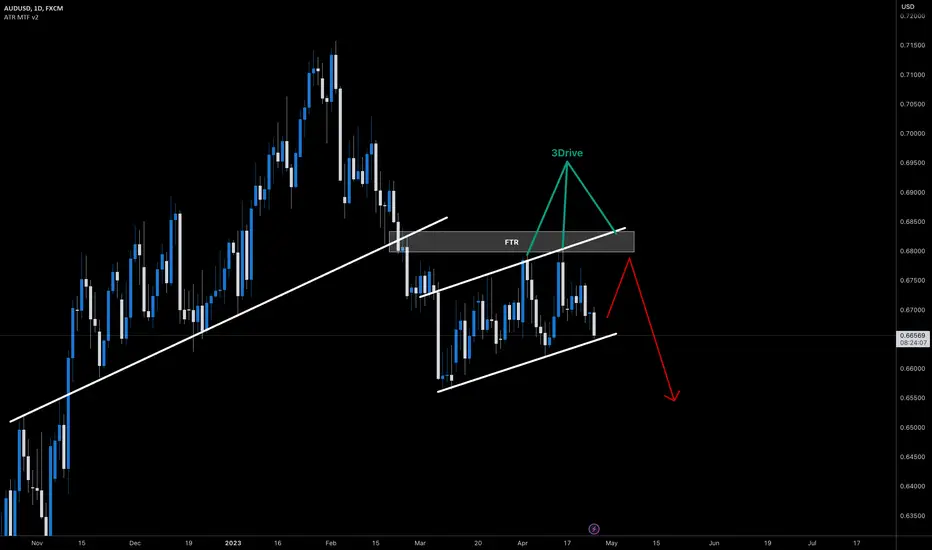
AUDUSD I Brief correction and more potential downsideWelcome back! Let me know your thoughts in the comments!
** AUDSD Analysis - Listen to video!
We recommend that you keep this pair on your watchlist and enter when the entry criteria of your strategy is met.
Please support this idea with a LIKE and COMMENT if you find it useful and Click "Follow" on our profile if you'd like these trade ideas delivered straight to your email in the future.
Thanks for your continued support!

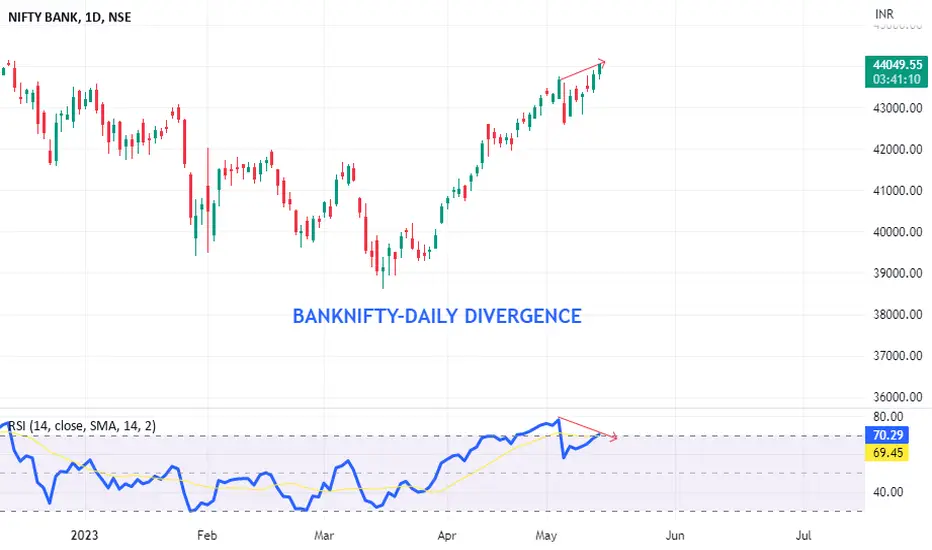
Bearish divergence in BANKNIFTY on daily chartBearish divergence refers to a technical pattern that occurs when there is a discrepancy between the price movement of an asset and its relative strength index (RSI) indicator. In the case of Bank Nifty on the daily chart, a bearish divergence on the RSI suggests a potential reversal or weakness in the uptrend of the index.
The RSI is a popular momentum oscillator that measures the speed and change of price movements. It oscillates between 0 and 100 and is often used by traders to identify overbought and oversold conditions in an asset. When the RSI moves above 70, it is considered overbought, indicating a potential price correction, while a move below 30 suggests oversold conditions and a possible rebound.
In the context of Bank Nifty's daily chart, a bearish divergence occurs when the price of the index forms higher highs while the RSI forms lower highs. This discrepancy suggests that the buying pressure supporting the upward price movement is weakening, signaling a potential reversal or pullback in the near future.
Be cautious on upside trades.
GBPUSD 2H AnalysisLet's have a look at 2H TF, after analyzing Daily TF. Sharp bullish movement expectation.

Daily pulling back on EUWe had a Change of Character on the daily timeframe signaling a pullback. This will be good to look for shorts on the 4H. If we get a Change of Character to the upside after at least pulling back 50% there is a very high chance of continuing bullish and targeting the Daily high so long as we don't go below the Daily strong low

XAUUSD Daily AnalysisHey traders, Bullish after sharp momentum near important 2070 $ level + Weekly Candle as shown, bearish is more porbable

GOLDS BIGGER PICTURE! GOLD ON THE RISE.Hello fellow traders!
XAUUSD has been on the rise since NOV 3rd and has made a fake out at the support level.
Checklist:
✔BULLISH TREND
✔SUPERTREND IN BUYERS POSSESION
✔FIB RETRACEMENT CONTINUATION TO THE 78.6%
✔DAILY TIMEFRAME
14,309 Pip Analysis

GBPAUD I Correction and continuation to monthly levelWelcome back! Let me know your thoughts in the comments!
** GBPAUD Analysis - Listen to video!
We recommend that you keep this pair on your watchlist and enter when the entry criteria of your strategy is met.
Please support this idea with a LIKE and COMMENT if you find it useful and Click "Follow" on our profile if you'd like these trade ideas delivered straight to your email in the future.
Thanks for your continued support!

GBPAUD I It will rise from support Welcome back! Let me know your thoughts in the comments!
** GBPAUD Analysis - Listen to video!
We recommend that you keep this pair on your watchlist and enter when the entry criteria of your strategy is met.
Please support this idea with a LIKE and COMMENT if you find it useful and Click "Follow" on our profile if you'd like these trade ideas delivered straight to your email in the future.
Thanks for your continued support!

XAUUSD D1 AnalysisHey Traders, What an exciting patterns here we have, many believe that gold might need a rest before probable 2070$ breaking, as you can see.

EURUSD D1 AnalysisHey Traders, Bullish compression near HTF pivot increase the probability of reversing.
According to 3Months analysis, we expect fiber to break channel.

XAUUSD D1 AnalysisHey Traders, We have Bullish Channel as Mentioned before.
Sharp Bullish leg after pullback to the middle line.

Big scheme of thingsThe 1h chart for TSLA indicates a major decending triangle formation (in blue) and an ascending tringle (in orange).
The ascending triangle could potentially cross the descending one today and we could see some further movement upwards.
The current RSI is overbought meaning that we could see some price correction in the early hours with some selling action. (to around $190)
My stop loss is still at $185.
