Dailychart


Bitcoin Makin a move UP! Daily Bitcoin Makin a move UP! Daily
Breaking above $25K! Lets see if it can hold!
With all the mess goin on in the Banking sector we could see Bitcoin rally sooner than later...
If BTC can keep making a move to the upside we can see $27K - $30K pretty quick... <---
What is goin on is the reason WHY Bitcoin was created! This could be Bitcoin's time to Shine! Lets Go!
Keeping an eye on this!
Good Luck Out There!

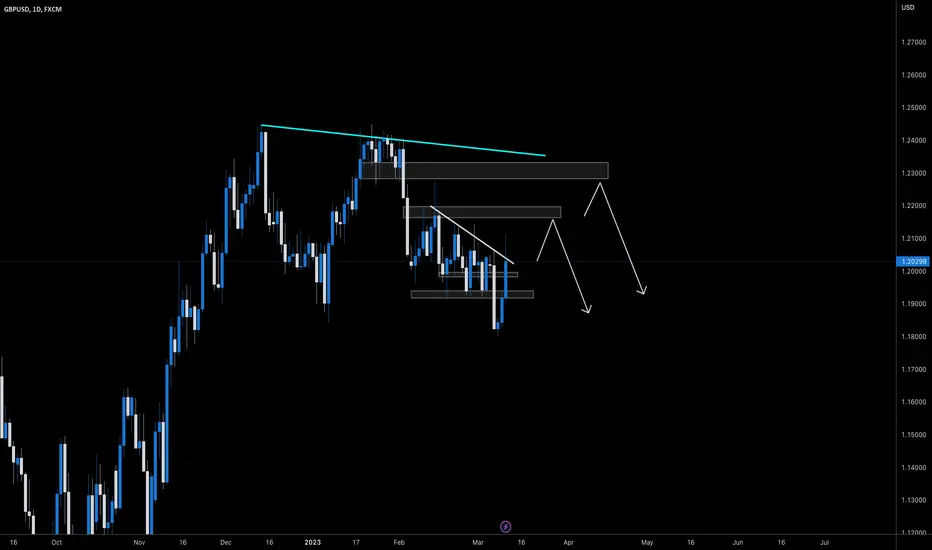
GBPAUD I Short & long opportunity this week!💰Welcome back! Let me know your thoughts in the comments!
** GBPAUD Analysis - Listen to video!
We recommend that you keep this pair on your watchlist and enter when the entry criteria of your strategy is met.
Please support this idea with a LIKE and COMMENT if you find it useful and Click "Follow" on our profile if you'd like these trade ideas delivered straight to your email in the future.
Thanks for your continued support!

EURUSD D1 AnalysisEUR/USD Forecast
Can break 1.07 support level?
If not, we expect declining to 1.03

Daily ETH 4HChart - resistance and supportI invite you to review the chart of ETH in pair to USDT, also on a four-hour interval. First of all, using the blue lines, we can mark the local downtrend channel in which the price is currently moving.
Now let's move on to marking the places of support. We will use the Fib Retracement tool to mark support, and as you can see, the price stopped at a very strong support of $1569 equal to 0.618Fib, we have a second support at $1522, while when the price goes lower we can see a drop to $1461.
Looking the other way, we can also mark the places where the price should encounter resistance on the way to increases. And here we have first resistance at $1591, next resistance is at $1620, then third resistance at $1643, then we have a strong resistance zone from $1667 to $1700.
The CHOP index indicates that the energy has been used. The MACD indicator confirms the local downtrend. On the other hand, on the RSI we see a rebound, and we are moving at the lower part of the range.

Daily BTC 1HChart - resistance and supportHello everyone, let's look at the BTC to USDT chart on a 1-hour timeframe. As you can see, the price is moving below the local downtrend line.
Let's start with the support line and as you can see the first support in the near future is $23232, if the support is broken then the next support is $23017 and $22752.
Now let's move to the resistance line, as you can see the first resistance is $23389, if you manage to break it, the next resistance will be $23505, $23601 and $23694.
Looking at the CHOP indicator, we see that there is a lot of energy for movement, the MACD maintains a local downtrend, while the RSI has a strong rebound, which creates room for new increases.

Daily ETH 4HChart - resistance and supportHello everyone, let's look at the ETH to USDT chart on the 4-hour time frame. As you can see, the price is moving above the local downtrend line.
Let's start with the support line and as you can see the first support in the near future is $1619, if the support is broken then the next support is $1604, $1590 and $1569.
Now let's go to the resistance line, as you can see the first resistance is $1649, if you manage to break it, the next resistance will be $1662, $1674 and $1693.
Looking at the CHOP indicator, we see that we have a lot of energy for the next moves, MACD indicates the maintenance of the local uptrend, while the RSI is moving in the middle of the range, which makes it difficult to clearly determine the direction.

Daily BTC 4HChart - resistance and supportHello everyone, let's look at the BTC to USDT chart on a 4-hour time frame. As you can see, the price is moving above the local downtrend line.
Let's start with the support line and as you can see the first support in the near future is $23303, if the support is broken then the next support is $22829 and $22175.
Now let's move to the resistance line, as you can see the first resistance is $23698, if you manage to break it the next resistance will be $23993, $24287 and $24711.
Looking at the CHOP indicator, we see that most of the energy has been used, the MACD indicates a local uptrend, while the RSI is back to the upper part of the range.

Daily ETH 4HChart - resistance and supportHello everyone, let's look at the ETH to USDT chart on the 4-hour time frame. As you can see, the price is moving in a triangle marked with yellow lines.
Let's start with the support line and as you can see the first support on which the price is currently based is $1602, if the support is broken then the next support is $1569, $1562 and $1422.
Now let's move on to the resistance line, as you can see the first resistance is $1614, if you manage to break it, the next resistance will be $1639, $1659 and $1679.
Looking at the CHOP indicator, we see that there is some energy left for a new move, the MACD indicates a local downtrend, while the rsi is moving at the lower end of the range, which gives room for new increases.

Result of Previous Idea | 140pips GBPUSD | What's Next?Welcome back traders. Here's the result of our previous idea. It was published on February 21 and target reached on February 24.. some 140pips..
Explaining the trade generally:
•Open your chart on GBPUSD Daily frame and mark the exact FVG I marked above and in previous idea..
•Look at the bodies of candles after reaching the FVG.. Ignore the tails of candles that tried to trick traders in longs.
•Open H1 chart and mark the first FVG you see after reaching Daily FVG..(22Feb, 03:00)
•What time is London Open Killzone?
•Do you see how many FVGs we got on H1 and lower time frames(15m,5m,3m,1m)?
•See the opportunities that price offered in active market times (Killzones)..
Want more? Show your Likes👍
Something not clear? Tell me in comments ✍️

EURJPYThis is just An IDEA .
In EURJPY DAILY Timeframe have ABCD BEARISH Pattern GREEN LINES are Targets for TP.
WAIT until close RED candle.
HAVE GREAT DAY .

DOJI CANDLE ON THE $AAPL DAILY CHARTYesterday's choppiness & market direction indecision in the tech sector can be summarized by this DOJI candle on the APPLE daily chart formed off the 200 day MA and closed just above the 21 EMA. Possible reversal to retest and break $150: LONG. Level of support of 146.75 area, break below: SHORT

AUD.NZD rising wedgeHello Traders,
AUD.NZD daily seems to be forming a rising wedge.
Usually when there's a rising wedge, price seems to break to the downside.
I'm definitely watching this pair to see where price will break!
What do you think about this chart? Do you think it will break to the downside? thoughts?
Have a great day!
Samantha

Daily ETH 4HChart - resistance and supportHello everyone, let's look at the ETH to USDT chart on the 4-hour time frame. As you can see, the price is moving above the local uptrend line.
Let's start with the support line and as you can see the first support in the near future is $1636, if the support is broken then the next support is $1603, $1569 and $1522.
Now let's go from the resistance line, as you can see in the first place we have a strong resistance zone from $1673 to $1718, if we manage to break it, the next resistance will be $1743.
Looking at the CHOP indicator, we see that we have a lot of energy for further movement, the MACD remains in a downward trend, while the RSI shows a visible rebound.

USDJPY ABCD BEARISH PATTERNThis is just An IDEA .
In USDJPY DAILY Timeframe have ABCD BEARISH Pattern Blue Rectangle and Blue line are ZONE, Accepted after saw a RED candle below of Blue rectangle, GREEN LINES are Targets for TP.
Have GREAT DAYS IN week.

EU made a retracement Friday. Looking for Bullish movement!After Top- Down analysis i'm looking for EU to move to the upside.
This is not trading advice or a signal!
The Website should not be relied upon as a substitute for extensive independent market research before making your actual trading decisions.

Retracement of BTC and future movement looking at the 1D chartAs the MACD is showing us we came across a "cross of death" also known as the position when sellers overpower the buyers. As we take a look at the market on the daily chart we can see that BTC is retracing probably retesting the local support which is situated at 21.5k in the following month we will get a new oportunity to buy the current dip and stack on the most reliable assets. My prediction is that after a retrace and retest of the support we will see another bull run that will last until mid march or the beggining of april where we are tarketing the 25k mark.

Daily review of BTC interval 1HHello everyone, let's look at the BTC to USDT chart on a 1-hour time frame. As you can see, the price is moving below the local downtrend line.
Let's start with the support line and as you can see the first support in the near future is $22772, if the support is broken then the next support is $22535 and $22335.
Now let's move to the resistance line, as you can see the first resistance is $23042, if you manage to break it the next resistance will be $23298, $23498 and $23708.
Looking at the CHOP indicator, we see that there is more and more energy for the next move, MACD indicates a local uptrend, RSI moves in an uptrend.
We can also see that the EMA Cross 10 is approaching a cross from the bottom of the EMA Cross 30, which would confirm the entry into a local uptrend.

Silver nearing 2nd inv h&s target & goldencrossSilver hit the first inv h&s breakout target (not shown here) back on november 13th and is now about to hit the second one (dotted yellow line). I will post a link to the previous silver chart idea so you can see how that purple inverse head and shoulder pattern played out. *not financial advice*

TMUS Earnings WeekOn Wednesday, TMUS reports its quarterly earnings. The last earnings report saw a gap on the surprise earnings, but overall the price did not do much. TMUS's price has remained rangebound between the high and low of the previous earnings week. Looking at the earnings estimate, analysts are predicting an increase in earnings from the prior quarter and the same quarter last year, which could provide the catalyst needed to break out of this range.
TMUS managed to post steady gains over 2022 when the SP500 and the Communications Sector (XLC), the sector in which TMUS is a member, declined. This upward progress shows underlying fundamental strength. The price action leveling off this last quarter could mean a few different things. The response to this earnings report could show it was just price action taking a breath.
Stepping back from the TMUS chart, the SPY marked a significant milestone last week by closing above its resistance line that formed during 2022. We also see that XLC is one of the top-performing sectors YTD.
A surprise on earnings coupled with a break of the previous earnings week high could mark the beginning of a new strong uptrend for TMUS.
