EURAUD Intraday Buy from DemandWelcome back! Let me know your thoughts in the comments!
**EURAUD Analysis - Listen to video!
We recommend that you keep this pair on your watchlist and enter when the entry criteria of your strategy is met.
Please support this idea with a LIKE and COMMENT if you find it useful and Click "Follow" on our profile if you'd like these trade ideas delivered straight to your email in the future.
Thanks for your continued support!
Brian & Kenya Horton, BK Forex Academy
Dailychart

APOLLOHOSPITAL HAS GIVEN A BREAKOUT Apollo hospital has given a very strong breakout, the setup is also looks very good. In this trade 1:1,2 Risk Reward easily achievable.

TATA CONSUMER GOOD TARGETSTata Consumer has come out from a zone with very good volumes, from CMP entry can be taken for good targets.

Watching AUD.USDHello Traders.
Anyone else watching the AUD.USD Daily chart?
I'm waiting to see if the price will continue to the downside or break to the upside.
This could be a good trade idea; however, we need to wait and see what price does.
Let me know what you think, what do you think the price will do?
Happy Trading
Samantha

EURUSD DailyCan I just say WOW at the rejection at the 200MA ?!? Honestly this is playing out how I would like to see the market.
I recognize a price action candle, the shooting star. The shooting star often occurs when the market is buying and begins to react at some level of resistance. I am identifying my level of resistance as the 200MA.
I would like to see todays candle (11/16) to close as an engulfed candle. ONLY IF todays candle close with momentum, the market is likely to continue to sell…
But as of right now, I am going to sit on my hands and continue to watch the market form.

AUDNZD I Here's what to expect next week!
Welcome back! Let me know your thoughts in the comments!
**AUDNZD - Listen to video!
We recommend that you keep this pair on your watchlist and enter when the entry criteria of your strategy is met.
Please support this idea with a LIKE and COMMENT if you find it useful and Click "Follow" on our profile if you'd like these trade ideas delivered straight to your email in the future.
Thanks for your continued support!
Brian & Kenya Horton, BK Forex Academy

PRAJIND HAS GIVEN A NICE BREAKOUTPRAJIND has given a nice breakout, here we can take a trade. The stock looks very bullish.

NASDAQ Hit ResistanceAfter extremely negative week for USD we have witnessed a spike of more than 1000 points for Nasdaq. Right now the asset reached the resistance and is ready to fall. We go with risk reward 1:3

AUDUSD It will correct downward SHORT!Welcome back! Let me know your thoughts in the comments!
**AUDUSD - Listen to video!
We recommend that you keep this pair on your watchlist and enter when the entry criteria of your strategy is met.
Please support this idea with a LIKE and COMMENT if you find it useful and Click "Follow" on our profile if you'd like these trade ideas delivered straight to your email in the future.
Thanks for your continued support!
Brian & Kenya Horton, BK Forex Academy

TCS IMPORTANT LEVELSTCS has made double bottom and making higher high and higher low formation hereafter we can plan for swing trades and investment.

Daily review of BTC interval 4HHello everyone, let's look at the BTC to USDT chart on a 4-hour timeframe. As you can see, the price has left the triangle sideways and is currently just above the local uptrend line.
Let's start with the support line and as you can see the first support in the near future is $16727, if the support is broken then the next support is $16451, $16234 and $16015.
Now let's move on to the resistance line, as you can see the first resistance the price is currently fighting is $16967, if you manage to break it the next resistance will be $17352, $17649 and $17964.
Looking at the CHOP indicator, we see that in the 4-hour interval we have a lot of energy for the next move, while the MACD indicator indicates that the blue line is above the red one, which confirms the maintenance of the local uptrend.

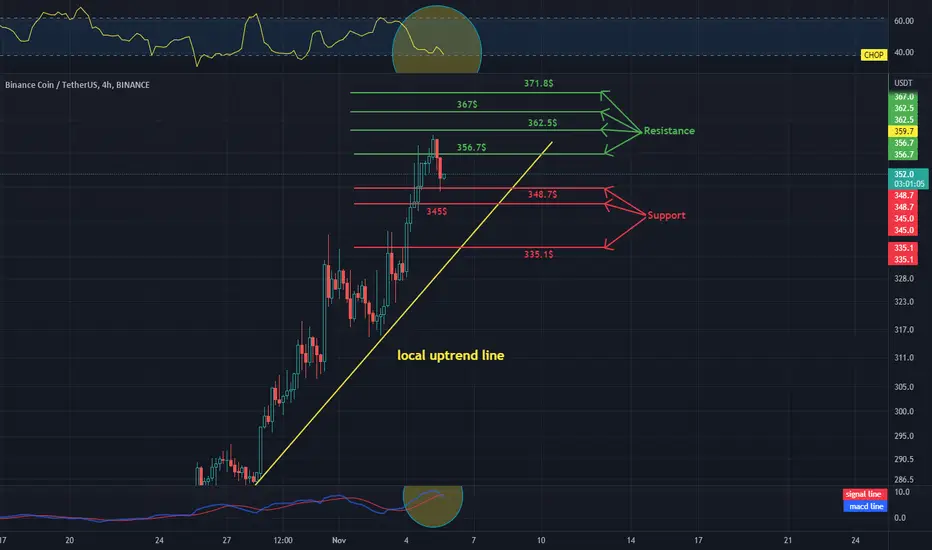
Daily review of BNB interval 4H - Resistance and SupportHello everyone, let's take a look at the BNB to USDT chart over the four hour timeframe. As you can see, the price is moving above the local uptrend line.
Let's start with the line of support, and as you can see, the first support is three hundred and forty-eight dollars and seventy cents, the second support is three hundred and forty-five dollars, and the third support is three hundred and thirty-five dollars and ten cents.
Now let's move to the line of resistance, as you can see, the first resistance is three hundred and fifty-six dollars and seventy cents, the second resistance is at three hundred and sixty-two dollars fifty cents, the third is three hundred and sixty-seven dollars, and the fourth is three hundred and seventy-one dollars and eighty cents.
Looking at the CHOP indicator, we can see that the energy has been used up in the four-hour interval, and the makdi indicator shows a local downward trend.
supply and demand on Ethereum daily timeframe suggests a short
etheream is strongly heading up to a major key level on ETHUSD daily chart aggressive swing trading options are available if entries put on major and stop limits on upper level of the previous head and shoulders supply level
the entry will come after a final bullish push towards the supply level
indicators line ups
-stochastic rsi has been overbought for quite some time and is due to reverse
-upper donchian band leveling off at key level
- weak bullish alligator in a macro bear market
suggested entry during the next couple of days expect this to exit on a strong bullish reverse to the upside to double dip with the swing trade

DXY very bullish ! growth can continue up to 120The Fed had on Wednesday had hiked the upper target for fed funds to 4.0%, its highest since the Great Financial Crisis, while Chair Jerome Powell had said that interest rates will have to go higher than previously thought, even if the size of individual hikes from now on is likely to be smaller than the 75 basis points seen at the last four meetings. If we can break through the previous high, the growth will continue very strongly.

Gold reached Gold reached the resistance and I'm ready for another downtrend. Targets 1631 / 1615 with risk reward 1:3
The reason for that is my analysis of the US Dollar Index which reached the first target and went back to the support. We have a couple of US events later today on the calendar, be ready!

USD pairs testing key daily and weekly areas...USD pairs testing key daily and weekly areas... Some of which are shared in my charts above...
We could see some USD buying...
If the areas break, then perhaps a longer-term USD retrace move
I have been short USDJPY since 1.4930, so hoping for a break lower

If tezos can flip the 50dma 2 support the invh&s should validateNeed to flip this orange 50 daily moving average to solid support and then we can validate the inverse head and shoulder breakout and head to this target. *not financial advice*

AB CAPITAL HAS GIVEN A GOOD BO OF A SMALL PATTERN.ABCAPITAL has given a BO of a pattern here by taking a small SL we can achieve 1:1, 1:2 RR

GBPCAD Short from Resistance to 1.538 Zone Welcome back! Let me know your thoughts in the comments!
**GBPCAD - Listen to video!
We recommend that you keep this pair on your watchlist and enter when the entry criteria of your strategy is met.
Please support this idea with a LIKE and COMMENT if you find it useful and Click "Follow" on our profile if you'd like these trade ideas delivered straight to your email in the future.
Thanks for your continued support!
Brian & Kenya Horton, BK Forex Academy

EURCHF Short from Resistance 80 pip potential gainWelcome back! Let me know your thoughts in the comments!
**EURCHF - Listen to video!
We recommend that you keep this pair on your watchlist and enter when the entry criteria of your strategy is met.
Please support this idea with a LIKE and COMMENT if you find it useful and Click "Follow" on our profile if you'd like these trade ideas delivered straight to your email in the future.
Thanks for your continued support!
Brian & Kenya Horton, BK Forex Academy

HDFC BANK Looks good for SWING 10%HDFC BANK is sitting on (W)trendline and also trading in a parallel channel, between this zone we make trade plan and we can capture 10%.

#ATULAUTO CMP - 279.25 | Entry levels 265-70 | Breakout with good volume on daily chart | New 52 week high
Tracking for short term
*Not recommendation

WIPRO BD -10%It is a down trending stock, Today it has been given a BD, it may retest and fall further down.
You can find a short opportunity here.
