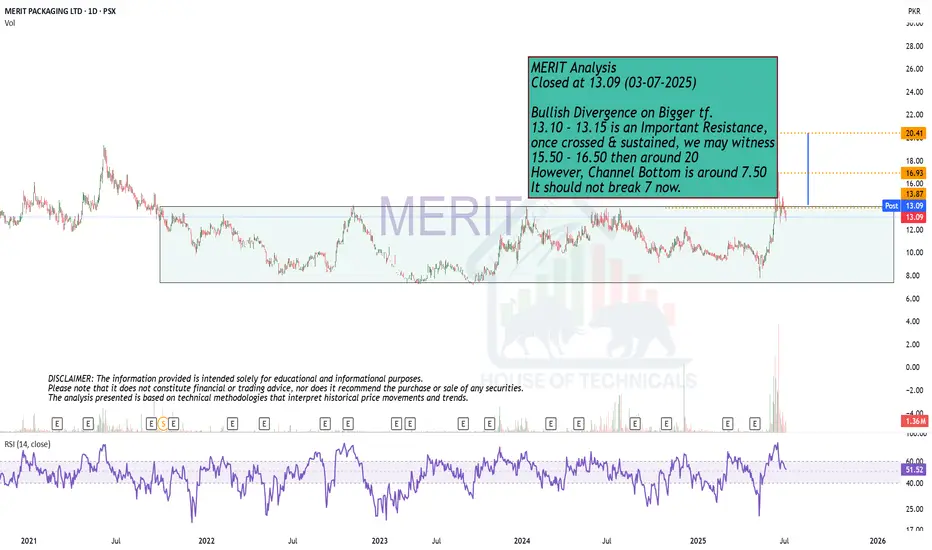
Bullish Divergence on Bigger tf.MERIT Analysis
Closed at 13.09 (03-07-2025)
Bullish Divergence on Bigger tf.
13.10 - 13.15 is an Important Resistance,
once crossed & sustained, we may witness
15.50 - 16.50 then around 20
However, Channel Bottom is around 7.50
It should not break 7 now.
Dailychart
EURUSD Approaching Liquidity Shelf — Watch for Reaction at 1.164EURUSD remains firmly bullish on all major timeframes, respecting the internal structure of an ascending channel.
• Daily: Price continues to respect both the red trendline and broader purple bullish channel. Buyers are defending the mid-line and pushing toward the upper boundary.
• 4H: Clear higher highs and higher lows. Price recently revisited and bounced off a 4H demand zone (1.14750–1.15000), and is now testing the liquidity zone at 1.16400.
• 1H: Microstructure shows consolidation and possible absorption of liquidity just beneath the 1.16415 high. A clean break and retest of this level may confirm continuation.
Key Levels:
• Resistance: 1.16415 (previous high and liquidity trap)
• Support: 1.14900 (4H demand zone)
• Daily trendline holding as dynamic support
Trade Plan:
• Longs: Await a break and retest of 1.16415 or a retracement to 1.15600 for a more discounted entry.
• Shorts: Not favored unless a strong bearish engulfing forms below 1.1600 with structure shift on the 1H.

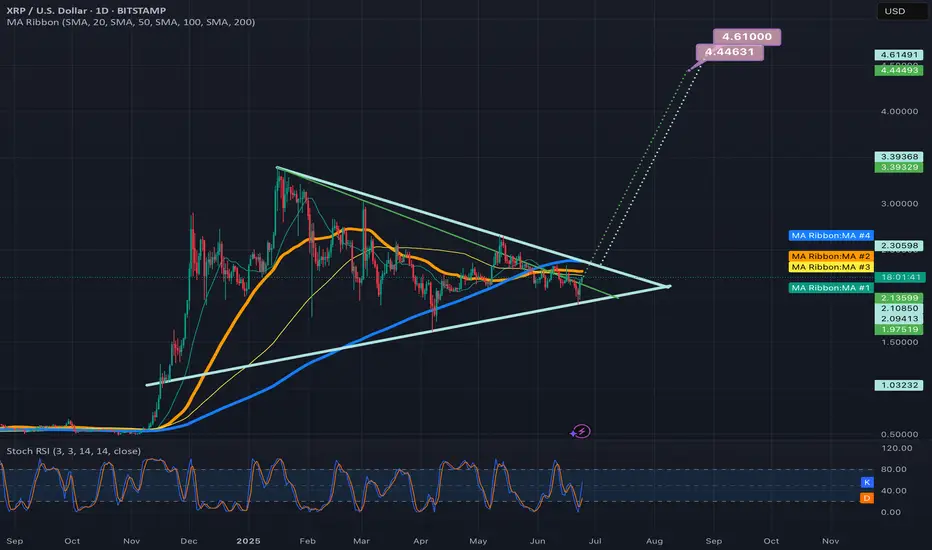
2 potential breakout targets for the symmetrical triangle on xrpDepends on if the green trendline is the more valid top trendline or the light blue one is. *not financial advice*
Positive market: OIL rises sharply - Important area to watch forThe recent escalation of tensions in the Middle East has had a strong ripple effect across all commodities market. Just as we observed with Gold, it’s no surprise we’ve seen oil prices climb as well, given this uncertainty.
If you’ve seen my latest Gold analysis, you’ll understand how market sentiment has turned uneasy, and in times like these are what people trust when everything else feels risky. And naturally, with everything going on, Gold is seeing stronger demand again, and I expect the price to steadily climb and reach new highs because the momentum is unmistakable.
On Friday the 13th, oil prices spiked abruptly before pulling back slightly, showing just how sensitive the market is to potential supply disruptions. What’s fueling this rally is obvious, and it’s the fear around supply from such an important oil-producing area. This creates a great opportunity to take a position.
As you can see in my analysis, the price has recently broken above a key resistance zone and may come back for a retest. If this level holds as support, it would really confirm the bullish bias and make the move towards my anticipated target of 77,50 high probability, towards the next resistance zone level at 77,50 and 79,50.
If the price remains over this support zone, my bullish outlook stays the same. But, if it doesn’t hold above this level we could see a slight pullback before another definitve move up.
In such times, it’s important to watch price action closely especially near key technical levels, and let the market show your next move.

GOLD's rise has been steady, decisive move aheadGold is the focus, plain and simple. We’re in an ascending channel, and price is respecting that structure with precision, higher highs, and no major signs of exhaustion yet.
Recently a clear resistance level was just taken out, and now I am watching for the classic retest. That breakout? A big deal, and a strong clue as well. If that zone holds as support, that’s a green light for a potential upmove toward 3,460 which matches the top of the channel.
But if it fails, we could expect a slight pullback, it might mean we could be in for a healthy dip before the next move.
Bottom line: follow the structure, and don’t force trades here without confirmation first

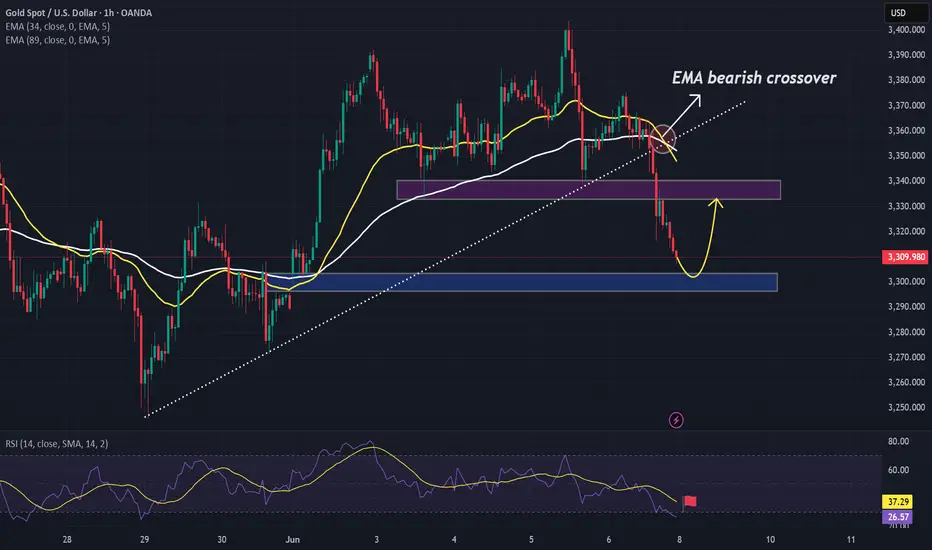
XAUUSD analysis - potential for pullback and continuationOANDA:XAUUSD is currently consolidating near $3,310 after a decisive breakdown below the ascending trendline, signaling a shift in the short-term structure from bullish to bearish. This breakdown was accompanied by strong bearish momentum, indicating that buyers have temporarily lost control of the market.
After the initial drop, the price is now attempting to retrace toward the 0.5–0.618 Fibonacci zone, with the 0.618 level located around $3,335. This zone also coincides with dynamic resistance from short-term moving averages (EMA cluster), making it an important confluence area. A rejection from this level would confirm a bearish retest, supporting the idea of a continuation toward the 1.618 Fibonacci extension near the $3,225 level.
However, if the price breaks and holds above $3,348, the bearish scenario will be invalidated, potentially signaling that buyers are regaining strength and may aim to reclaim higher resistance levels.
Traders are advised to wait for confirmation, such as a bearish engulfing candle, rejection wicks, or a surge in volume, before entering short positions. As always, this is a personal viewpoint, not financial advice. Trade with appropriate risk management.

BTCUSDT – Bearish signs emerge below resistanceAfter a strong bullish run, BTCUSDT is now showing clear signs of weakness near the resistance zone around 109,600–112,000. Price action has formed a cluster of rejection candles at the top, failing to break above this key level – signaling that selling pressure is gaining control.
The current structure suggests a potential trend reversal, especially as the latest bearish candle came with rising volume, confirming selling interest from the supply zone. If the price breaks below the 101,500 support, BTC may continue dropping toward the 93,500–84,500 range – a high-liquidity area on the volume profile.
The previous bullish momentum appears to have lost strength, and this pullback may be confirming a shift after reaching its upper limit. As long as BTC remains below the 112,000 resistance, the bearish bias remains dominant.

Will gold continue its uptrend from the 3,300 USD level?Hello dear traders!
Gold prices continued to decline against the US Dollar (USD) on Friday, falling below the previous psychological support level, which is now resistance, at 3,350 USD. The main reason was that the US Dollar gained some positive momentum as the market leaned toward the Fed maintaining its current policy in July following the May report, causing XAUUSD to move lower into the weekend.
From a technical perspective, as previously analyzed, gold broke below the psychological support level of 3,350 USD on Friday, with prices approaching the 3,300 USD support level at the time of writing. However, the RSI has dropped to the 30 level, indicating that selling pressure may be losing momentum, and global economic stress could potentially limit further losses.
$TOTAL Crypto Market Cap Meltdown As suspected, a head and shoulders pattern has formed on the CRYPTOCAP:TOTAL Crypto Market Cap.
We could see a big relief rally with the golden cross happening today, but i expect the market to sell off to 2.85T before seeing any real signs of reversal.
RSI also shows more downside ahead on the Daily.

GOLD conditions seem to remain bearish: Pay attention to hintsFor now, we can see that Gold’s bullish momentum has stalled and since Friday Gold has been under pressure from 3325. Not surprisingly though, the market structure performed as expected this past week.
I believe that short-term price action in gold may remain choppy next week due to Trump’s temporary tariff measures so caution is advised.
My bias is still the same as before, I think that on Monday the market will open bearish likely pushing price lower initially.
As you can see in my previous analysis, the forecasted move played as expected:
So this being said I plan to react based on how price behaves at support of 3270-3250 on the lower side in the short term.
If price tags the support as shown on my chart, I’ll be watching for a possible rebound toward 3300. This range in particular should not be overlooked . This area aligns with the point of control, and given how price often gravitates back to high-volume zones after sharp moves, a recovery to that level would be a natural reaction.
The key point lies in how the market will open and how price will behave, as well as the overall sentiment.
Gold's next move won’t be random, there are strong confluences at play that will guide and give us hints, so it’s up to us to stay attentive.
If we were to break upside above the $3,330 level, then we can see more bullish outlook next
The other scenario, to be taking into account would be to start with a strong bullish candle and reach 3330 before a drop.
Wishing you a profitable trading weekend ahead. This is just a forecast and should not be considered financial advice.

ANGEL ONE - Potential Cup Pattern Breakout!Timeframe: Daily (1D)
Pattern: Cup Formation (shown with arc)
Setup:
Price is forming a classic cup pattern.
The neckline (arc resistance) is near 2538.40.
Price has recently approached but faced resistance around the neckline.
Once the price breaks above the arc line with strong volume, a bullish breakout could be confirmed!
Targets After Breakout:
🎯 Target 1: 2800
🎯 Target 2: 3000
Stop-loss suggestion: As per your risk management.
Notes:
Price is currently below the 200 EMA. For a strong confirmation, look for a close above the arc and the 200 EMA with volume spike.
Disclaimer
This analysis is for educational and informational purposes only. It does not constitute financial advice or a recommendation to buy or sell any securities. Always do your own research and consult with a qualified financial advisor before making any investment decisions. Trading involves substantial risk.

Once Crvusd confirms the invh&s breakout the target is .8737Currently firmly above the neckline of this inverse head and shoulders pattern. Could definitely still find a way back below the neckline but if it does return to the neckline and maintain it as support that is a solid place to go long or add to a position for my own personal strategy. *not financial advice*

Beautiful SetupClosed at 141.02 (21-02-2025)
Beautiful Bullish Divergence +
Inverse H&S in progress.
As mentioned earlier, 144 - 146 is
an immediate resistance; once crossed
& sustained, we may witness 152 - 155
& then 175 - 180.

Indexes Daily "Slow" Trend anticipationExpecting a Daily slowliness a.k.a. HRLR (ICT Concepts) due to the Bonds decorrelation which is bearish. Once Bonds has reached Sell Side Liquidity Target, acceleration will be seen on Indexes higher. Meanwhile "give and take" is expected on a Daily and 4h basis.

Sui broke above the wedge & is already over halfway 2 the targetSUUSD has had a very notable pump on this uptrend which hopefully will end up being the beginning of confirming a real sustained uptrend in the alt market. *not financial advice*

NZDJPY LONGHey everyone we looking for a long NZDJPY, we were having a uptrend for an quiet a while so this is what i see and why i will taking a buy
1) break and retest to daily support and reject few times
2) reject from a 50% Fib level
3) break our counter trend line on 4h which shows us buyer is taking over
4) shift from bearish to bullish market after break of structure on1h
5) reject Daily and 4h 50 EMA
6) engulfing bullish on 4h
Im aiming 1:2 risk to reward Ratio

BNB/USDT 1D chart Hello everyone, let's look at the 1D BNB chart to USDT, in this situation we can see how the price moves in a triangle where there is still space to keep the currently ongoing side trend. Going further, let's check the places of potential target for the price:
T1 = $ 599
T2 = $ 617
Т3 = $ 644
Let's go to Stop-Loss now in case of further declines on the market:
SL1 = $ 580
SL2 = $ 559
SL3 = $ 542
SL4 = 521 $
Looking at the MacD indicator, you can see an attempt to return to the upward trend, but here we do not have clear confirmation, which is why it is worth being careful.

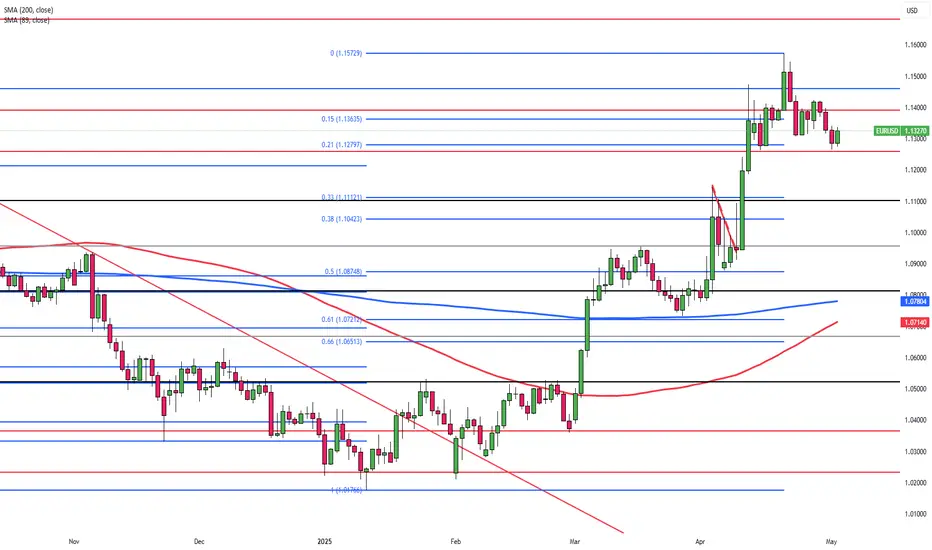
Euro Slips to $1.13 After Strong AprilThe euro dipped toward $1.13 on May 1 after a 5% April gain, as the dollar found support in Trump’s optimism about trade deals with India, Japan, South Korea, and China. Markets awaited Friday’s U.S. jobs data for Fed policy clues. The U.S. economy shrank 0.3% in Q1, partly due to import spikes ahead of expected tariffs. Meanwhile, the Eurozone grew 0.4%, driven by strong domestic demand. German inflation eased to 2.1%, though core rose slightly, while France’s annual rate held at 0.8%.
Resistance levels are seen at 1.1460, then 1.1580 and 1.1680, while support rests at 1.1260, followed by 1.1200 and 1.1150.
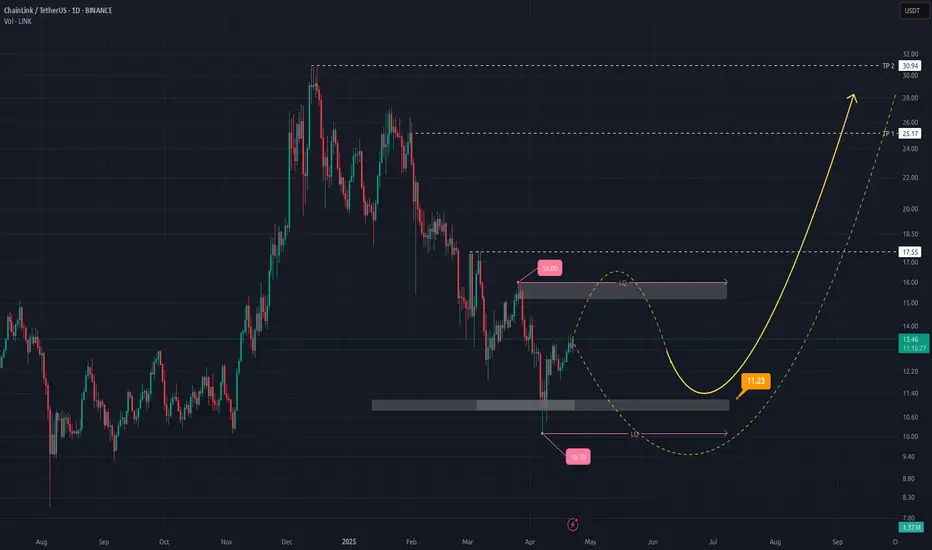
ChainLink (LINK/USD): A Bullish Breakout on the Horizon?Hey there, traders! Let’s take a closer look at ChainLink (LINK/USD) on the daily chart. There’s some interesting action that might point to a bullish move, but let’s break it down with a bit of caution to see if the stars are truly aligning.
Price Action
After a consistent downtrend, we’re seeing a potential shift at $11.23. There’s a bullish reversal candle showing up here, which could suggest buyers are stepping in at this key support level. It looks promising, but we’ll need more confirmation to be sure this is a real trend change.
Volume
The volume at this reversal point is picking up, which is a good sign—those bars are taller than the recent average. This might mean stronger buying interest, but it’s not a massive spike, so I’d keep an eye on whether this volume trend continues to support the move.
Pattern
Looking at the bigger picture, it seems like a cup-and-handle pattern could be forming. The price has rounded out (the “cup”) and is now consolidating (the “handle”). If LINK can break above the $16.00 resistance, we might see a bullish breakout—but this pattern isn’t fully confirmed yet, so let’s stay alert.
Potential Targets
If we do get that breakout, here’s what we might aim for:
TP1: $24.17 – A possible first target.
TP2: $30.04 – Could happen if momentum builds.
TP3: $32.00 – A stretch goal, but only if the bulls really take charge.
Key Support
The $11.23 support is our critical level to watch. If the price drops below this, the bullish setup could be in trouble, so let’s not get too ahead of ourselves.
Wrap-Up
We’ve got a reversal candle, some increased volume, and what might be a cup-and-handle pattern forming, so LINK could be setting up for a bullish move. But it’s not a done deal yet—breaking above $16.00 will be the real test. If you’re thinking of jumping in, set a stop-loss below $11.23 and manage your risk carefully. What do you think—could this be the start of something big? Let’s watch and see! Happy trading! 🚀
US DOLLAR at Key Support: Will Price Rebound to 103.000TVC:DXY is currently approaching an important support zone, an area where the price has previously shown bullish reactions. This level aligns closely with the psychological $100 , which tends to have strong market attention.
The recent momentum suggests that buyers could step in and drive the price higher. A bullish confirmation, such as a strong rejection pattern, bullish engulfing candles, or long lower wicks, would increase the probability of a bounce from this level. If I'm right and buyers regain control, the price could move toward the 103.00 level.
However, a breakout below this support would invalidate the bullish outlook, potentially leading to more even more downside.
This is not financial advice!

1day chart fallingwedge/bullish pennant on bitcoinI just posted a weekly version of this same pennant in the previous idea which I will link below, i wanted to also post the version of it on the 1day timeframe as well because the top trendline of the wedge on the 1day time frame has a different trajectory which lengthens the wedge considerably. With this longer wedge we can see that if it is the more valid for the 2 versions, that we probably wouldn’t be expecting a breakout until June at the earliest. Not quite sure yet which version of this wedge is ore valid so I’m posting both versions for now to keep and eye on them. For the weekly charts pattern to be the more valid of the 2, we will likely need to see the weekly 50ma continue to maintain support. *not financial advice*

FTM/USD 1D ChartHello everyone, let's look at the 1D FTM to USD chart, in this situation we can see how the price is moving in a descending triangle where we are approaching the moment of trying to choose the direction in which the price can go further.
Let's start by defining the targets for the near future that the price has to face:
T1 = 0.66 USD
T2 = 0.81 USD
Т3 = 0.93 USD
Now let's move on to the stop-loss in case the market continues to fall:
SL1 = 0.44 USD
SL2 = 0.31 USD
SL3 = 0.21 USD
If we look at the MACD indicator we can see a return to a local downtrend, however we are still in a place where the trend can reverse and surprise us with growth.

SOLANA at key support zone - Is $160 within reach?BINANCE:SOLUSDT has reached a major support level, an area where buyers have previously shown strong interest. This zone has acted as a key zone, increasing the likelihood of a bounce if buyers step in.
A bullish confirmation, such as a strong rejection pattern, bullish engulfing candles, or long lower wicks, would strengthen the case for a move higher. If buyers take control, the price could rally toward the $160 target. However, a decisive breakdown below this support would invalidate the bullish scenario and could lead to further downside.
This isn’t financial advice, just my take on how I approach support and resistance zones. Best to wait for clear confirmation, like a strong rejection or a volume spike, before making a move.
Every trader has a unique perspective. Let’s discuss this setup within the TradingView community!
