golden triangle since first rate cut gold price is sideways
price has made new symmetrical triangle pattern on daily chart
wait for breakout then trade in new direction
this week big news nfp then trump first day in white house can be trigger
Dailychart

Ada breaking up out of a Bull pennant.Target for the pennant hound be around $1.86 . I also noticed the.bitcoin dominance chart’s 200ma looks like its finally flipping back to resistance which if so will increase the probability of ADA hitting this pennant target as well as alt season finally officially starting. *not financial advice*

NLK Breakout Alert!A breakout pattern has formed on the 1-hour timeframe, targeting the GREEN zone as the projection of the pattern. Watch for potential opportunities! 🎯
📊 Stay tuned for updates and manage your risk wisely.

EUR/USD Downward Movement to Continue?The EUR/USD pair continues to show bearish potential on the daily timeframe.
While Friday's high could be taken as part of a retracement, the overall trend remains bearish.
There is a potential move toward the sell-side liquidity (SSL) below, aligning with unmitigated imbalance zones and market structure.
Watch for price reaction in and around the Daily FVG level and the Fibonacci retracement zones for a potential bearish setup on the lower timeframes.
Trade Safe ;)

GOLD TO $3000/OZ (after correction ofc)After my previous optimistic idea, here’s a scenario that seems much more likely! Now I can also see that gold needs a little break before it can head towards the $3000+ target price! I think the $2500 avg. price level is a very good entry point before the first wave of the fifth wave begins.

Bitcoin currently in an ascending bull flagI made a rough estimate of where the flag make breakout for where I placed the dotted measured move breakout target line. There’s a chance it could not hit the entire flag tRGET and instead only reach the breakout target of just the channel portion of the flag itself which would be a much lower target. Also always a possibility arising channel breaks to the downside though at the beginning of a parabolic phase during a bull market they usually break upwards. We will see what happens soon enough *not financial advice*

Propy resetting stochrsi just in time for golden crossYou can see here on the daily chart how propy hit the exact target of this 4hr chart inverse head and shoulders pattern of $1.93 and then instantly corrected and has now corrected enough to reset the daily stochrsi indicator just in time for its golden cross. Having price action be this close to the 50 and 200mas at the time of the cross is almost always a good sign that the cross will be sustained and validated as well. If so once price action climbs above the horizontal brown line and flips it to solidified support then the next target should be 2.76. That target then places us above the green trendline which will lead eventually to another breakout validation with an even bigger breakout target but we will focus more on that one once we get there. For now the focus is on breaking above the brown trendline and sustaining the golden cross. *not financial advice*

AUDUSD Daily AnalyseIt's my daily analyse for AUDUSD
FX:AUDUSD
You can enter to this position with SL and TP3 (Related to your risk)

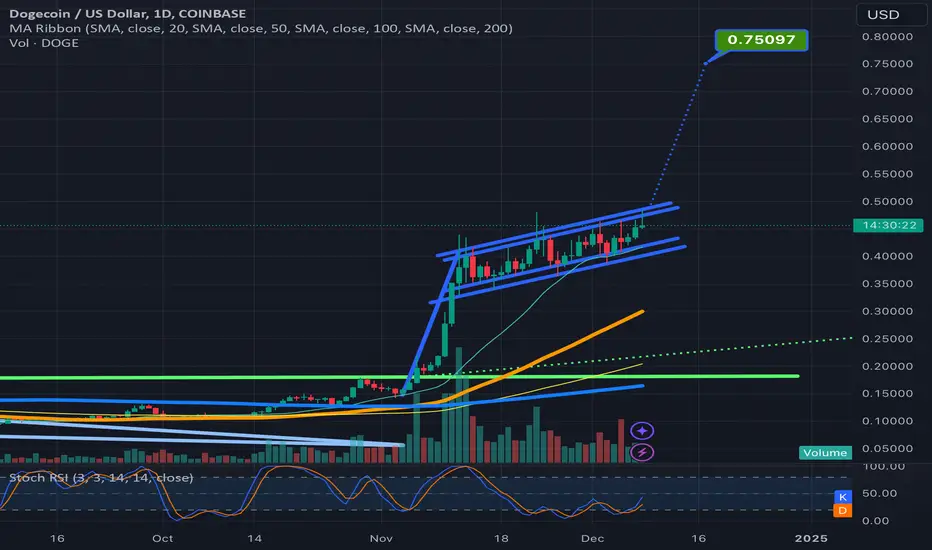
Doge can reach $.75 if it breaks upwards from ascending bullflagUsually an ascending channel like the one that is part of the bullflag on dogecoin’s 1 day chart beaks to the downside, except inside a parabolic phase of the bull market cycle. In the parabolic phase of a bull market cycle you can see several back to back rising wedges and ascending channels break to the upside so since we are really only 1-2 daily chart pattern breakouts into this current parabolic phase for the alt coin market, I think probability favors this ascending channel breaking upwards. If it does we also have the benefit of it being not only a channel but a bullflag as well and the target for such a breakout is around 75 cents. Furthermore if you flip to the weekly channel you would see that there is potential for the pole to be even longer than shown here on the daily timeframe, so I wouldn't be surprised if doge were able to overshoot the 75 cent target even. I noticed that the channel had valid trendlines on both the wicks and the candle bodies on both the bottom and top thats why the trendlines are doubled up, *not financial advice*
Bonk can pump 82% if it validated the bullflag bullish breakoutNo guarantee this pattern will break out, it could also extend the consolidation and morph into a completely different pattern, but at the moment it seems the best probability is a breakout upward considering we are only 1 big chart pattern breakout into the current long awaited altcoin market uptrend. *not financial advice* Please bonk responsibly.

Ankr’s breakout target from invh&s can bring 95% gains if soonAnkr is very close to completing its right shoulder on this fairly thicc inverse head and shoulders pattern it has formed. Hard to tell exactly when it will breach the neckline but one would assume that it’s probable for it to happen soon. *not financial advice*

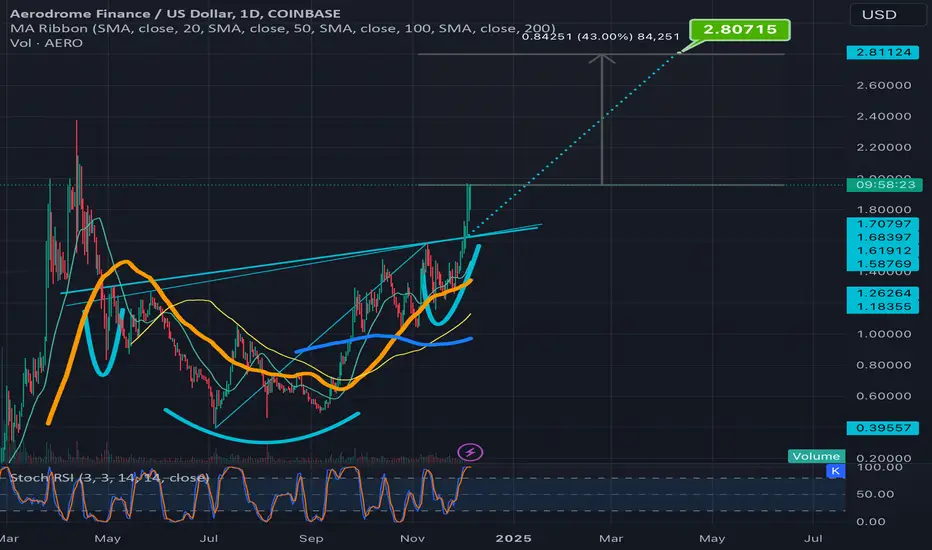
Aerousd breaking upwards from ascending inverse head & shouldersStill has about 41 percent of gains left to make between here and its full breakout targer. Will net a new all time high in the process. Not sure where it will go from there. could always overshoot or undershoot the target as well but most alts lately have been either hitting the target precisely or overshooting then. I like this particular unconventional inverse head and shoulders because it has 2 necklines both with the same breakout target. *not financial advice*
NEAR breaking up from invh&s and soon from symmetrical triangleIn order to reach the full inverse head and shoulder breakout target, NEAR will have to send price action well above the top trendline of this turquoise symmetrical triangle, in the process likely validating the breakout of that pattern too. *not financial advice*

Waves in a sleepy head inverse head & shoulders patternOnce price action wakes up the sleepy head pattern it can rise to $4.60 which is like a 10% gain from here if it were to hit the full breakout target. *not financial advice*

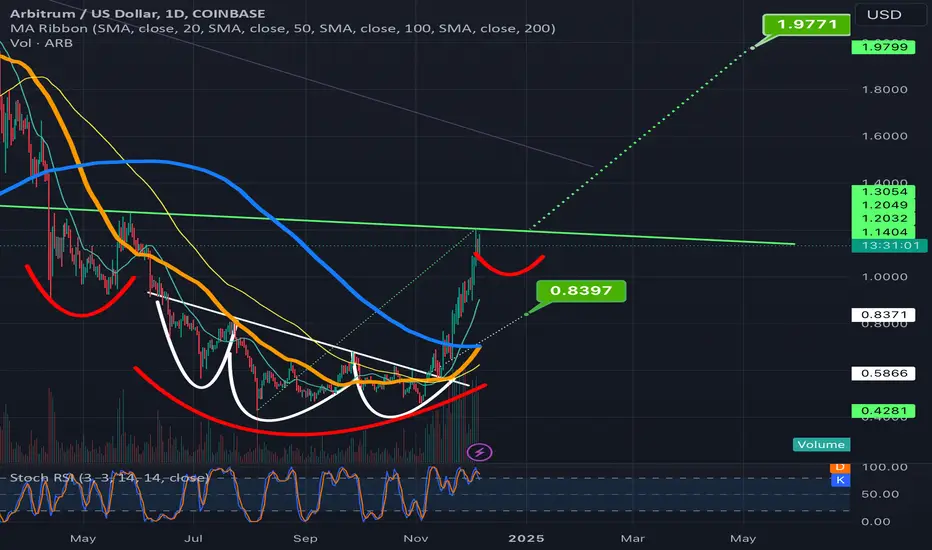
Arbitrum set to goldencross on next daily candle; invh&s in playWe can see after triggering the breakout of the smaller inverse head and shoulders and blowing past that target arbitrum has reached the perfect level that will cause this new inverse head and shoulders to materialize by correcting here and forming a right shoulder. We can also see that Arbitrum is just 1 day away from having it’s daily golden cross and considering many inverse head and boulder patterns in the altcoin market lately have been forming remarkably tiny right shoulders, Arbitrum also could follow suit and break up from the inverse head and shoulder neckline far sooner than you would normally ever expect these kind of patterns to do so. Also a chance it could form a normal shoulder here as well we wll know soon enough *not financial advice*
Dash filling out right shoulder after burj khaifa moveBy correcting here after dash’s big golden cross vertical slingshot in price action it is in the perfect zone to form a right shoulder to a newly materializing inverse head and shoulders pattern. The common theme for many inverse head and shoulders patterns this alt season has been very tiny right shoulders so there’s a decent chance it breaks above the neckline of the inverse head and shoulders before where the hypothetical right shoulder I have drawn on the chart reached it’s end. Always a chance it bucks the trend and ends up being even wider than what I drew too as the width of the shoulder would traditionally be. We will know soon enough As always dash and zcash see to be having some similar chart patterns. Nice to see privacy coins still matter enough to have a chance to make big gains this bull run and perhaps even surpass the previous all time highs if it keeps this up long enough *not financial advice*

Dash breaking up from double bottom on same day as goldencrossI’m starting to think my hypothesis has been proven at this point as yet another alt coin has its massive breakout pump on the exact same day pill candle it has its golden cross on. Dash now joins the countless other alt coins who have also broken up from the chart patterns with a big pum the day fo their golden cross. *not financial advice*

Zcash working on filling out right shoulder for next breakout Zcash appears to be forming a special inverse head and shoulders pattern I like to refer to as the sweet dreams or sleepy head inverse head and shoulders as the trendline you draw to highlight the head and shoulders take on a smile face with its eyelids closed. I anticipate even though I already drew the hypothetical length of the right shoulder fairly s that there’s a chance it could break above the neckline after forming an even shorter right shoulder based on some of the recent tiny right shoulders we’ve seen fro the likes of digibyte, atom, cardano and others. Always a chance since it’s left shoulder was tiny that the right one could buck the trend and form a regular sized right shoulder too, either way I’m confident with market conditions how they currently are theat probability favors this pattern breaking out and up eventually. *not financial advce*

Bullflag on bitcoin’s monthly log chart putting up big numbers 200k by May?! The measured move target is over 200k and the trajectory of the ensured move line suggests that it could even potentially reach this target in the first half of 2025. A very exciting notion let’s hope it can and will. I do expect one steep corrections on the way to this target. *not financial advice*

Storj can make 74% gains just by reaching this invh&s targetStorj looks very close to completing the right shoulder of this inverse head and shoulders pattern here. 74% gains off one pattern s nothing to sneeze at. *not financial advice*

Atomusd at the goldencross starting lineIn a very similar inverse head and shoulders that digibyte jsut successfully broke out of with the same kind of little right shoulder. For now there’s been no confirmation of a breakout or even solidified support on the neckline just yet so price could easily dip back below the neckline here, however considering the golden cross has occurred it wouldn’t surprise me if the neckline is confirmed solidified support n quick order. *not financial advce*

DAG looks to trigger c&h & double bottom after golden crossThis project known as Constellation with the ticker DAG has seen quite a bullish pulse lately with its golden cross, it now has et some resistance on both the double bottom neckline and the cup and handle rimline but I wouldn’t be surprised if it overcomes that resistance in the near future. *not financial advice*

If Link corrects long enough here a new inv h&s will be in playCurrently after yesterday’s fantastic green pump candle on Link, the new daily candle s currently red as link takes a quick breather. Now this could only last a very short time but if t lasts for a few daily candles, that will be enough to qualify the current correction as a right shoulder to what will then be this newly formed inverse head and shoulders pattern. If it starts pumping again on the current daily candle and goes above the neckline and keeps continuing up we can disregard this as of now strictly hypothetical & speculative inverse head and shoulders pattern, but while there’s still a chance I thought it would be fun to post this chart and draw a rather arbitrary curve for the length of a potential right shoulder. Link has already broken out of a Bull flag on the higher timeframe charts (which I will post a link of below) and that flag has a target of around $55 so odds are good whether this potential new inverse head and shoulders pattern comes to be valid or not that we will still end up hitting its breakout target of $47.18 on our way up to reach the $55 target of the macro bullflag, if we are lucky though link will correct and for a right shoulder here though and then I will be able to enter a position a little lower than this to get the opportunity for even higher percentage gains once it reaches the full target of both this pattern and the macro bull flag’s full target at $55. *not financial advice*
