XAU/USD 10 June 2025 Intraday AnalysisH4 Analysis:
-> Swing: Bullish.
-> Internal: Bullish.
Analysis and bias remains the same as analysis dated 23 April 2025
Price has now printed a bearish CHoCH according to my analysis yesterday.
Price is now trading within an established internal range.
Intraday Expectation:
Price to trade down to either discount of internal 50% EQ, or H4 demand zone before targeting weak internal high priced at 3,500.200.
Note:
The Federal Reserve’s sustained dovish stance, coupled with ongoing geopolitical uncertainties, is likely to prolong heightened volatility in the gold market. Given this elevated risk environment, traders should exercise caution and recalibrate risk management strategies to navigate potential price fluctuations effectively.
Additionally, gold pricing remains sensitive to broader macroeconomic developments, including policy decisions under President Trump. Shifts in geopolitical strategy and economic directives could further amplify uncertainty, contributing to market repricing dynamics.
H4 Chart:
M15 Analysis:
-> Swing: Bullish.
-> Internal: Bearish.
Analysis and bias remains the same as analysis dated 22 May 2025.
In my analysis from 12 May 2025, I noted that price had yet to target the weak internal high, including on the H4 timeframe. This aligns with the ongoing corrective bearish pullback across higher timeframes, so a bearish internal Break of Structure (iBOS) was a likely outcome.
As anticipated, price targeted strong internal low, confirming a bearish iBOS.
Price has remained within the internal range for an extended period and has yet to target the weak internal low. A contributing factor could be the bullish nature of the H4 timeframe's internal range, which has reacted from a discounted level at 50% of the internal equilibrium (EQ).
Intraday Expectation:
Technically price to continue bullish, react at either premium of internal 50% EQ or M15 demand zone before targeting weak internal low priced at 3,120.765.
Alternative scenario:
Price can be seen to be reacting at discount of 50% EQ on H4 timeframe, therefore, it is a viable alternative that price could potentially print a bullish iBOS on M15 timeframe.
Note:
Gold remains highly volatile amid the Federal Reserve's continued dovish stance and persistent geopolitical uncertainties. Traders should implement robust risk management strategies and remain vigilant, as price swings may become more pronounced in this elevated volatility environment.
Additionally, President Trump’s recent tariff announcements are expected to further amplify market turbulence, potentially triggering sharp price fluctuations and whipsaws.
M15 Chart:
Dailyforecast

GBPUSD DAILY ANALYSIS 14/02/25GBPUSD has been dancing around a key resistance zone of 1.25500, A daily bullish confirmation breakout has just occured, i see price buying strongly to the next level resistance of 1.28100.

EURNZD - Sell Setup at Clear Resistance ZoneEURNZD is currently trading in a clear resistance zone that has consistently acted as a barrier for bullish momentum. This area aligns with prior supply levels and could attract some seller interest.
If rejection patterns, such as bearish engulfing candles or long upper wicks, emerge, I anticipate a move toward 1.82800. However, a break above this zone could signal a potential shift in market sentiment.
This is not financial advice but rather how I approach support/resistance zones. Remember, always wait for confirmation before jumping in.
Please boost this post, every like and comment drives me to bring you more ideas! I’d love to hear your perspective about this setup in the comments.
Best of luck , TrendDiva

WHEAT at Key Resistance Zone - Sellers Ready to Step In?PEPPERSTONE:WHEAT is approaching a key resistance zone, an area that has previously triggered strong selling pressure, making it a key level to watch.
If rejection occurs—such as wicks, bearish engulfing patterns, or a shift in momentum—sellers could regain control, driving the price lower toward the 559.0 target. This aligns with a short-term pullback scenario within the broader market structure. However, a sustained breakout above this resistance would invalidate the bearish outlook, potentially opening the door for further upside.
This is not financial advice but rather how I approach support/resistance zones. Remember, always wait for confirmation, like a rejection candle or volume spike before jumping in.
Please boost this post, every like and comment drives me to bring you more ideas! I’d love to hear your perspective in the comments.
Best of luck , TrendDiva

STOXX50: Bullish Momentum in Play - Is 5,345 the Next Target?PEPPERSTONE:EUSTX50 remains within a well-defined ascending channel, with price currently bouncing off a key support area. This suggests a continuation of the broader uptrend, targeting the upper channel boundary.
A short-term pullback could offer a potential entry opportunity. If buyers step in and confirm strength through candlestick patterns like bullish engulfing or hammer formations, momentum could drive price higher toward the 5,345 level.
A breakdown below the channel's lower boundary, however, would invalidate the bullish outlook and signal a potential shift in market direction.

EURAUD at Resistance - Will Sellers Step In?OANDA:EURAUD is testing a strong resistance zone, an area where sellers have stepped in before. If price struggles to break through and we see bearish confirmation—such as rejection wicks, bearish engulfing candles, or decreasing buying volume—I anticipate a move toward 1.6600.
A clean rejection from this level could trigger selling momentum, leading to further downside. However, if buyers manage to break above 1.6800 with strong conviction, it could shift the bias bullish and invalidate the short setup.
This is not financial advice but rather how I approach support/resistance zones. Remember, always wait for confirmation, like a rejection candle or volume spike before jumping in.
Please boost this post, every like and comment drives me to bring you more ideas! I’d love to hear your perspective in the comments.
Best of luck , TrendDiva

AUDNZD – Potential Long from Key Support ZoneOANDA:AUDNZD is approaching a key demand zone, which has previously led to bullish reversals. The recent downward move brings price into this support area, signaling a potential opportunity for buyers to step in.
A bullish confirmation, such as a strong rejection pattern, bullish engulfing candle, or long lower wick, would support the likelihood of an upward move. If buyers regain control, the price could rally toward 1.10500.
This is not financial advice but rather how I approach support/resistance zones. Remember, always wait for confirmation, like a rejection candle or volume spike before jumping in.
Please boost this post, every like and comment drives me to bring you more ideas! I’d love to hear your perspective in the comments.
Best of luck , TrendDiva

NZDHUF – Potential Long from Key Support ZonePEPPERSTONE:NZDHUF has reached a key support level, which has historically acted as a strong demand zone, leading to bullish reversals. The recent decline into this area suggests a potential opportunity for buyers to regain control and push prices higher.
A bullish confirmation, such as a strong rejection pattern, bullish engulfing candle, or long lower wick, would strengthen the case for an upward move. If buyers step in, price could rally toward 222.600. This setup aligns with a short-term bullish outlook within the broader market structure.
This is not financial advice but rather how I approach support/resistance zones. Remember, always wait for confirmation, like a rejection candle or volume spike before jumping in.
Please boost this post, every like and comment drives me to bring you more ideas! I’d love to hear your perspective in the comments.
Best of luck , TrendDiva

EURUSD - Sell Setup After Key Support BreakOANDA:EURUSD has decisively broken below a key trendline, signaling an increase in bearish momentum. This breakdown suggests that sellers are gaining control, with the potential for further downside continuation.
In the near term, price may revisit the breakout level for a retest, where the previous support could now act as resistance. A failure to reclaim this level would reinforce bearish sentiment, increasing the likelihood of renewed selling pressure. If sellers maintain dominance, the price may head toward the 1.03120 level.
For confirmation of continued downside movement, traders should look for bearish technical signals, such as a rejection wick, a bearish engulfing candlestick, or increased selling volume. Conversely, a sustained move back above the resistance level could invalidate the bearish setup and shift the bias toward a potential bullish recovery.
This is not financial advice but rather how I approach support/resistance zones. Remember, always wait for confirmation before jumping in.
Please boost this post, every like and comment drives me to bring you more ideas! I’d love to hear your perspective in the comments.
Best of luck , TrendDiva

Platinum Approaching Key Resistance — Will It Drop to 1,010$?OANDA:XPTUSD is approaching a significant resistance zone, an area where sellers have previously stepped in to drive prices lower. This area has historically acted as a supply zone, making it a key level to watch for potential rejection.
If price struggles to break above and we see bearish confirmation—such as rejection wicks, a bearish engulfing candle, or weakening bullish momentum—I anticipate a pullback toward the $1,010 level. However, a strong breakout and hold above resistance could invalidate the bearish outlook, potentially opening the door for further upside.
This is not financial advice but rather how I approach support/resistance zones. Remember, always wait for confirmation, like a rejection candle or volume spike before jumping in.
Please boost this post, every like and comment drives me to bring you more ideas! I’d love to hear your perspective in the comments.
Best of luck , TrendDiva

Platinum Testing Key Resistance - Reversal Ahead?OANDA:XPTUSD has reached a major resistance zone, where sellers have previously taken control. The current rally has been strong, but this level could act as a turning point if buyers start losing momentum.
If we see bearish confirmation—such as rejection wicks, bearish engulfing candles, or a drop in volume—I anticipate a move toward $971.78 level. A clear rejection here could fuel selling momentum, leading to further downside. However, if price breaks and holds above the zone, the bullish trend could extend higher.
This is not financial advice but rather how I approach support/resistance zones. Remember, always wait for confirmation, like a rejection candle or volume spike before jumping in.
Please boost this post, every like and comment drives me to bring you more ideas! I’d love to hear your perspective in the comments.
Best of luck , TrendDiva

AUDJPY - Buy Opportunity at Key Support LevelOANDA:AUDJPY is approaching a significant support zone, where buyers have previously stepped in, leading to strong bullish reactions. The recent decline suggests a potential buying opportunity if the price shows signs of reversal.
A bullish confirmation, such as a strong rejection candle or a bounce from support, could indicate a move toward 97.240. However, a break below the support zone could invalidate this setup, signaling further downside.
This is not financial advice but rather how I approach support/resistance zones. Remember, always wait for confirmation, like a rejection candle or volume spike before jumping in.
Please boost this post, every like and comment drives me to bring you more ideas! I’d love to hear your perspective in the comments.
Best of luck , TrendDiva

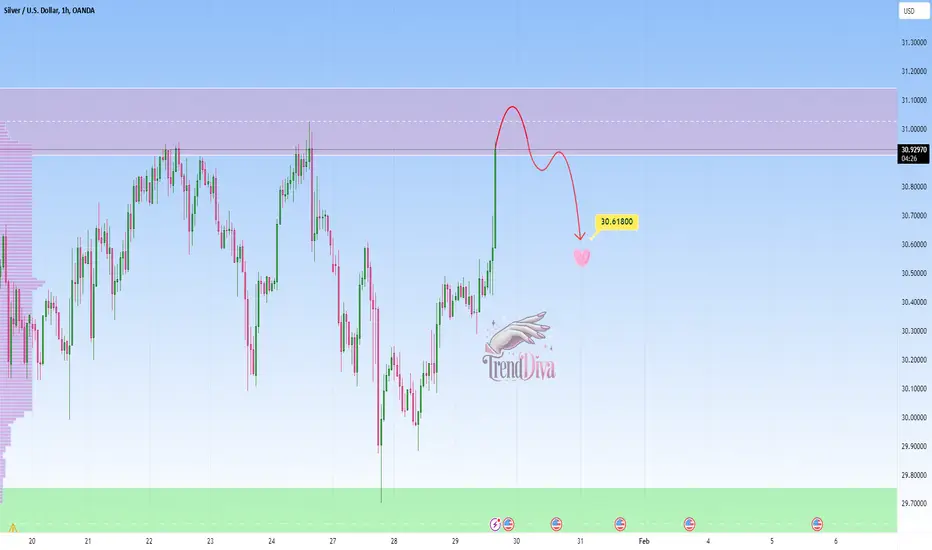
SILVER - Potential Short Setup at Key Resistance LevelOANDA:XAGUSD is currently testing a key resistance level, presenting a potential sell opportunity. If price fails to break above and holds below this resistance, a downward move towards 30.61800 could be expected.
A rejection at this level—confirmed by a bearish candlestick pattern or strong selling pressure—would strengthen the bearish outlook. Traders should watch for signs of failure to break resistance, which would support the short position. However, if the price breaks and closes above resistance, the bearish scenario would be invalidated, and the bias would shift to the upside.
This is not financial advice but rather how I approach support/resistance zones. Remember, always wait for confirmation, like a rejection candle or volume spike before jumping in.
Please boost this post, every like and comment drives me to bring you more ideas! I’d love to hear your perspective in the comments.
Best of luck , TrendDiva
ZARJPY - Potential Long from Key Support ZoneOANDA:ZARJPY is currently testing a significant support zone. The recent decline into this zone suggests a potential for buyers to regain control and push prices higher.
A bullish confirmation, such as a strong rejection pattern, bullish engulfing candles, or long lower wicks, would indicate an increased likelihood of a move upward. If this scenario unfolds, the price may head toward the 8.350 level.
This setup aligns with a potential short-term rebound within the broader market structure.
This is not financial advice but rather how I approach support/resistance zones. Remember, always wait for confirmation, like a rejection candle or volume spike before jumping in.
Please boost this post, every like and comment drives me to bring you more ideas! I’d love to hear your perspective in the comments.
Best of luck , TrendDiva

NZDSGD - Potential Long from Key Support ZoneOANDA:NZDSGD is approaching a key support level that has previously acted as a strong demand zone, leading to bullish momentum. The recent decline into this area suggests a potential opportunity for buyers to step in and push prices higher.
A bullish confirmation, such as a strong rejection pattern, bullish engulfing candle, or long lower wick, would increase the likelihood of an upward move. If buyers regain control, the price may head toward the 0.76630 level. This setup indicates a potential short-term rebound within the broader market structure
This is not financial advice but rather how I approach support/resistance zones. Remember, always wait for confirmation, like a rejection candle or volume spike before jumping in.
Please boost this post, every like and comment drives me to bring you more ideas! I’d love to hear your perspective in the comments.
Best of luck , TrendDiva

AUDUSD - Potential Bullish Continuation SetupOANDA:AUDUSD is currently trading within a well-defined ascending channel, reflecting a strong bullish market structure. The price is approaching a key support zone, which aligns with the lower boundary of the channel.
If the price holds at this support and buyers step in, a bullish continuation toward the 0.63380 level is likely, making it a reasonable target for an upward move.
Trade Considerations:
Wait for confirmation of buying pressure before entering a position.
Monitor for invalidation if the price breaks below the demand zone and the channel boundary, as this would signal potential downside momentum.
This is not financial advice but rather how I approach support/resistance zones. Remember, always wait for confirmation, like a rejection candle or volume spike before jumping in.
Please boost this post, every like and comment drives me to bring you more ideas! I’d love to hear your perspective in the comments.
Best of luck , TrendDiva

NZD/JPY Daily Setup The NZD/JPY currency pair is currently experiencing a healthy pullback following a significant decline of 1600 pips over the past 26 days. My key area of interest is around the 89.950 level due to several converging factors. These include a rejection point at 89.948, an ascending trendline originating from August 2023, the 0.786 level on the daily Bearish Fibonacci retracement, the psychological round number of 89.950, a descending trendline that started in March 2024, and the overall market structure.
Regarding the JPY Basket, it is also undergoing a pullback after advancing 38% over the last 25 days. I anticipate that the JPY Basket will react and potentially face rejection around the 6437 level.

DAILY FOREX MARKET WATCH: SILVER IS BULLISH!Silver is the market analyzed.
After respecting the W +FVG, a bullish BOS followed.
The D1 shows another +FVG was formed, a bullish indication.
I am looking for the D1 +FVG to be tested before price heads higher. It would be a great POI to
long from.
If you like the video, give a thumbs up and subscribe!
And thanks!
May profits be upon you.
Disclaimer:
I do not provide personal investment advice and I am not a qualified licensed investment advisor.
All information found here, including any ideas, opinions, views, predictions, forecasts, commentaries, suggestions, expressed or implied herein, are for informational, entertainment or educational purposes only and should not be construed as personal investment advice. While the information provided is believed to be accurate, it may include errors or inaccuracies.
I will not and cannot be held liable for any actions you take as a result of anything you read here.
Conduct your own due diligence, or consult a licensed financial advisor or broker before making any and all investment decisions. Any investments, trades, speculations, or decisions made on the basis of any information found on this channel, expressed or implied herein, are committed at your own risk, financial or otherwise.

Daily Market Watch: GOLD is BEARISH!The bearish bias going into this week was correct.
The market printed a bearish candle for the day, on the way to completing an IRL to ERL
movement.
I'm holding the same bias for tomorrow, as we near the first SSL target at the most recent swing low.
BOOST and subscribe if you like the analysis.
Thank you.
May profits be upon you.

SILVER (XAGUSD, SIL1!) Daily Bias... BULLISH!You see we have a bullish BOS, it formed a +FVG, pulled back to the +FVG and the BOS, found
support and rallied towards the highs... forming another +FVG.
The expectation is for price to tag pull back into the +FVG and rally to the buy side liquidity.
If price runs the BSL before pulling back into the +FVG, then the probabilities of prices going
higher are significantly lower.

TELL ME WHAT YOU SEE IN GBP/USDPlease if you found this helpful drop a like and follow, let us discuss it in the comment section.
To me, this trend looks like expanding and also counting the ELLIOT wave inside the trend. We should be looking for a buying opportunity if the price continues holding the particular zone

GBPUSD daily forecastPrice has reached a break out. It is in the final phase of re-Distribution and it has revealed its major sign of weakness thus we are looking for shorts.

EURUSD DailyCan I just say WOW at the rejection at the 200MA ?!? Honestly this is playing out how I would like to see the market.
I recognize a price action candle, the shooting star. The shooting star often occurs when the market is buying and begins to react at some level of resistance. I am identifying my level of resistance as the 200MA.
I would like to see todays candle (11/16) to close as an engulfed candle. ONLY IF todays candle close with momentum, the market is likely to continue to sell…
But as of right now, I am going to sit on my hands and continue to watch the market form.
