EURUSD: Rising from Bottom of Range; Approaching Supply ZoneEURUSD has climbed for the 2nd consecutive days and is about to approach its previous high at 1.1215.
Based on the previous wave of rising trend, the price is expected to climb beyond 1.1215 and test the supply zone just above 1.1220.
As of now, the price might experience a short period of consolidation between 1.1190 and 1.1160.
It would not be a good price to make any trade since its trading in the middle of the 1-month range between 1.1260 and 1.1120.
Wait for the price to break out of the consolidation and test the supply zone from 1.1120 onward and look for selling opportunity.
We will continue to monitor and observe the development of the current rising trend for the time being.
Dailyforecast

Gold: AB=CD Pattern, Awaiting 2nd Wave of Bullish TrendThe gold has retraced through the week after the 1st bullish trend has completed from 1273 to 1287.
The retracement has formed an AB=CD pattern and the price is slowly breaking away from the bearish structure as seen in H1 chart.
The candle bodies have shrunk as it fell towards point D of ABCD pattern which is a sign of weakening sellers.
It is a good time to consider buying the gold now with a stop loss around 1271.

EURUSD: 2nd Wave Retracement in ProgressContinuing from my previous post on EURUSD, the price is already in the midst of completing the 2nd wave of retracement.
The price is most likely to rebound off around 1.1170 just above the illustrated seller trap zone.

EURUSD: 1st Wave of Retracement Completed and Awaiting the 2ndThe day ended with the 1st wave of retracement completed.
The consolidation before the 2nd wave of retracement has just begun and will take a while more until the Euro session later.
The price is most likely to retrace towards the 1.1170 - 1.1160 region just right above the breakout point of the previous falling trendline.

Gold: 2nd and Strong Breakout of Falling TrendlineSince the first breakout of the 3-Month falling trendline, the gold fell all the way close to the previous low and found support at 1273.2.
The price consolidated for about 2 trading days and yesterday it finally jumped and broke above the falling trendline for the second time.
This is also fundamentally caused by falling stock prices and weakening of the dollar as it found resistance at the previous high which is largely the cause of the US-China trade war.
The dollar is most likely to fall further resulting in a stronger gold price in the short to mid-term perspective.
Wait for the price to retrace lower and look for buy opportunity again when the price is closer to 1280.

USDCHF: Broke New Low, Awaiting Completion of RetracementUSDCHF has retested a supply zone at 1.0120 and is considered successful as it had fallen and broken new low.
The price is currently in the process of retracement with the 1st wave completed and the 2nd wave in the midst of completion.
Wait for the 2nd wave of retracement to be completed around 1.0108, setting the stop loss just above the previous high or above 1.0120.

USDJPY: An Intraday Buy after Mini ABCDUSDJPY has just completed a mini ABCD, a consolidation of 2 waves of movement in the same direction of equal time and volume, and is likely to climb further to close the gap left uncovered since 6th May.
The price has closed above the breaking point at 110.30 with a strong bullish candle, signalling that it is likely to climb further.
Also, This buy setup came after a failed sell setup which therefore leads to the belief that there's currently no sellers until the gap is closed.

USDCHF: Break of Consolidation, Trend ContinuesUSDCHF has turned bearish ever since it fell and broke below a previous low at 1.0130.
The retracement has started and lasted for the whole of last week and finally found itself broken yesterday by a strong bearish full-bodied candle.
It fell a little further to confirm the break before it retraced again and retested the supply zone and the breaking point around 1.0115.
The retest seems successful as of now as the price fell again in the last hour.
Therefore, this could be a good opportunity to sell after the retracement.
Furthermore, the dollar has climbed back above 98 while the U.S. is still in the midst of an intensified trade war with China.
I doubt that the U.S. government will remain silent about the dollar at this point of time.

USDJPY: Three Waves of Retracement CompletedUSDJPY has turned bearish since it broke below a 4-month rising trendline.
The price has fallen for extensively for close to another 2 weeks before it begins its retracement since last week.
The price has retraced significantly and completed 3 equal waves, a sort of ABCD pattern with the extension of EF.
There is a good reason to believe that the price may start to fall now asides from the retracement.
It is unlikely for the price to return back to the level of 111 where many orders are trapped due to the break below of the 4-month rising trendline.
The price will fall again in order to wipe out any remaining buyers.

Gold: Bullish Bat After Double BottomThe intention to long the gold just like the post yesterday stays the same.
We are supposedly expecting an ABCD pattern near 1290 and that price will continue to climb.
However, the price fell too fast and more than what's needed, yet another formation appears which still favours the bulls - a bullish bat pattern.
The completion of the bat pattern is part of a retracement after a successful double bottom.
The bat pattern is now seen completed at the previously broken rising trendline.
Thus, now would be a good opportunity to buy gold.

Gold: Trend Turned Bullish, Awaiting RetracementThe gold has broken above the key price of 1300 soon after it has broken above a 3-month falling trendline.
The trend has clearly turned bullish brought forth by a significantly bull strength.
Since the price broke above 1300, it fell into a consolidation yesterday and the price continues to retrace lower.
A retracement channel has been plotted to determine the end of the retracement which can be seen right at a rising trendline and the breaking point of 1290.
Thus, wait for the price to complete the retracement channel and look for buy opportunity at the bottom around 1290.

EURUSD: Awaiting Rebound from Bottom of RangeWe have been expecting the 2nd wave of bullish trend since the price climbed from a 2-Year low around 1.1120.
However, the price has fallen into a major range for the past 2 weeks.
EURUSD ranged further after it failed to break new high and it is about to retest the bottom of the range.
Look for buy opportunity near the bottom of the range at demand zone 1.1170.

USDJPY: Bat Pattern within Supply ZoneUSDJPY broke new low yesterday and has recovered fully.
The price has seen retraced back and beyond the breakout level at 109.50 which shows that USDJPY is prone to selling.
A bat pattern is formed in the process and the price consolidated within the supply zone.
This would be a good opportunity for an intraday sell where the price is expected to fall further on safe-haven demand of the yen.

EURUSD: 2nd Wave of Bullish Trend in ProgressionSince the price climbed and closed with a very bullish candle on 9th May, the price has undergone a stage of consolidation up till now.
In fact, there's a prominent bearish ABCD pattern completed from 1.1136 to 1.1250, yet the price only started to crept lower from last Friday and selling pressure is still absent.
The obvious reason here is that there's a major ABCD pattern that's started since 26th April from 1.1120 and the 2nd wave is still in the midst of completion.
The 2nd wave of bullish trend is still clearly on track in comparison to the volume and duration of the 1st wave of bullish trend.
I am expecting that the price will retrace lower and we can look for buying opportunity right at the demand zone at 1.1215.
Nevertheless, there always lies a possibility of a delayed bear strength so be quick to react if things go south.

EURUSD: Short-Term Trend Turned BullishIt is mostly confirmed that the short-term trend has turned more favourable to the bulls.
The price faced strong resistance after it attempted to break above 1.1215 together with the falling trendline.
The day closed with a long upper shadow yet there's no sign of sellers today even as we are already entering into the euro session.
If the seller has shown no interest at the current price, it would simply mean that they are still waiting for a higher price to sell.
Wait patiently for the price to retrace lower again towards the supply turned demand zone to buy again.

Gold: Short-Term Trend turned Bearish as Bulls Ran DryThe gold has completed the second wave of a bullish run and plunged when it reached a 2-month falling trendline.
The full-bodied bearish candle decisively broke below a rising trendline and no significant rebound is seen afterwards.
The price has consolidated for the 2nd day but only recovers less than half of what's loss from the plunge.
Therefore, the gold is definitely feeling more bearish and another wave of bearish trend should appear soon enough.
Wait for the price to consolidate further into the US session and look for selling opportunity around 1287. Stop loss should be safe enough above the previous high at 1292.

GBPUSD: Three Dive Down and UPGBPUSD has begun the process of retracement since the beginning of this week after it has surged as it turned bullish after breaking above a 7-week falling trendline.
It has completed 3 waves of retracement, or what some people called as three-dive down, and the price is now back to the sentimental price of 1.3000.
This would undoubtedly be a worthwhile trade to make a critical price level and which credible reversal pattern such as three-dive.
Most importantly, goo traders find good levels to trade but phenomenal traders react quick enough to changes as the best price and setup does not guarantee us a winning trade.

AUDJPY: Post-RBA Rate StatementAUDUSD didn't make it for proper completion of ABCD but AUDJPY did.
Selling the aussie against the yen instead of the dollar might be a better choice at this time as safe haven assets have started to gain in demand.
This is a near-perfect technical setup if we try not to complicate too many factors into a trade.
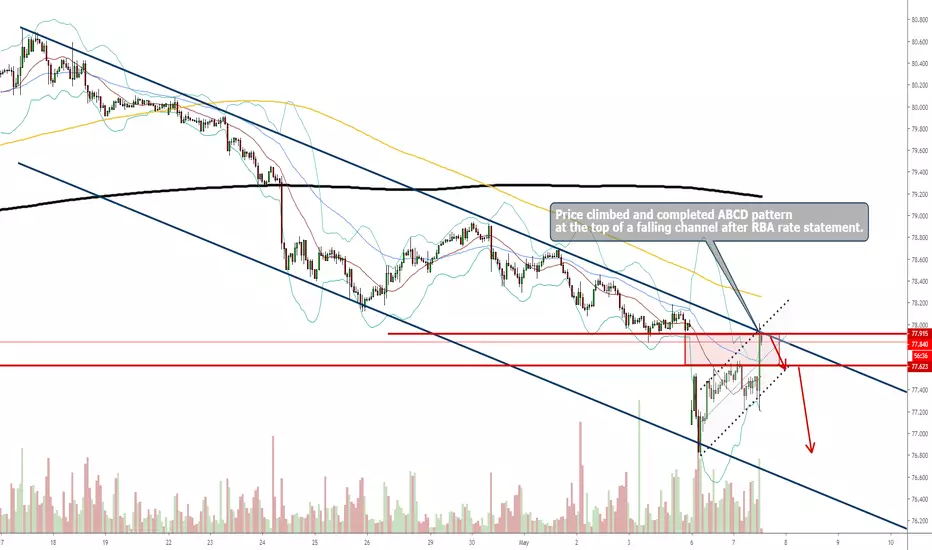
AUDUSD: ABCD Pattern, RBA RateThe RBA will release its rate statement in less than an hour.
The fresh new threat of the US-China trade war is very likely to be reflected in the statement which is most likely to be bad for its currency.
The aussie has plunged since the market opened this week.
While the price has retraced significantly, the gap has yet to be covered.
Therefore, if the price decides to cover the gap before the aussie continues to fall, an ABCD pattern will be completed at 0.7020 during/after the rate statement.
Should the gap be left opened, the price may attempt to break new low but unlikely to have a lasting effect.

Gold: Continuation of the Bulls but Pay PatienceThe gold jumped in the first hour when the market opened but fell into consolidation immediately afterwards.
This move showed the intention of accumulating buy orders at the top what would be the best to do now is to wait.
Wait for the price to retrace lower, wait for the patience of those who chased at the top to run out of patience.
The first point of re-entry is seen at 1279 which will close up the gap.
The extreme low for re-entry is seen between the price of 1276 - 1273.

USDJPY: Break Above of Falling Trendline amid Strong ReboundUSDJPY is about ready for a fresh new bullish trend after a hawkish FOMC.
The price saw itself surging as it rebounded off from a key demand zone supported by a 4-month rising trendline and after the completion of an ABCD pattern.
The price has now closed above the falling trendline and stands above the previous high of 111.55, thus affirming a new bullish trend to carry on.
The price is now in the process of consolidation before the next bullish wave.
For a long position, we will wait patiently for the price to retrace below 111.40 to 111.20.
A stop loss just below the previous low of 111.03 should be sufficient, provided the retracement completes without any signs of strong selling pressure.

Gold: Second Retest at Top of RangeThe gold has been consolidating downwards since the price has jumped over the top of the range at 1280.
It has taken 2 waves of downwards movement and the price had two successful retests at the breakout level 1280.
Therefore, we are expecting the price to rise from here as it embarks on its second wave of an uptrend and face strong resistance at 1294 (see chart).

USDJPY: ABCD in Progress Towards Key Demand ZoneUSDJPY came down strongly after a fake breakout of 112 since last week.
We can clearly see a falling channel is forming since the first wave of bearish movement has ended and as the second wave is still in progress.
In an ABCD pattern, it is important to watch for the break of point C before we can conclude that it is able to form D and that's what's happening now.
So let's wait patiently for the price to complete the ABCD pattern as it enters the key demand zone around the price of 111, sitting on a 4-month rising trendline.
This demand zone is strong also due to the fact that many sellers might have been trapped after the breakout of a falling channel in 11th April.
