USDJPY: Trend Reversal, Broke of Rising StructureJust when we are ready to follow the trend and continue to buy, a strong supply came in and near the 4-month supply zone.
The price has broken below a 1-month rising trendline as well as the bottom of a range, and it is even clearer if we look at the strong bearish candle in the Day chart.
The structure has changed into a bearish market and the price has also retraced to the bottom of the range which is a good price to sell now.
Dailyforecast

USDJPY: Follow the Trend and Buy the RetracementUSDJPY has broken out of consolidation and price managed to close above 112.
The price retraced significantly today and is seen supported now at a rising trendline.
Given enough space to climb, USDJPY is expected to rebound and climb again soon.
We are expecting the price to reach 112.50 and face a strong supply zone.

AUDUSD Buy - Strong Support on Bullish TrendWhen was the last time you have taken a look at the monthly or weekly chart of AUDUSD?
If you do so, you would realise 2 things:
1) AUDUSD is way undervalued.
2) Price is already at the bottom of a 4 years range.
Under these 2 conditions, there's very little reason for us not to focus on buying AUDUSD.
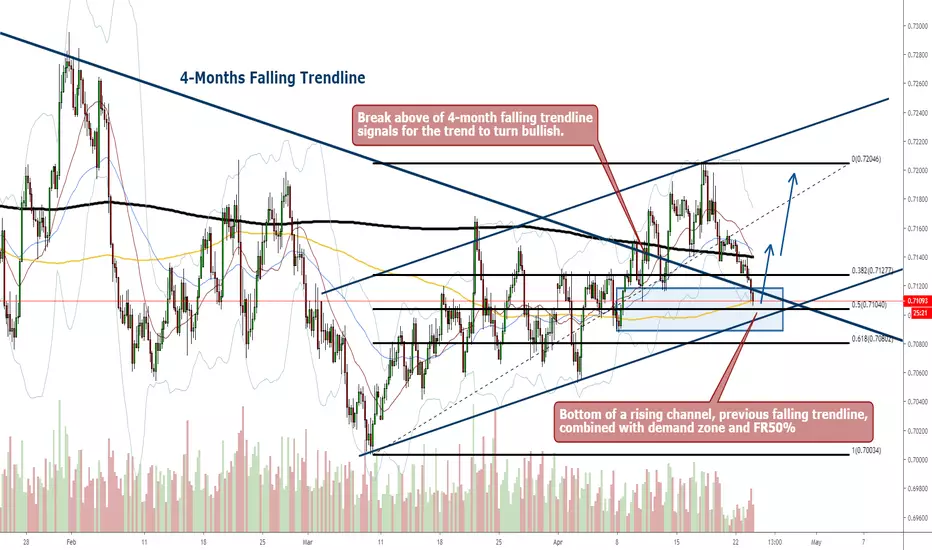
Previously, the price has already broken above a 4-month falling trendline, signalling for a turn into a bullish trend.
The price climbed and retraces within a rising channel and it is now about to reach the bottom of the channel.
Furthermore, the price will also find support at the previously broken falling trendline, as well as the 50% Fibonacci level, just enough for a bullish trend to resume.
EUR/JPY, LONG, DAY CHART (2-JAN-2017)Note: EUR/JPY follows our prediction previously.
Overall, we remain bullish on this pair.
We have 2 trading plan for this pair:
1. Long now or zoom into H4 chart to look for
pullback and bullish signal to long.
2. We wait for pullback to the support zone again and
another strong bullish signal to long with right
risk amount.

EURUSD Sell - Retracement Channel Under CompletionSince EURUSD has broken below both rising trendline and bottom of a range with a strong bearish candle, the price went into consolidation since last Friday.
The consolidation has carried on till now where the 2nd wave of retracement is most likely to be completed by the US session.
Once the retracement channel is completed, we can look for a sign of a stop for any further upward movement and look for selling opportunity at 1.1258 - 1.1270.
If price persists to consolidated further upwards, we will wait for 1.1280 which is the breakout level on the bottom of the previous range.

EURUSD Sell - Lack of Demand, Poor Euro DataEURUSD plunged through the bottom of its current range a well as a rising trendline as weak euro data caused euro to weaken.
It was also probably due to the lack of demand to support the price after a second retest of the breakout level.
Based on the current movement, the seller is clearly in control of the trend and will most likely fall further.
During the U.S. session later, we can wait for the price to pull back towards the breakout level at 1.128 for a retest and look for a reversal signal to sell.

Gold Sell - HnS Neckline Broken, Sell the PullbackGold has finally broken below the neckline of an HnS which has been forming since the beginning of the year.
This is a clear sign of a bearish trend but we always avoid chasing after the trend whenever a breakout happens.
Instead, wait for the price to pull back and retest the breakout level (neckline) to see if there's any more demand left and if there's more supply to keep pushing the price lower.
Let's wait for the retest from 1.284 and we can look for a selling opportunity if there's a clear sign of a stop.

USDCAD Sell - Top of Sym Tri and Supply ZoneUSDCAD rebounded strongly yesterday after strong demand appeared at the bottom of a 1-month symmetrical triangle.
The price closed above the middle of the whole ranging structure signalling that the price may climb further.
The price is likely to climb higher with some remaining demand and will retest the top of the symmetrical triangle where the price will face with very strong resistance.
Wait for selling opportunity within the supply zone at 1.3420.

EURUSD Buy - Continuous Range Breakout and RetestEURUSD has reached the bottom at 1.1188 and fell into a range.
The range was broken above last week and the price fell into another minor range while sitting on to of the previous range.
On the last trading day, the range was broken once again and therefore we will most likely experience another short-term range.
As long as the price is seated on top of the range, it will most likely rebound higher as it gets closer to the rising trendline.
Look for buying opportunity between 1.1288 and 1.1276.

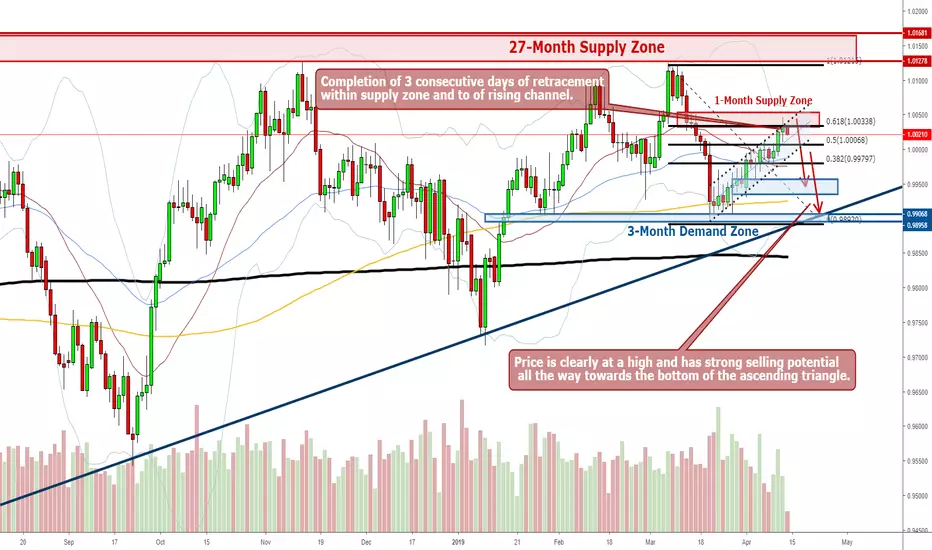
USDCHF Sell - Ending 3 Consecutive Days of RetracementUSDCHF has stubbornly climbed for the past 3 consecutive days.
Yesterday has however shown that price has met with strong resistance within the supply zone.
It is important to note that the price is considered to be very high as it is getting very close to a 27-month supply zone.
It is also obvious that the buying strength is not particularly strong as compared to the previous downtrend.
Therefore, today which is also the last trading day of the week, there's a high possibility that institutional traders will begin the process of distribution.
In conclusion, whether is it the technical patterns or the consideration of supply and demand, the price is most likely to proceed into a bearish trend.
USDCHF Sell - Supply Zone at 618 LevelUSDCHF diverges from the dollar during the euro session and continues to climb within a rising wedge when the dollar starts to fall again.
If we compare both dollar and USDCHF in the D1 chart, we will see that both are trading within an ascending triangle and that sellers are more in control then the buyers.
The dollar has already started to fall while USDCHF is seen completing its retracement and will soon reach a key supply zone at 618 level.
Wait for the price to pierce through the top of the rising wedge and look for strong signs of sellers.

EURUSD Buy - Awaiting Pullback to NecklineAfter the dollar has climbed for the past 3 weeks, the price has started to drop from a high since the beginning of this trading week.
EURUSD has managed to close above a 1-week range yesterday and that signals for the price to climb further with the dollar starting to drop.
Therefore, we can look for intraday buying opportunity should the price pulls back, which in this case, the neckline around 1.1240.

Gold Buy - H1 Inside Bar Break UpRise and shine, and the gold climb and break above the range.
In that process, an inside bar was formed in the H1 chart and then broken upwards.
It seems that the gold has chosen to run one more wave of bulls.
Wait for the price to pull back to 1293 - 1290 to look for a buying opportunity.

Gold Sell - Breaking Through Neckline of HnSGold has ranged above the low of 1283 for the past 4 trading days.
And last night, there was an attempt to break below the range which it did so base on the smaller timeframe from H4 onwards.
The price made a strong pullback but it still failed to stand above the range or make a higher high.
Thus in this case and with the head n shoulder formation, the price, today, is most likely to plunge.
This daily forecast is also inlined with my weekly forecast.

USDJPY Short - Bearish Bat Pattern, Dollar OverboughtAs the dollar reaches beyond 97, it is technically entering an overbought zone and may be vulnerable to selling pressure.
So the USDJPY has climbed pretty much through the Asia session and stands above 111.
A bat pattern is on its way to completion where the final point is expected to end in the supply zone around 111.50.
Therefore, if the dollar continues to climb further into the overbought zone while the USDJPY climbs too to complete the bat pattern, we are expecting there's going to be some strong selling pressure.

USDCHF Long - Price may Climb Amid Weak SellingThe price consolidates for the 3rd day as the price continues to retrace.
There hasn't been any significant selling and the price has yet to reach any strong supply zone.
Therefore, the price is expected to retrace further and climb towards the supply zone near 1.00 which overlaps with a previously broken rising trendline.
For intraday trade, traders may consider to long around 0.9930 but bear in mind that dollar is fundamentally weaker after dovish FOMC last week.

FTSE - Intra Day Analysis Sell from 7210-7240 for 40ptsIf FTSE rallies to 7210+ , sell for 40pts as FTSE is a bit over bought at the moment.

USD/JPY Daily TriangleUSD/JPY Daily Triangle + Triangle on Month chart + strong supply zone on confirm triangle.

EUR/JPY climbs to 129.46Daily outlook - EUR/JPY climbs to 129.46
An early hours of Monday’s trading session revealed that the EUR/JPY currency pair has successfully used an upside moment that was created by a release of data on the US CPI last Friday to surge not only to the 129.46 level, but climb even a little bit higher.
In theory, the pair has a chance to gain a foothold at the monthly PP at 129.78.
However, three red candles in a row combined with the CCI and RSI technical indicators suggest that the pair has reached already its maximum and now will start to decline.
If this assumption is true, then the minor overstep beyond the above 129.46 mark simply represents a bearish fakey pattern.
This scenario is, generally, supported by the market sentiment, as 68% of traders continue to hold short positions on this currency pair.

USD/CAD, DAY CHART, SHORT (16-JAN-2017)Note:
We are more bearish on this pair now.
There is a potential Double Top Setup.
Let's see if it is able to break the neck line at
1.312 level
Here are 2 trading plans:
1. Short when the price break the neck line
powerfully or after breakout followed by pull back.
2. Wait the price correction to the next resistance
level at 1.319 level and short again.

AUD/USD, DAY CHART, SHORT (8-JAN-2017)Note:
From the big picture, we remain bearish on this
AUD/USD.
There are 3 possible trading plans for this:
1. If the price break the support line at 0.729x level
significantly, wait for pullback to short with right risk.
2. If the price continue pullback back. 0.742x level
will be next shorting opportunity.
3. if the price correction is way too strong, it might
restest the strong support line at 0.753x level.
Another better short area.

AUD/CAD, SHORT, DAY CHART (8-JAN-2017)Note: Congratulation for those who follow our trade
last week. If you never move your SL, your trade is
in good profit now.
We have 2 trading plans here:
1. Watch the next Support Zone near 0.96x level.
The price might have either some consolidation
or pullback.
Wait for right bearish signal to short.
2. If the price pullback again to the 20-EMA, wait
for bearish signal near 20-EMA to short.

USD/JPY, DAY CHART, LONG (2-JAN-2017)Note:
Overall, we remain bullish on USD/JPY pair.
Now, price having correction to 20-EMA, followed by
a bullish signal.
It is a Swing Setup, but aware of the immediate strong resistance zone.
There are 3 trading plans for this trade:
1. Long now with little risk amount as it is a
good swing setup.
2. Wait the price having more correction to the
strong support zone, it is a good time to accumulate
long positions.
3. If the price managed to break the strong resistance
zone, wait for Pullback and bullish signal to long!

GBP/CHF, DAY CHART, LONG (2-JAN-2017)Note:
Overall, we are bullish on GBP/CHF pair.
There is strong pin-bar appeared above the support zone,
a good signal that it might go bullish.
There are 2 trading plans for this pair:
1. Wait for another bullish signal to long. Or wait for
2nd bullish signal to long it.
2. If the price breaks the support zone. Wait for
pullback to the support zone and short!
