XRP USD DAILY TECHNICALS (4/29/2021)Good morning- crypto ger here for another xrp update- today is Thursday April 29, 2021.
Before we get into the technicals and all the fun stuff- please know that this is not financial advice, this is my opinion and my opinion only.
Lets talk a little about the current trend and yesterdays performance before we get into the daily outlook.
The price of xrp is up 450% ytd
Over 100% on 3 & 6 month range and 37% on the month
The weekly technicals support long positions and are now more favourable than last week- performing well above almost all moving averages-indicating a strong buy position. the oscillators are mostly neutral with a couple of buy indicators. Rsi values are in the high 60s (compared to low 70s last week) & cci is now 163 compared to over 200 last week- these indicators on their own are both neatural compared to sell last week. The bull bear power index is now a 0.6 compared to 1.1 which is still neutral and lastly the macd is still reporting a 0.21 which is a buy. Weekly technicals are a buy
Recapping yesterday-
XRP declined by 3% reversing a gain of 3% the day prior.
XRP hit an intraday high of 1.44 before hitting reverse.
XRP broke through the first major support level before hitting the late intraday low of 1.33 and broke back through major support levels
For the day ahead-
XRP will need to move throught the pivot level to bring major resitance levels into play.
Support from the broader market will be needed to break back through the 1.45s.
Failure to move through the pivot brings support levels into paly
XRP should steer clear of sub 1.20
If you found this video informative please be sure to smash the like and subscribe button- turn on the notifications so you can stay upto date with future content
#XRP
#XRPUSD
#CRYPTO
#CRYOTRADING
#TRADING PLAN
#DAILYANALYSIS
#DAILYOUTLOOK
#DAYTRADING
#DAYTRADE
#CRYPTOTRADING
Dailyoutlook

XRP USD 7 - 14 day patternGood morning- crypto ger here for another xrp update- today is Monday april 26, 2021.
Before we get into the technicals and all the fun stuff- please know that this is not financial advice, this is my opinion and my opinion only.
This is a high level pattern analysis based on 2017 fractals on how I imagine the price of xrp to play out.
If you found this video informative please be sure to smash the like and subscribe button- turn on the notifications so you can stay upto date with future content
#XRP
#XRPUSD
#CRYPTO
#CRYOTRADING
#TRADING PLAN
#DAILYANALYSIS
#DAILYOUTLOOK
#DAYTRADING
#DAYTRADE
#CRYPTOTRADING

XRP USD DAILY TECHNICALSGood morning- crypto ger here for another xrp update- today is Monday april 26, 2021.
Before we get into the technicals and all the fun stuff- please know that this is not financial advice, this is my opinion and my opinion only.
Lets talk a little about the current trend and yesterdays performance before we get into the daily outlook.
The price of xrp is up 450% ytd
Over 100% on 3 & 6 month range and 37% on the month
The weekly technicals support long positions and are now more favourable than last week- performing well above almost all moving averages-indicating a strong buy position. the oscillators are mostly neutral with a couple of buy indicators. Rsi values are in the high 60s (compared to low 70s last week) & cci is now 163 compared to over 200 last week- these indicators on their own are both neatural compared to sell last week. The bull bear power index is now a 0.6 compared to 1.1 which is still neutral and lastly the macd is still reporting a 0.21 which is a buy. Weekly technicals are a buy
Recapping yesterday-
XRP declined by 1.88% a 10.23% landslide the day prior. xrp ended the day week down 26.97% at $1.03.
XRP hit an intraday high of 1.15 before hitting reverse.
XRP broke through the first major support level before hitting the late intraday low of 0.94 and broke back through major support levels
For the day ahead-
XRP will need to move throught the pivot level to bring major resitance levels into play.
Support from the broader market will be needed to break back through the 1.40's.
Failure to move through the pivot brings support levels into paly
XRP should steer clear of sub 0.80
If you found this video informative please be sure to smash the like and subscribe button- turn on the notifications so you can stay upto date with future content
#XRP
#XRPUSD
#CRYPTO
#CRYOTRADING
#TRADING PLAN
#DAILYANALYSIS
#DAILYOUTLOOK
#DAYTRADING
#DAYTrADE
#CRYPTOTRADING

XRP USD DAILY TECHNICALS (4/22/2021)Good morning- crypto ger here for another xrp update- today is Thursday april 22, 2021.
Before we get into the technicals and all the fun stuff- please know that this is not financial advice, this is my opinion and my opinion only. I
Lets talk a little about the current trend and yesterdays performance before we get into the daily outlook.
The price of xrp is up 500% ytd
Over 120% on the all -rolling 1,3 & 6 month range
The weekly technicals support long positions- performing well above almost all moving averages-indicating a strong buy position, while the oscillators hint at a cooling period. Rsi values are in the 70's & cci is over 200- these indicators on their own are bearish. The bull bear power index is 1.10 which is relatively neutral and lastly the macd is reporting a 0.21 which is a buy. Weekly technicals are a buy
Recapping yesterday-
XRP declined by 6.95% reversing a 5.76% gain from the day prior. xrp ended the day at $1.29017. A bullish start to the day saw xrp rise to an intraday high of $1.46406 before hitting reverse..
Steering clear of the first major support and leaving major resistingce untested.
For the day ahead-
XRP will need to move through the pivot level to bring major resistance levels into play.
Support from the broader market will be needed to break back through the 1.40's.
In the event of an extended rally XRP could test the second major resistance levels
Failure to move through the pivot brings support levels into play
XRP should steer clear of sub 1.20
If you found this video informative please be sure to smash the like and subscribe button- turn on the notifications so you can stay up to date with future content

EURUSD LONG, TREND ANALYSISPOSSIBLE FOR AN ENTRY IF PRICE REVERSES AT THE SUPPORT REGION
LIKE AND FOLLOW FOR UPDATE

EURUSD DAILY OUTLOOK EURUSD daily outlook :
price made new low and gave us a nice sell entry on ltf..
my long term target for EURUSD will be 1.16141
will post ltf analysis so make sure to check it out!


EURGBP OutlookPotential for a long position on EURGBP over the next coming days
Schiff fork touches the edge of the channel, which is the same area where we have had prior bullish signals this year (see candles highlighted) thereby making this a likely area of reversal from the current downtrend that began around this time last month
If the price holds in this outlined area of 0.896 - 0.893 then we will have confirmation of an uptrend from the March/April lows when the 50D SMA crossed above the 200DSMA, and continuation of the ascending channel
Failing this, we will look to the 200D SMA for support, the same area where the pair has found prior support and generated bullish candlestick patterns
Strong resistance found at the 0.917 area

XRP/USD: Analysis *Daily POV*Overall XRP looks to be bearish in the long run maybe just to 0.25000, and i think that because price has stabbed the red structure multiple times which makes me think price doesn't like this zone, but price has been consolidating on a lower time frame. Lets see what happens!

BEARISH ON EURNZDAfter rejection of previous resistance and current bearish trend, I'm looking for shorting EURNZD if we see a break and close of the daily candle beneath the highlighted area.

GBPCHF Entry 1.18998 Exit 1.17521 Parallel ChannelGBPCHF Entry 1.18998 Exit 1.17521 // Parallel Channel

Dax daily: 27 Jul 2020As expected, Friday's session started with a descend towards the S/R zone at 12 882. Bearish traders pushed even lower and the support didn't hold their strengths. The VPOC has also shifted below this zone and this can signify the lack of commitment for further longs and the end of uptrend of the past days.
Important zones
Resistance: 13 119, 12 882
Support: 12 592
Statistics for today
Detailed statistics in the Statistical Application
Macroeconomic releases
NIL
Today's session hypothesis
Monday sessions are statistically slowest for the German stock index. For today, we don't see otherwise and expect the trading activity to be limited around 12 882 level. Bounce away from 12 882 to the downside can cause a sell-off, but considering the consolidation price action around these levels, we don't expect any wild moves here.

EUR/USDEUR/USD
EUR/USD Is on a structure level on a daily time frame (resistance)
While forming a falling wedge patter on 4hr time frame with a bearish :bear: divergence all which is indicating that the price might fall soon
:warning:DISCLAIMER :warning:
If you place a trade based on this analysis you are at your own risk

GBP/USD IDEADo your own analysis ...
Dont Forget Moving StopLoss At Breakeven
Disclaimer!
This post does not provide financial advice. It is for educational purposes only! You can use the information from the post to make your own trading plan for the market. You must do your own research and use it as the priority. Trading is risky, and it is not suitable for everyone. Only you can be responsible for your trading.

USD/CAD Daily: Previous Weekly Low Holding PriceLast Week Closed Fairly Bullish, Long Buyers probably expected this week
to continue bullish run but what happened? Price sold off and made a new Week Low?
Price Broke previous week low and that is were the buyers stashed their SL's We have the Stops now
let's try to ride to the top with that Volume.


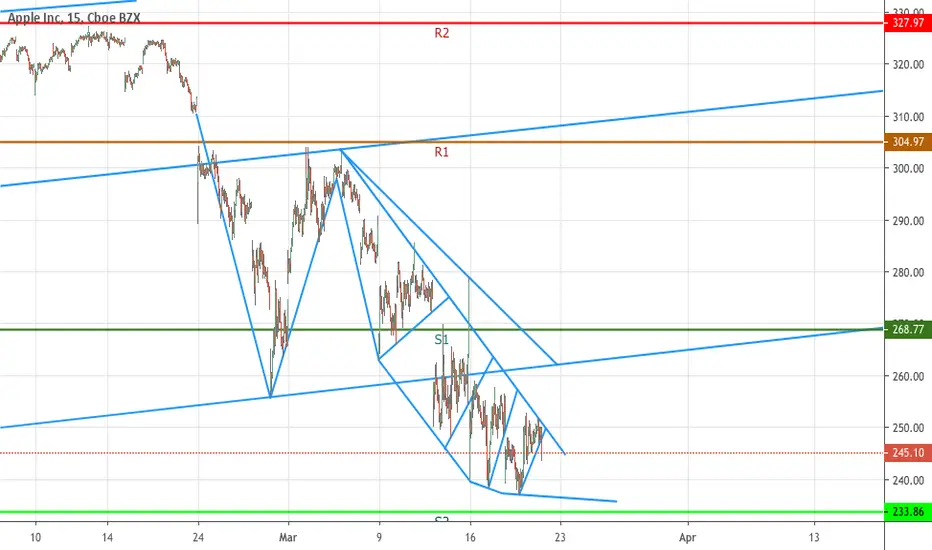
$APPL Just a small chart I made for some daily activity. You can see that it's bearish but it's also leveling off at a strong support area. Only the future can tell where we go. GLTA :)
Dax daily: 02 Sep 2019 Welcome to this first analysis of the month of September. Friday's session started by a relatively fast retest of our resistance zone at 11 899, which hasn't even slowed down the price momentum. The uptrend was seen until 15:00 when Dax corrected the bullish move by descending lower to retest the newly formed support at 11 899 which was our valid resistance at the beginning of the session. Dax closed in its upper range.
Important zones
Resistance: 12 037
Support: 11 868, 11 771
Statistics for today
Detailed statistics in the Statistical Application
Macroeconomic releases
09:15 - 10:00 CEST - Eurozone PMIs
Canada & USA - national holiday
Today's session hypothesis
Today's afternoon session might be slower than usual due to public holiday in the US and Canada. Morning session might be influenced by the series of PMI reports from the Eurozone. We also have an increased statistical probability for breaking Friday's high. We could see buyers jumping in at around 11 868 and if that scenario turns valid and the high will be broken, sellers are likely to correct the upside move at 12 037. Considering the fact we also have an increased probability of closing inside Friday's range, it is logical to focus our targets back into the range should the price get above or below the high/low from Friday.

EURCAD Monthly/Weekly OutlookFirst off, there is a monthly Ascending triangle. The orange lines represent monthly zones. The circles show the touches of the trendline zone. So the monthly has some uptrend structure. When we look down at the Daily chart, we see at the market is currently in a downward parallel channel. However, I'm looking at it bouncing off of one of the bottom two green support zones with confluence of the trendline to continue that monthly uptrend and make it to the monthly resistance that the arrow stops at on the monthly chart at least. For now, I'm looking for it to possibly push back up to the top of the resistance line on the channel then come back down to one of those bottom 2 green supports then go up, or to break the resistance of the parallel channel retest it and start the uptrend now. Either way, I'm seeing that push up for the monthly ascending coming soon. I don't see this downtrend going down past those two bottom supports. But, we know these markets do what they want. So I could be horribly wrong. We will see.
Trade at your own risk, I am not a professional and this is not professional advice. I just read some books and think I know a little something.
PatiencePays

Dax daily: 30 Aug 2019 We welcome you to this last Dax analysis of the week, month and summer holiday. Thursday's session appeared quite innocent in the first hour of trading. At 9 am, Dax shot firmly upwards and this momentum lasted till noon. At around 4:30 pm, Dax fell lower by some 90 points just to correct this volatile spike even above the initial fall.
Important zones
Resistance: 11 899
Support: 11 774, 11 700
Statistics for today
Detailed statistics in the Statistical Application
Macroeconomic releases
NIL
Today's session hypothesis
It appears today we could finally close the resistance at 11 899 where we hope to find some sellers at the first retest. If we target the first one lower, buyers could be seen at 11 774 or even lower at 11 700. Should the price really drop down to 11 700, all our hypothesis for a bullish move turn invalid as that level is now distanced some 150 points away.

