Dax daily: 24 Jun 2019 Welcome to a new trading week. Friday's session turned out as expected, but unfortunately, our zones didn't get a chance to play a role. The resistance at 12 337 and 12 373 didn't attract any sellers. They entered a bit higher at 12 409 and continued to dominate intra-day price action. Dax then closed just short of the support level laying at 12 219. Today, we open with a strong ascending candle and with a long gap.
Important zones
Resistance: 12 350
Support: 12 219, 12 191
Statistics for today
Detailed statistics in the Statistical Application
The statistical probability of breaking Friday's low stands at 96%
Macroeconomic releases
10:00 CEST - German Ifo Business Climate
Today's session hypothesis
Today we have a very high probability for breaking Friday's low. For this reason, every short signal has a clear target. If and once that happens, we could find some buyers at 12 219 or 12 191. Even though we have such a high probability for a certain market occurrence, don't forget to always manage your risk and don't bet too much on one card.
Dailyoutlook

Dax daily: 13 Jun 2019 Yesterday’s session can be characterized as a very lazy one. Dax first took a slight climb towards our resistance at 12 117 where we found some sellers. Following was a 55 points move down. That’s about it, nothing more interesting from the price action perspective as the price was ranging lazily for the rest of the session duration. The overall intra-day range was below the average 70 points. Today’s gap has already been closed.
Important zones
Resistance: 12 144, 12 194
Support: 12 012
Statistics for today
Detailed statistics in the Statistical Application
Macroeconomic releases
NIL
Today’s session hypothesis
Due to the fact the price hasn’t moved anywhere yesterday, our zones remain unchanged. If the price reaches 12 144, we expect to see some bearish push towards 12 012. Considering the fact there are no relevant news scheduled for the day, the session might turn out similarly to that of yesterday.

Dax daily: 12 Jun 2019 Our analysis yesterday met our expectations. Dax did not close the gap and went right up towards the 12 207 level where we saw some sellers taking over. There was even an intra-day high formed at 12 207. Following was a descend almost to the open level and today we open with an ascending gap.
Important zones
Resistance: 12 144, 12 194, 12 117
Support: 12 012
Statistics for today
Detailed statistics in the Statistical Application
Macroeconomic releases
NIL
Today’s session hypothesis
Today we can expect a move upwards to close the gap, which doesn’t have the highest statistical probability and therefore we hope to find sellers as soon as around 12 117. If Dax goes above 12 144, then the breakout of yesterday’s high has a very small probability of just 7%. In case sellers dominate the market, we could potentially find buyers around a nice support level of 12 012.

Dax daily: 11 Jun 2019 Yesterday, we expected a retest of 12 139 and the drop towards the trend line. Dax did not reach all the way towards the resistance zone, but the return to 12 046 level worked well. The market met both of our indications – the support zone of 12 046 and the trend line. Bulls were not strong enough in the afternoon session and the price closed slightly negative at 12 084.
Important zones
Resistance: 12 139
Support: 12 046
Statistics for today
Detailed statistics in the Statistical Application
The statistical probability to close the gap is only 38%
Macroeconomic releases
NIL
Today’s session hypothesis
The price opened with an ascending gap sized 50 points, right at the mentioned resistance level. The statistical probabilities incline the gap closure is unlikely for today’s session and this indicates a bullish bias. Should the uptrend be formed and confirmed, we estimate the price is to reach 12 207 level.

Dax daily: 07 Jun 2019 Yesterday’s resistance at 12 064 functioned absolutely exemplary. There was even an intra-day high formed at this level and the price bounced some 170 points southward. Dax has eventually found some buyers just before the support retest at 11 861 and closed the day mid-range.
Important zones
Resistance: 12 139
Support: 11 861, 11 790
Statistics for today
Detailed statistics in the Statistical Application
Macroeconomic releases
14:30 CEST – USD – Non-Farm Payrolls
Today’s session hypothesis
Today’s probabilities are quite strong to close the gap and we estimate this to happen yet in the London trading session. All our zones are relatively distanced so in the end, the price doesn’t need to reach any. From the Price Action perspective, the price is rather to continue long towards 12 139 where the shift of power is likely. Beware of today’s labour market news from the United States and Canada being released at 14:30 Central European Summer Time – CEST, as these fundamental news could trigger some volatility for Dax.

Dax daily: 05 Jun 2019 Yesterday’s session is a nice confirmation of a clear support level laying at 11 620. After the price broke out of the 11 778 level, Dax shot up to hit 11 860. The momentum was strong enough and that level didn’t slow the price at all. Bulls went even higher to close at the intra-day high at 11 985, which is btw one of the resistance levels we previously highlighted.
Important zones
Resistance: 12 064, 11 986
Support: 11 861, 11 778
Statistics for today
Detailed statistics in the Statistical Application
Macroeconomic releases
09:15 – 10:00 CEST – Eurozone PMIs
Today’s session hypothesis
The price opened the day without a gap. It is very likely we see some initial correction of yesterday’s bullish momentum, followed by another upside move. If we go long, we shall target the resistance level of 12 064. This price was important in the past and this confirms the occurrence count there. If bulls are not that strong today, we estimate a sideways price action, along with the 11 860 level functioning as our support zone.

BTC Breaks Daily 55 EMA - First Time Since November '18Long-Term Outlook: More Bullish Action. Many possibilities exist and things are looking very interesting for the longer term. The true test will be breaching the low 4k level at the resistance line. The green box inside the volume gaps could be a nice resting place if the bulls can handle the climb.
Short-Term Outlook: The RSI on shorter time frames is oversold, so we need to reset for continued strength
My position: I am long and leveraged with my stop above breakeven now :)
I am not a financial analyst. Only trade what you are willing to risk. Risk = reward though and fortune favors the brave.
fortis Fortuna adiuvat


1:3 r/r trade opportunity on BTCEUR ...... in the final stages of the perfect descending triangle that started months ago.
Buy @ 5'300, SL @ 5'200, TP @ 5'600

BTC daily Thoughts BITFINEX:BTCUSD
BITMEX:XBTUSD
hello everyone
Daily Thoughts and updates:
1D second day of confirming reversal with Heikin Ashi
:eyes: how lines of MACD got closer but because of dump actually got far away from each other making it harder for positive HIST to appear
RSI and STOCH are Also curving down. Generally I think PA will head more DOWN but we might visit 6400 area again because of high volatility. Anyways even if tries to PUMP for breakout IMO it wont get too much more than EMA 20 (~6400-6500 area).
12H SHORT Signal. TBH i've been waiting for it from yesterdy. NOW got. so keep looking how plays along the day.
(I wanted this signal because Im short this last days and this is my confirmation)
6H is showing some UP movemnt IMO. like the 12H anti-thesis, Notice the RSI and STOCH curving UP from bottom indicating probably PA UP.
I watch the macd carefully on this one as if it breaks to positive HIST could trigger a run UP.
3H seems bullish as fighting for getting price to EMA ~15 (at least)
pump to ~6370 might play out.
1H same concept only here we can see how PA stops and having trouble breakout EMA 15
also Stoch RSI is at top so if a move up wants to play stoch RSI must cool off at least a bit.
Mt guess tpday IT WILL BREAK and pump to ~50 EMA on Hourly before DUMP continues.
30 min
waiting for "scalp" signal (long)
No signal = PA DOWN
15MIN fight tries to break EMA 50
if break ill be watching the next TF (30 MIN)
5min "scalp" long signal
ALL NO ADVICE just my real thoughts and analysis
I also stream alot so make sure to follow me on Discord and TradingView for full updates:
Discord: discord.gg
TV: www.tradingview.com

Daily Outlook of USOILCrude Oil 4 Hour cycle is bullish against 2/11/2016 (26.05) low and 1-hour cycle is bullish against 6/21/2017 low (42.05). Oil has ended cycle from 8/1/2016 low (39.19) and currently correcting that cycle in 3, 7, or 11 swing in wave IV. As far as bounces fail below 70.44 high, expect Oil to extend lower 1 more leg before the rally resumes. We favor the downside in shorter time frame while pivot at 71.14 high stays intact.
Sell USOIL Pending Order
@69.40/75
Target: 68.00
Stop Loss: 70.00
Good Luck

GBP/USD - NEW DOWNSIDE LEG?Despite the GBP's surge on Friday following the reached agreement on migration between the EU and U.K the Pound still looks like it can print a new downside leg.
The Monthly candlestick closed below the key support region of 1.3250 and formed a hanging man candlestick which was mirrored on the Weekly timeframe also.
Here on the Daily timeframe, we can clearly see lower low's and lower high's being printed with the most recent low printed last Friday 29th June before rebounding back into the refined Fibonacci region of 61.8 and 78.60% which is a great area for reversals.
My viewpoint is currently bearish on GBPUSD and today's Manufacturing PMI (Jun) 09:00 GMT may disappoint, I will be holding back and awaiting for Monday's movements to clear away in order to gain further clarity.
Candlesticks will be very important in this region as a strong bearish candlestick closure in confluence with a 3rd bounce of the descending trendline could give the signal that i'm looking for.

LTC/USD (BITS) DailyLimit orders set to 127.76 for BITSTAMP:LTCUSD - other than a level below the highlighted range, I don't see too much else before that.
These mini-pops between yesterday and today have been short-lived and weak, succeeded by even greater dips to the downside. In my opinion, swing trading the moves at this time (without any clear direction as to where this market wants to go) increases the risk involved substantially - I've aborted the shorter time frames and resumed the longer-term setups.
High probability demand zones and patience is key.

Bitcoin at crossroads ... episode 4After breaking below support zone (green), Bitcoin will soon be reaching a weak support ascending trend line zone (light blue circle).
Possible scenario, bounce back to the upside after reaching that region ....
Most likely scenario, however, drop down to bottom of channel, convergence with previous bottom

GoldLong term look on gold. We are forming an ascending triangle so we can look buy with the trend line or sell at our horizontal resistance at 1350. There is also really strong support at 1300 which could be another good place to buy. Price is in a range at the moment, but I still think gold is bullish because of the weakness in the dollar.

EUR/USDIn terms of structure we are expecting a lower low. We broke our previous low and there is less buying pressure. I would expect price to move back down to the 1.205 level. Also looking at the previous down swing we can see a steeper angle, which suggest that selling momentum is building. Although caution is necessary, because of how bullish this pair has been over recent months.

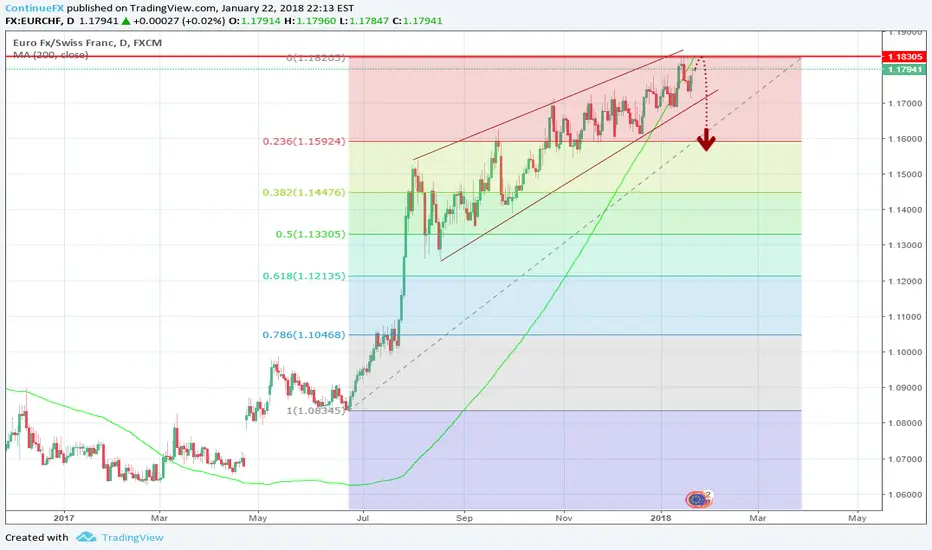
Daily Outlook of EURCHFEURCHF the pair overall is bullish trend , after the SNB Over valued Statement for CHF has fallen more than 100 pips, as technical the pair trading in a upward trending range to test 1.20 floor, but before going to high we can see a short term fall in EUR CHF pair to test 1.1720/1.1690. If the pair break 1.1822 resistance range we have next target of 1.20.
AUDUSD Basic Daily StrategyRemember guys, keep it simple!
As you can see from the AUDUSD chart it is hugging the daily trendline tight. If it breaks and it is not a fakeout, buy that Aussie to the top! If it respects the trendline, wait, be patient and when the time comes it's time to short.
This doesn't work every time, but it can be a clear signal that the direction of any pair may be changing, and the other side of the market is taking over. Apart from sentiment analysis, this is a quick fire way to see if the currency is making a switch and changing major directions.

Daily Outlook of AUDUSDAUDUSD the pair have recovered from early session weakness and are now trading higher, resuming the rallies that began last week with the release of the dovish Fed minutes, As technically the pair trading on 1hr support zone with 200 MA , we expect short term bullish momentum towards test his resistance zone 0.7645/0.7680, if break these level we can see another test 0.7750, overall we can see another fall once again to test 0.7600/0.7540.

Daily Outlook of USD/JPYUSD JPY the pair shows overall Bearish trend,Fed's dovish minutes weighed on US yields, saved on Friday by a strong bounce in their European pairs.The news helped tighten the spread between U.S. Government Bonds and Japanese Government Bonds.this helped make the Japanese Yen a more attractive currency. As technically the pair trading on support zone 111.06 as it tested strong resistance 111.68,we will continue to suggest the bearish trend in the upcoming period supported by the negative formation that its signs appear on the above chart, waiting to break 111.00 to confirm heading towards 110.15 direct, noting that breaching 111.90 will lead the price to start recovery attempts and stop the current correctional bearish pressure. Expected the pair trading in range of 111.00 support and 111.90 resistance.We don’t like buying or selling the pair at this stage

EUR/USD BUY - 11/10/2017
The Euro continued its upward movement and now the price is near the upper limit of the consolidation. It is worth noting that the growth was fairly confident and supported by pretty large volume, which is a strong bullish sign. Unfortunately, volume was spread throughout the movement, which makes it impossible to single out a specific new volume level. Thus, the most likely scenario is a breakdown of the upper boundary of the local consolidation, which will be an excellent signal for entry, and further price growth. The breakdown movement must be sharp and on large volume, this is a must condition in order to avoid false breakdown, which will make the entrance more accurate and reliable. A stop loss should be placed below a volume breakdown bar or the beginning of a rapid price growth. The potential of the deal is about 110 points.
T he bottom line: long positions are in priority.

EURUSD Backs Off Lower Prices, Eyes Further Upside PressureEURUSD: With the pair halting its weakness to close higher on Thursday, a move further higher is envisaged. Resistance comes in at 1.2000 level with a cut through here opening the door for more upside towards the 1.2050 level. Further up, resistance lies at the 1.2100 level where a break will expose the 1.2150 level. Conversely, support lies at the 1.1900 level where a violation will aim at the 1.1850 level. A break of here will aim at the 1.1800 level. Below here will open the door for more weakness towards the 1.1750. All in all, EURUSD faces further upside on corrective recovery.
Strategy: Buy at 1.1918, Stop loss at 1.1850, Price target at 1.2018 & 1.2070

"Trade what you see not what you think" Bearish Sentiment Validated confluences
1.Support broken resistance validated
2.Trendline broken on daily timeframe
3.Opposing level breached by short sellers (109.000-broken)
4.Profit margin 1:7
5.Strong rally up to sell zone
