Gold (XAU/USD) Daily Trading Plan - 28th July 2025🔺 Technical Analysis
Gold opened the Asian session this week with a slight retracement, testing the 0.382 Fibonacci Retracement level before bouncing back strongly to last week's closing price around 3339. This move further solidifies the price action from a technical perspective.
Notably, gold has broken through a minor resistance on the M15 timeframe, invalidating the bearish structure and forming a full-bodied H1 candle. This sets the stage for a potential corrective uptrend to unfold.
On the Daily timeframe, the initial session's decline retested the bullish trendline and bounced back within the boundaries of the flag pattern. It's likely that this week, the price will continue towards the end of this pattern, providing a clearer confirmation of the medium-term trend.
🔺 Key Macroeconomic News
This week promises to be volatile with several crucial economic announcements, particularly as it marks both the end of the month and the start of a new one. Two key events that traders should pay close attention to are:
FOMC Interest Rate Decision: Always a focal point for the market, with significant impact on safe-haven assets like gold.
Non-Farm Payroll (NFP) Report: Vital US labour market data, capable of triggering substantial movements in both the USD and gold.
Therefore, be prepared for potential market shocks and exercise careful risk management.
📈 Trading Strategy & Considerations
Given the technical setup and upcoming macroeconomic events, consider the following:
Potential Corrective Uptrend: The invalidated bearish structure on M15 and the strong H1 candle suggest a short-term bullish bias for a corrective move.
Daily Flag Pattern: Monitor price action as it approaches the end of the flag pattern on the Daily timeframe for medium-term trend confirmation.
High Volatility Ahead: Exercise extreme caution around the FOMC and NFP announcements. These events can lead to significant and rapid price swings.
Risk Management: Prioritise strict risk management. Consider reducing position sizes or employing wider stop-losses during high-impact news events.
Disclaimer: This analysis is for informational purposes only and does not constitute financial advice. Trading involves significant risk, and you should only trade with capital you can afford to lose.
Dailytrading

Remains Below 1.3700 Ahead of CPI Data from the US and CADUSD/CAD Remains Below 1.3700 Ahead of CPI Data from the US and Canada
USD/CAD continues to decline ahead of inflation data from both the US and Canada.
The US inflation rate is expected to rise to 2.7% year-over-year in June, up from 2.4% recorded in May.
Meanwhile, Canada’s CPI is forecasted to increase by 1.9% year-over-year in June, up from 1.7% in May.
USD/CAD is trading around 1.3690 during the European session on Tuesday, following two days of gains. The pair is declining as the US dollar (USD) continues to weaken ahead of the June CPI data from the US. The inflation figures will provide new insights into the Federal Reserve's (Fed) monetary outlook.
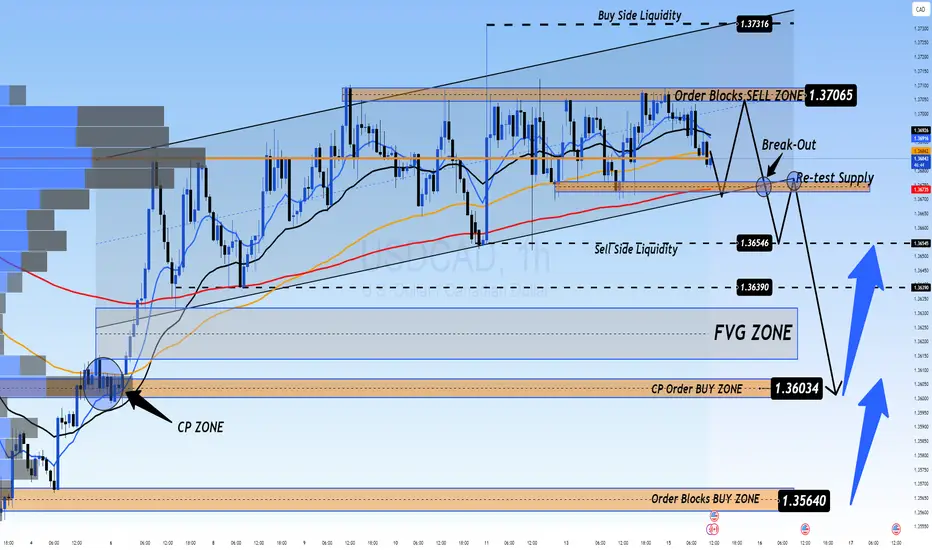
📉 Market Outlook for USD/CAD – Possible Drop on CPI Release
The USDCAD is still in a downtrend, and a sharp drop could occur with today’s CPI data release. Currently, there are two Buy Side Liquidity zones above and Sell Side Liquidity below, with the price balanced around the VPOC zone, which will soon decide the direction after the CPI announcement today.
Market liquidity still holds a FVG below, and with CPI data expected to favor USD, this could trigger a sharp drop towards this liquidity zone, possibly nearing CP OBS at 1.3600, followed by a potential rebound.
If price breaks CP zone, it may head toward a strong OB zone near 1.35xxx. Therefore, caution is advised when monitoring these OB zones.
🎯 Trading Strategy for Today
🟢 BUY ZONE: 1.36000
SL: 1.35500
TP: 1.36500 → 1.37000 → 1.37500 → ????
💬 What are your thoughts on USD/CAD ahead of the CPI data release? Do you expect a strong bounce or a continued decline? Share your views and join the conversation below!
👉 Follow for more updates and insights, and join the community to discuss real-time market moves!
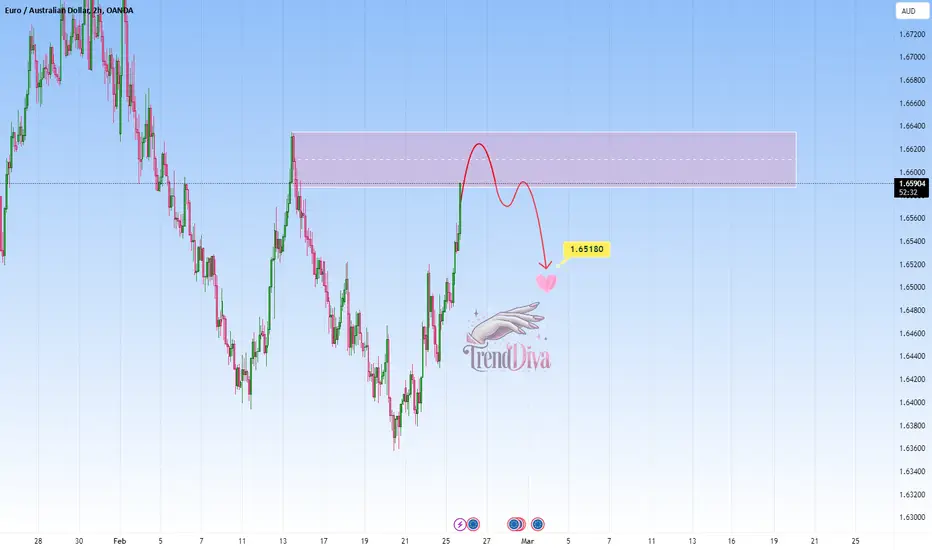
EURAUD - Short Setup at Key ResistanceOANDA:EURAUD is approaching a significant resistance area that has before reversed bullish trends. The current upward move into this zone suggests potential selling opportunities if rejection signals appear, such as bearish engulfing candles or upper wicks.
I find that a move toward 1.65180 is likely.
A break above this resistance, however, could indicate a shift in market sentiment.
Just my take on support and resistance zones—not financial advice.
Always confirm your setups and trade with solid risk management.
XAUUSD CONFIRM 100 PIPS MOVE IS HERE🚨 Attention Traders! 🚨
🟡 Gold is in a no-trade zone! 🛑 Stay patient as we monitor key levels.
📊 Critical Zone: 2919 - 2945 (Support & Resistance)
🔻 Bearish Breakout? If the price drops below 2919, we’ll target:
🎯 TP1 = 2909
🔺 Bullish Breakout? A move above 2945 signals upward momentum:
🎯 TP1 = 2955
🔥 Stay sharp & trade wisely! 💰📈

DE30 Strengthens Within Ascending Channel, next at 652.00?DJ:DE30 remains within a well-defined ascending channel, with price recently rebounding from a key support level. This suggests a continuation of the uptrend, with the next target near 652.00, aligning with the upper boundary of the channel.
A short-term pullback could present a buying opportunity, particularly if bullish candlestick patterns like an engulfing or hammer formation emerge, confirming buyer strength. A decisive move above recent highs could reinforce momentum toward the expected target.
But if we get a break below the channel’s lower boundary, it would invalidate the bullish outlook and signal a potential shift in market direction.

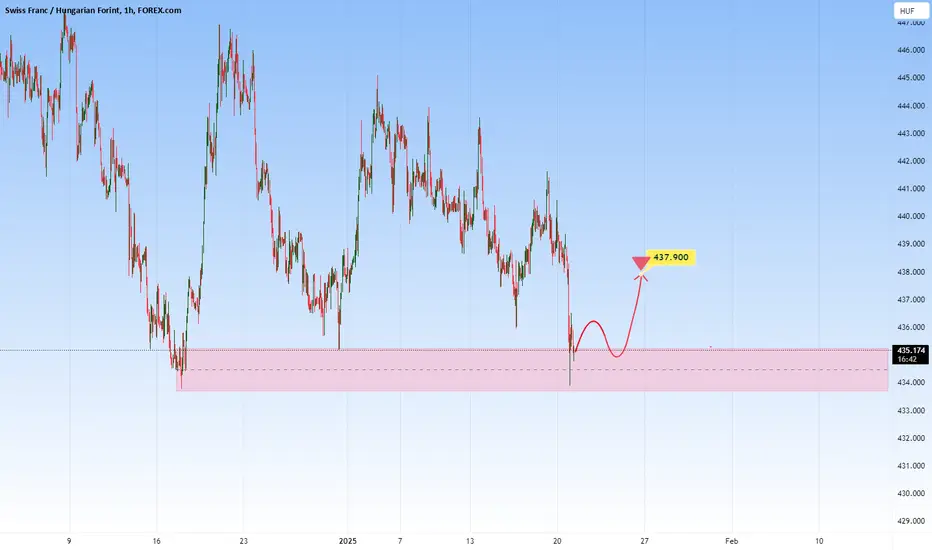
CHFHUF At Key Support Zone, can it bounce to 437.900?FOREXCOM:CHFHUF is currently testing a major support area that has previously served as a strong base for bullish reversals. It could become a great potential buying opportunity if buyers confirm control.
I think an upward move toward 437.900 is very plausible. If the support fails to hold, however, further downside might happen.
Be sure to wait for clear confirmation of buyer strength before taking long positions.
Sensex Support and Resistance Levels for Better Trading DecisiI’ve created a chart highlighting the key support and resistance levels for Sensex, designed to help traders make informed decisions.
These levels provide critical insights for understanding potential price movements, enabling traders to identify ideal entry and exit points.
Use these levels to gain a clearer perspective on Sensex trends and optimize your trades with greater confidence.
Remember, these levels serve as guidance, so always combine them with your own analysis and risk management.

Bullish End of Year?This chart shows the price development of Alphabet (Google). Since reaching its high in July, the stock has been in a downward correction. However, it now appears that this correction may be ending. The price has formed a higher low, which could serve as the right shoulder in an inverse Head & Shoulders pattern.
Additionally, the SMAs are bullishly aligned once again. If the price breaks above the 38.2% Fibonacci level, I anticipate a bullish move toward the end of the year.

**JSWSTEEL HIGH VOLUME BREAKOUT**Disclaimer: I am Not SEBI Registered adviser, please take advise from your financial adviser before investing in any stocks. Idea here shared is for education purpose only.
22.09.2024 Swing trade
Buy- CPM
Target- 1023,1091,1160,+++
Stop Loss-910
#papertrade #learningonly #Swing trade
1.Breakout- All time high break out
2.Volume- all time high break with good volume
3. RSI-Bullish
4. Chart Pattern- moving forword with trend line.
News:- India's JSW Steel rises on Macquarie rating upgrade
India metal stocks up on demand revival hopes; Macquarie upgrades PT on five cos

Market bulls take restAfter a spectacular rally last week market bulls are taking a pause. Last two days look quite bearish on the daily chart but if we look at lower timeframes we won't see any signs of strong selling. Price is drifting down very slowly as a result of profit taking and low initiative from buyers.
The high level context is still very bullish: we're in an uptrend, market made new high, retracement <30%, there is an unfilled gap from last week.
There will be some volatility as new economic data released, but at this moment my bias is 100% bullish
Disclaimer
I don't give trading or investing advices, just sharing my thoughts

Weekly analysis of gold with my personal st based on the WMPUsing the data we get from the gold weekly chart and my special calculation program, we identify these waypoints as key gold points and based on that we can enter long and short positions. In this method, stoploss setting is based on your personal money management and is flexible, but the most logical stop is between 20 and 35 pips from the entry point on the drawing lines.
Every week we will recalculate and send you the lines and we hope to get between 200 and 500 pips of profit with this strategy.
Until further notice, this program will be run for free and after you believe in our method, the supplementary strategy along with the calculation program will be available for sale . and for those people who are not interested in calculation and training in the coming weeks of the channel, We will have a daily trading signal on gold.

CAD/JPY EXPECT BULL SOONFirst, if you found this helpful please like and leave a comment in the comment section for more discussion, and don't also forget to follow for more updates
Let us traders watch out for this pair this coming week. If the price brake to the upside that means I m on point and the price is facing WAVE C to complete the zigzag correction.
Goodluck

GBPUSD swing / day SHORTIf price breaks under key level shown eve ready for a plummet hundred of pips like previous trend shows

Breakout of US Dollar Index We can see a breakout of the resistance (Fibonacci level) Upcoming downtrend for US Indices & Gold is loading

Gold bearish trend is ready againFrom my last analysis, we manage to catch the $55 Movement with risk reward 1:3. Now we will apply the same risk-reward ratio. Based on the Fibonacci & Ichimoku cloud we can clearly see the resistance level at $1660. Don't miss another golden opportunity. Share the idea with all your friends!

Nasdaq is going down again!After my first Nasdaq idea, we achieved 1000 points movement, now we have another entry to benefit from, based on the latest hawkish USDX analysis, I expect this to happen once the US market opens.

VIJAYA DIAGNOSTIC CEN LTD Cup and Handle Pattern Formation*VIJAYA DIAGNOSTIC CEN LTD*
Time Frame: Daily
Observation:
* Cup and Handle Pattern Formation
* Swing High Break
Resistance/Target: 511 559 601 540 672
Support: 395 351 302

BTC HERE IS THE BOTTOM?last time i mentioned that somewhere around here can be bottom. Today i found another argument that is confirming that I actualy am right. If you want too see more arguments i am posting here link to the my long term prediction idea on trading wiev,

Daily analysis & day trading setups - DAX DAX40 DE30EUR 20220830Happy Tuesday,
Unless DAX regains 13k and breaks above 13 100, it can still go either way. Bears do want to break yesterday's low and create LL.
Line in the sand is 12 850
Macro EU Business Climate, Consumer Confidence, HICP, US Housing Price Index, Consumer Confidence, Fed's Williams Speech
Buy
Break: 12 940, 990, 13 060, 085
Reversal: 12 890, 825, 735, 700, 675
Sell
Break: 12 905, 850, 795, 750, 700
Reversal: 13 010, 095, 130, 215
I regularly publish my daily analysis & trading plan for day trading setups. The links are here:
NASDAQ
DAX
SPX
Green Goblin levels are here >>>
Fibonacci Confluence levels are here >>>

DONT PANIC WITH THIS BTC CRASHBTC has crashed pretty much in last few days but for me its just clearance of the long postions. BTC will retreace into 23k zone soon. Sentiment turned bearish last time and people are shorting right now soo it is good setup for liquidation of the short positions. also as we look into 1min chart we can see huge sells in 1min candles wchich are confirmation that market is now unhealthy and under controll of big players.

BTC idea for today. 04.08.2022BTC went exactly as i planned yesterday. after a small breakout of ichimoku cloud it went into consolidation and then droped. For today i see scenario as it was 2 weeks ago. It will small rally to catch people into longs and then fast drop to around 22 000 where is good place to long. from there possible is 28k-31k if nothing bad on news will happen.

BTC IDEA FOR TODAY 03.08.2022Hello as in my last ideas when i predicted downside to zone around 22600 and then rally , now i see signals for short term chop to liquidate over laverage players. in my opinion good enter for short will be zone around 22500
In my opinion BTC will fakeout from ichimoku cloud to get some stoploses on badly placed shorts and continue to go down as predicted.

BITCOIN Day TradingBITCOIN Day Trading. BITCOIN Day Trading. BITCOIN Day Trading.
BITCOIN'll break resistance line (red line).
Be aghideye bandeh, bitcoin ba shekastane saghfe roozaaneh (khatte ghermez rang), roshd khaahad daasht.
