Quantum Computing - Why BTC isn't the biggest worryYou’ve probably heard that quantum computing could break Bitcoin’s encryption—and that’s true. But here’s the thing: Bitcoin might not even be the biggest target.
The real risks? Financial systems, national security, healthcare, and even the internet itself. These areas rely on the same encryption methods that quantum computers could crack, and the fallout could be far worse than a Bitcoin hack.
Let’s break it down.
1️⃣ Financial Systems: A Global Crisis Waiting to Happen
Imagine if hackers could:
Drain bank accounts at will.
Manipulate stock markets.
Fake trillion-dollar transactions.
This isn’t just about stolen crypto—it’s about economic chaos. Banks, stock exchanges, and payment systems all depend on encryption. If quantum computers break it, we’re looking at a meltdown way bigger than Bitcoin’s $3 trillion market.
2️⃣ National Security & Internet Privacy: A Hacker’s Dream
Governments and militaries use encryption to:
Protect classified intelligence.
Secure communications between leaders.
Guard critical infrastructure (power grids, water supplies).
If quantum computers crack these codes, entire nations could be exposed to cyberwarfare. Your private data? At risk too—email, messaging, even your online banking could be decrypted years later.
3️⃣ Healthcare, Supply Chains & IoT: The Hidden Vulnerabilities
Medical records could be leaked, exposing sensitive health data.
Smart devices (like home security systems) could be hacked.
Supply chains might collapse if logistics networks are breached.
These systems weren’t built with quantum threats in mind—and upgrading them won’t be easy.
🔴 The Bigger Picture: A "Civilizational Upgrade"
Switching to quantum-resistant encryption is like rebuilding the internet’s foundation. It’s necessary, but messy. Some experts compare it to the Y2K bug—but way harder.
🔷 So, Is Bitcoin Safe?
Not entirely—about 25% of all Bitcoin could be stolen if quantum computers advance fast enough. But compared to the risks facing banks, governments, and hospitals? Bitcoin might be the least of our worries.
🔷 What’s Next?
Governments & companies are already working on fixes (like NIST’s post-quantum cryptography standards).
The transition will take years—and hackers might exploit weak spots along the way.
Staying informed is key. If you’re in tech, finance, or security, this affects you.
ℹ️ Want to Dive Deeper?
Deloitte’s take on quantum computing & Bitcoin
Forbes on quantum risks beyond crypto
🤷♂️ Bottom line?
Quantum computing is coming—and while Bitcoin has risks, the real danger lies in the systems we all depend on every day.
❔What do you think? Will we be ready in time? Let me know in the comments! 🚀
Danger

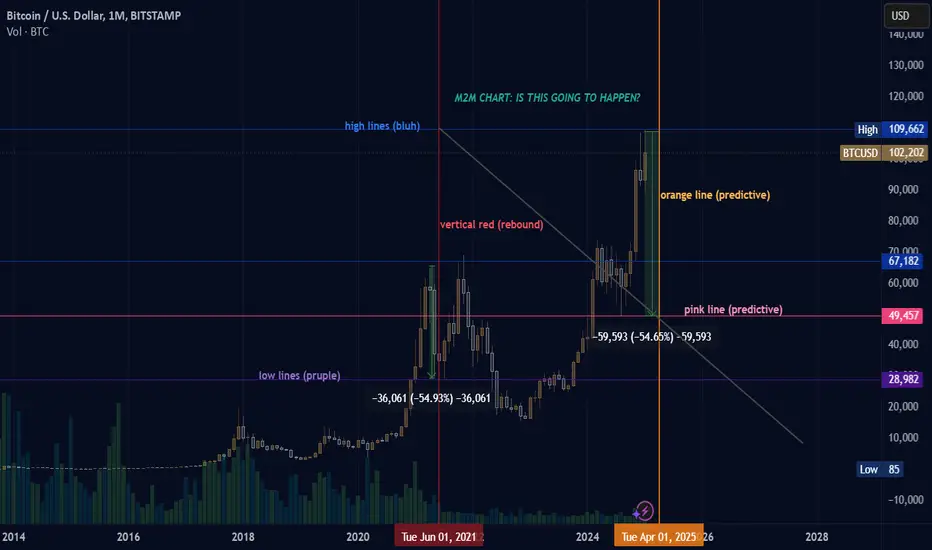
(BTC) bitcoin "predictive, not advice"A drawing on the chart of BTC using the Month scale imagining the possibility of total destruction to the entire sector of cryptocurrency based on Bitcoin losing -50% in the coming 90days, only to rebound and regain the status of ATH prices.
⚠️ Altcoins at Critical Resistance 📉 Time to Tread Carefully 🚨Hey traders! Professor here 👋. Today, let's talk about something crucial: the 'Total 3' chart, which looks at the entire altcoin market minus Bitcoin and Ethereum. 📈
Right now, we're at a significant resistance level on the 8-hour chart. 🛑 No breakout yet, making it risky to jump in. We might see some downside before going up, so keep an eye on the $335B and $319B levels. 🎯
Bottom line: I'm staying cautious with alts for now and leaning more towards Bitcoin. Let's be smart and keep our eyes peeled. 👀
Comments and thoughts are welcome! Let's discuss! 🗨️"
PS. We buy BIG if we see a breakout over the channel!!!!!
One Love,
The FXPROFESSOR 💙

Kukoin! - Next Possible Fold? Kukoin! - Next Possible Fold? Kukoin! - Next Possible Fold? Kukoin! - Next Possible Fold? Kukoin! - Next Possible Fold? Kukoin! - Next Possible Fold? Kukoin! - Next Possible Fold?

Best analysis of AdaThe best analysis in the world from Cardano
As you can see, Ada broke an important level in the weekly time frame and is suffering at a price of 50 cents to 40 cents. And this is a logical analysis.
When I look at the prices before 2021, I see a drop that has reached almost 96%.
Now I think history will repeat itself and Cardano will fall to 12 cents. It has also broken the most important weekly line MA 200.
And then it will go up to 10 to 20 dollars.
The rsi indicator tells the same story.

🌊 BTC rally fakeout 🌊Btc will increase in price according to various forecasts, but not to continue rising towards new highs, both on the daily and weekly charts we are still in a clear downward trend.
For me new institutions are still missing, and the number of weak hands has decreased, in this way the whales plan to raise the price to create FOMO and attract new investors, and then fall into the hands of the cruel market. We are still on a weekly bounce and institutions will want to buy at lower prices, and the price of Btc for me will go down at any moment, whether it be Russia, China, NATO or some environmental crap.
Be patient and practice shorting a little in the 46k - 48k - 49k
Always DCA gentlemen and do not go overboard with the leverage

BTC on life support.. AGAINAfter the 69k rejection many were still bullish. But down trend has been shown and formed after the rejection. We meet 40k once again and may face another down fall if this support fails.

S&P 500 Enter the Bear CaveI hate to ring the bells, but S&P options and VIX structure is not looking so healthy.
I'm starting to pick up some twitter feeds on Harmonic Elliot Waves.
The CastAwayTrader has some very interesting patterns to follow.
CastAwayTrader points out that closing below the 21 Weekly EMA (Exponential Moving Average) is an important indication of transition into a BEAR market.
Hold on to your butts.

S&P500 Danger Zone - Jan 2022This fractal seems remarkably similar in structure to S&P price action in recent years. Should it continue to follow, we should see the top come in in January 2022 - suggesting one last blow-off top for stocks in Q4 of 2021.


BTC IN CONSOLADITION, BAD NEWSSorry guys situation is bad, There is Consolidation and time to crash
We have support in 34.800. May be Btc is going to bounce from this Support
I am in Usdt. My enter level is 30.000s, I am waiting to this level
Thanks for your attention. You can ask everything I am waiting to you
Please click like button and Appreciate my hard work.
Must follow me for latest crypto real time updates.

BTCUSD IS IN VERY DANGEROUS AREABtcusd is in very important area.
If Btc will break up and do re-test to red resistance with big volume , We can see 47.000. This is good scenario.
There is flag formation;
Also ıf Btc will reject to red resistance, We are entering supper bearish season.
For Now?
Now I Usdt since 36.000-37.000. And I am waiting result; Up Re-Test or Reject Resistance? Wait and see..
Thanks for your attention. You can ask everything, I am waiting.
Please click like button and Appreciate my hard work.
Must follow me for latest crypto real time updates.

DANGER DANGER HIGH VOLTAGEWith a track record dating back to '09, anytime more than 94% of companies in the S&P trade above their 200-day MA, there is an ensuing sell-off. This doesn't indicate an extreme sell-off but rather a cooling of the coals that have become too hot. But still, look out below. When the VIX goes so low and this indicator goes so high, it is a red flashing signal to put on some protection so you don't lose your hard-earned gains.

ChainlinkChainlink formed an M pattern, if he will not break the resistance of 16$ it might fall to support resistance at 13$ or more. Keep an eye on it.

Exit AMCAMC is Bloody mess right now. Also current news on AMC needing shares bought or will have to file bankruptcy is not looking good.
When I see AMC situation I remember HTZ* and GNC*.
Beware traders. Don't lose your shirts.
*Indicators used*
-Zig Zag
-Pivots
-Vol
-MACD
-Super Trend V1.0

BITCOIN: Gamblers may suffer.The chart shows a powerful sharp switch in sentiment - which is rare on the 8H time frame. Clearly sentiment has been dented. I see small gamblers jumping in, buying the dip.
Sure - on smaller time frames they may make a few bucks. However, at the moment I think they risk transferring money out of their pockets - on the probabilities shown on this time frame (only).
Price is struggling around 50% or 61.8% fib on this time frame. The remaining big investors could be lurking in a kill zone for a big sell off - I can't be certain.
I don't get a good feeling going long on BTC at this time. I'm happy to miss out - I would have lost nothing! 👍👌 Losing nothing in trading is actually winning!
Disclaimers : This is not advice or encouragement to trade securities. Chart positions shown are not suggestions. No predictions and no guarantees supplied or implied. Heavy losses can be expected. Any previous advantageous performance shown in other scenarios, is not indicative of future performance. If you make decisions based on opinion expressed here or on my profile and you lose your money, kindly sue yourself.

Apple - Dire WARNING - DANGER ZONEThis post addresses basic cycle theory. Parabolic curves and parabolic trends.
Yesterday the world laughed at Bitcoin and said that it was a BUBBLE and a PONZI scheme.
Today the whole world is in a bubble and the entire financial world is a ponzi scheme. Ironically we only need to look at examples of yesterday (Bitcoin) to understand how this is going to play out.
In this chart I simply analyse a very clean cut, tidy looking and VERY obvious parabolic trend. I cannot tell you when this is going to happen, or how far up this is going to run because that would be attempting to "time the market", as everyone knows this is a fools errand. But what i can allude to is that which is VERY likely going to be the outcome.
Anyone looking to play leveraged trade positions up here.......... is akin to a game of Russian-roulette with 5 chambers loaded.
Please scroll down for accompanying information and examples.
Please feel free to share your own examples of similar Parabolic trends and their outcomes. The community would love to collate this kind of information in one place.
Happy trading, stay safe. Don't be over exposed.

Can VIX go Negative like WTI futures ?Hope this idea will inspire some of you !
Don't forget to hit the like/follow button if you feel like this post deserves it ;)
That's the best way to support me and help pushing this content to other users.
Kindly,
Phil

The scariest chart I have ever publishedWhile seeing the top in SPX500 in coming years, I looked into RTSI (Russian Index). What I saw sent shivers up my spine. I do not know what will happen in 2024-2030, but this certainly does not look good.

Either the bulls kill him or they are gonna be f'ed! One very brave(very slow?) bear has entered the bunker with a TNT onboard.
Kill this furry animal quick, or there's gonna be not enough coffins for the bulls!!!
If it lives - 7100 is our next hope.
If price goes lower 7100 - gonna wait a few days for the new bullish attack)
Someone is selling who bought at 6500'''.
Probably will sell the whole night, waiting every time for the price to bounce south.
Some bear this is...

POP!! IT'S COMING!What people want me to do is tell them when the bubble is gonna pop!
Well, well - I can see the weather outside my home is setting up pretty badly, but I can't tell when a downpour of rain is gonna come! I'm as I'm so bad at weather forecasting - how on earth could I possibly forecast market crashes?
All I know is that when I see bad weather I'd better wear a raincoat or carry and umbrella - or alternatively don't venture outside! Is that okayyyyy? :) :)

2019: Long-Term Bonds > Stocks... Why?TLT has outperformed SPX by roughly 6% at time of writing. Many factors: FED cushioning rates, yield chasing by entities in negative-yield countries, fears of global slowdown, escalating trade war, and the perceived invincibility of U.S. markets.
There could be a seriously nasty rate spike within the next 2 years. As yields drop there is less incentive for entities to invest in bonds... if yields drop below the purported rate of inflation, which they already have (1.48% US10Y vs 1.6% PCE), there is no longer an incentive to hold them, as they produce negative returns. The deeper yields fall below inflation, or the higher inflation rises above yields, the stronger the momentum of a selloff. Will it happen? Free market forces would say yes, but considering the FED can print anything into a rainbow, the span and severity of such a spike is indeterminate... chances are that it will be uncontrollable for enough time to do some damage before the right players come to consensus on how to backstop it.
Long term we all know where this leads - negative rates for everyone, yay! A serious spike in yields should be seen as a patient opportunity. When the time is right, trade /TN, TLT options or whatever bond instrument you prefer.

BTC - Cliffhanger Part II***IF*** the daily closes below 11690, we could expect two big nasty daily candles before the close of the week and BTC could slip down to 9.3k - 9.5k!!! Be safe out there!!!
KRAKEN:XBTUSD
