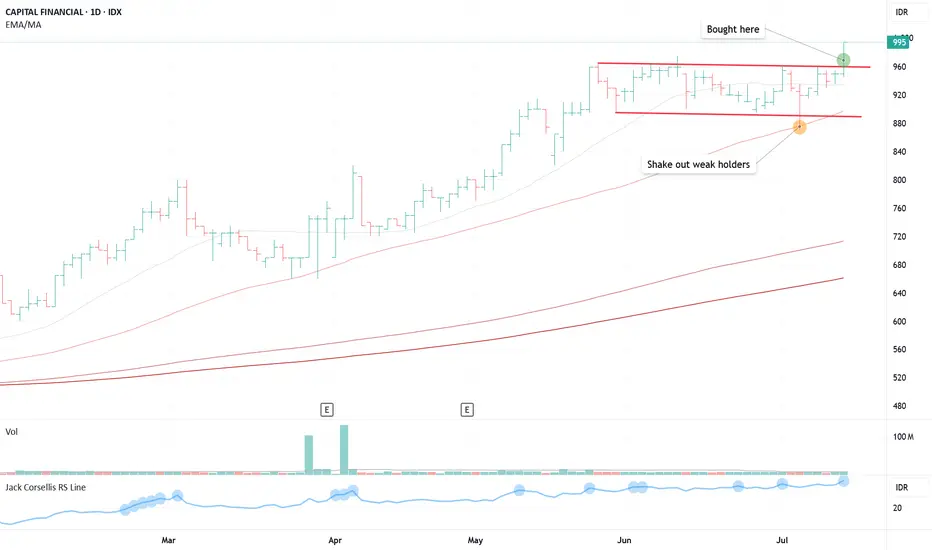
CASA - FLAT BASEPosition update: July 10, 2025.
Key factors:
1. Confirmed stage 2 uptrend.
2. A textbook Flat Base with a clear, low-risk entry.
3. The base has VCP characteristics.
4. The stock moves on its own drummer, hitting an all-time high while the index struggles to reclaim its highs.
5. A shakeout that weed out weak holders has strengthen the setup properly.
6. Volume has dried up, indicating less supply coming to the market.
7. Strong fundamentals, with consistent increased in year-over-year earnings growth.
Consideration: The breakout was not accompanied by a significant volume surge.
This is a classic Flat formation or Darvas Box Theory with a clear pivot entry and minimal risk. I’m starting to see increased traction in my personal trades—a very positive sign to trade larger in this market environment.
Darvasbox
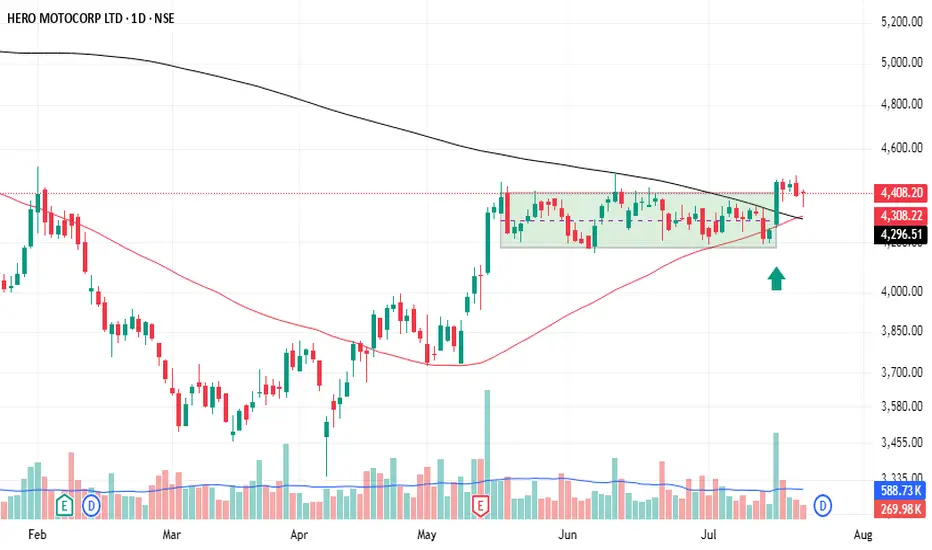
Hero Moto Co - Darvas Box Breakout - No AdviceHero Motocorp's stock has shown period of consolidation, forming potential Darvas Box. A breakout above the box on 15 th july. Price movement was also accompanied by increased volume and then followed by golden cross over - showing a good opportunity to long. Warning - Investing in the stock market involves risks. It's essential to conduct thorough research, set clear goals, and consider multiple perspectives before making investment decisions.
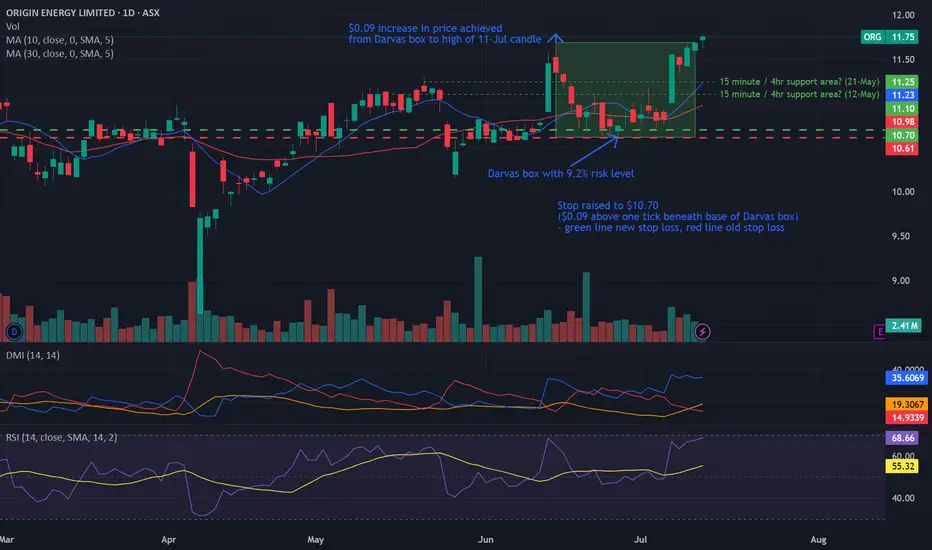
Bullish potential detected for ORGEntry conditions:
(i) breach of the upper confines of the Darvas box formation for ASX:ORG
- i.e.: above high of $11.69 of 16th June (most conservative entry), and
(ii) swing up of indicators such as DMI/RSI.
Stop loss for the trade (based upon the Darvas box formation) would be:
(i) below the support level from the low of 26th June (i.e.: below $10.62).
Bearish potential detected for AGLEntry conditions:
(i) breach of the lower confines of the Darvas box formation for ASX:AGL
- i.e.: below low of $9.84 of 7th April, and
(ii) swing increased bearishness of indicators such as DMI/RSI along with a test of prior level of support of $10.02 from 11th March.
Stop loss for the trade (based upon the Darvas box formation) would be:
(i) above the high of 10th April (i.e.: above $10.89), or
(ii) above the prior support level from the open of 10th January (i.e.: above $11.15), depending on risk tolerance.

Bullish potential detected for HDNEntry conditions:
(i) breach of the upper confines of the Darvas box formation for ASX:HDN
- i.e.: above high of $1.31 of 9th May (most conservative entry), and
(ii) swing up of indicators such as DMI/RSI along with a test of prior level of resistance of $1.31 from 31st October 2022.
Stop loss for the trade (based upon the Darvas box formation) would be:
(i) below the support level from the low of 15th May (i.e.: below $1.24).

Bullish potential detected for QUBEntry conditions:
(i) breach of the upper confines of the Darvas box formation for ASX:QUB
- i.e.: above high of $4.04 of 28th November (most conservative entry), or
(ii) swing up of indicators such as DMI/RSI along with a test of prior level of $4.00 from 25th November.
Stop loss for the trade (based upon the Darvas box formation) would be:
(i) below the support level from the low of 13th December (i.e.: below $3.80).

Bullish potential detected for SDREntry conditions:
(i) breach of the upper confines of the Darvas box formation for ASX:SDR - i.e.: above high of $6.91 of 17th October (most conservative entry), or
(ii) swing up of indicators such as DMI/RSI along with a test of prior level of $6.84 from 18th October.
Stop loss for the trade (based upon the Darvas box formation) would be:
(i) below the support level from the low of 24th October (i.e.: below $6.36).

Multi-Month Consolidation Breakout OpportunityA Multi Month Breakout Opportunity building up in NSE:GREENPANEL
Entry: 415
Target - 520
SL1: Super Trend (10,3)
SL2: Relative Strength(21) < 0

Bullish potential detected for RZIEntry conditions:
(i) breach of the upper confines of the Darvas box formation for ASX:RZI - i.e.: above high of $0.45 of 11th September (most conservative entry), or
(ii) swing up of indicators such as DMI/RSI along with a test of prior level of $0.425 from 9th September.
Stop loss for the trade (based upon the Darvas box formation) would be:
(i) below the support level from the low of 24th September (i.e.: below $0.405).

Bullish potential detected for SGPEntry conditions:
(i) breach of the upper confines of the Darvas box formation for ASX:SGP - i.e.: above high of $5.10 of 27th August (most conservative entry), or
(ii) swing up of indicators such as DMI/RSI along with a test of prior level of $5.05 from 27th August.
Stop loss for the trade (based upon the Darvas box formation) would be:
(i) below the support level from the low of 28th August (i.e.: below $4.92).

Pidilite Ready for All Time High...NSE:PIDILITIND trade at 3170 level. You can watch for next at 3600 after breakout.

Ready for DARVAS BOX Breakout...NSE:CEATLTD trade at 2845. Support @ 2500 Resistence @ 3000
on the weekly chart made a DARVAS BOX Pattern, after its breakout you can watch for next resistence @ 4000

CLEAN - LONG CONSOLIDATION AND BREAKOUTCLEAN trying to break Multi Month Consolidation.
Enter Above Recent High with SL below 55 MA

IDBI52 Week High Breakout.
Box Pattern .
Huge Volumes.
Accumulation Done.
Above all key EMA.
Good for Short Term.
Do Like ,Comment , Follow for regular Updates...
Keep Learning ,Keep Earning...
Disclaimer : This is not a Buy or Sell recommendation. I am not SEBI Registered. Please consult your financial advisor before making any investments . This is for Educational purpose only.

Reliance Industries: Could be great momentum trade!!Reliance recently raised its mobile tariff. So the stock is in news.
Stock was trading in a range (rectangle pattern, darvas box, accumulation stage.
After the announcement of the tariff hike by the company, its stock price broke out from the range.
This breakout could be the continuation of the uptrend of the stock, and in coming days we have see further rise in the stock price of reliance.
Pattern gets invalidated if it breaks down from the range.

HINDCOPPER Swing LONGFor educational purposes only
Enter a long position when the price closes above 402. Set the stop loss at 354.9.
This is not a buy/sell recommendation.

FORTIS Swing long For educational purposes only
Enter a long position when the price closes above 471. Set the stop loss at 433.90.
This is not a buy/sell recommendation.

Bullish potential detected for WFCNYSE:WFC represents a potential bullish opportunity should momentum continue and newer highs be made.
Entry condition:
(i) breach of the upper confines of the Darvas box formation - i.e.: above high of $61.76 of 23rd April.
Stop loss for the trade (based upon the Darvas box formation) would be:
(i) below the support level from the low of 3rd May (i.e.: below $59.12) - most conservative exit, or
(ii) below congestion area composed of volume profile zone and rising 10 day moving average (i.e.: below $60 area).

SUDARSCHEM - Swing Long#Educational purpose only
Take long entry once closes above 766.5 stoploss 707.75
#Follow strict stoploss


Unboxing Profits: A Modern Twist on Darvas's Strategy with VWMAIn the mid-20th century, Nicolas Darvas turned a modest investment into millions, all while traveling the world as a professional dancer. His secret? The Darvas Box Theory—a trading method that identifies stocks exhibiting strong upward momentum confirmed by increasing volume. Fast forward to today's digital trading world, and we find that Darvas's principles are still relevant, but they're now supercharged with advanced indicators like the Volume Weighted Moving Average (VWMA).
Reviving a Classic with Modern Tools
Our "Darvas Box Strategy with Visual Signals" leverages the simplicity of Darvas's boxes and pairs it with the insights of a VWMA. This strategy script for TradingView is designed to illuminate clear buy and sell signals on your chart, providing you with a compelling visual cue that marries price action with volume.
The Anatomy of the Strategy
At its core, the strategy is built on two primary components:
Darvas Boxes:
These are virtual 'boxes' that capture the 'high' and 'low' of a stock within a specified period. As per Darvas's original concept, a new box is formed when the stock hits a new high. The top and bottom of these boxes serve as the resistance and support levels.
VWMA:
The VWMA provides more than just an average price level—it integrates volume into the mix, offering a weighted average price based on the amount of activity. This gives traders a sense of whether the price movement is supported by the market's conviction.
Bringing the Strategy to Life
Using the script, traders can set their preferred 'Length' for the Darvas Boxes and 'VWMA Length' to tune the strategy to their trading style. The strategy plots:
VWMA Line: A smooth purple line that trails the price, adjusting with the volume flow.
Darvas Boxes: Visualized by green circles for the tops (resistance) and red circles for the bottoms (support).
Signal Flares for Entry and Exit
What sets this script apart is its ability to provide distinct 'Buy' and 'Sell' signals:
Buy: When the price ascends past the bottom of a Darvas Box and stands above the VWMA, it's an indication of potential upward momentum.
Sell: Conversely, a dip below the top or bottom of the box suggests a possible change in tide, prompting an exit signal.
Custom Alerts for Timely Execution
Recognizing the right moment to enter or exit a trade is crucial. Therefore, our strategy includes built-in alert conditions, ready to notify you of emerging opportunities as they happen.
In Summary
This Darvas Box Strategy with Visual Signals is more than just a nod to a bygone era of trading—it's a dynamic tool that integrates historical wisdom with contemporary analysis, aimed at helping modern traders navigate the markets with greater clarity and confidence.
Remember, while this strategy offers a strong foundation, it's vital to engage it within a broader trading system that accounts for your risk tolerance and market conditions. May your trades be as graceful and deliberate as a dancer's steps, much like Nicolas Darvas himself.

NYKAA can be TURNAROUND STOCKCMP 152
SL 136
TARGET 190
Consolidating in range 120 -154....will be box breakout above 154
also formation of higher lows and after falling from 151...so range getting compressed and small...also ascending triangle pattern visible ....therfore can be good risk reward ratio here..
keep quantity small and increase after 154 breakout...

Combined script of MavilimW and DARVAS BOXBuy Signals:
MAVW Buy Signal: This signal is generated when the MAVW crosses above its previous value. You can use this as a bullish confirmation.
Darvas Box Buy Signal: The Darvas Box doesn't have a specific buy condition defined in your code, so you might want to add one. Typically, traders look for price breaking out above the upper boundary of a Darvas Box as a potential buy signal.
Sell Signals:
MAVW Sell Signal: This signal is generated when the MAVW crosses below its previous value. You can use this as a bearish confirmation.
Darvas Box Sell Signal: Similar to the buy condition for the Darvas Box, you can define a sell condition based on the price breaking below the lower boundary of a Darvas Box.
To make these signals more actionable, you can consider using a combination of these conditions. For example:
Ideal Buy Points:
Buy when MAVW crosses above its previous value (MAVW Buy Signal) AND the price breaks above the upper boundary of a Darvas Box (Darvas Box Buy Signal).
Ideal Sell Points:
Sell when MAVW crosses below its previous value (MAVW Sell Signal) OR the price breaks below the lower boundary of a Darvas Box (Darvas Box Sell Signal).
Keep in mind that you may need to adjust the parameters and conditions based on the specific financial instrument you are trading and the time frame you are using. Additionally, consider using stop-loss and take-profit levels to manage risk and lock in profits when trading with this strategy. It's also a good practice to backtest the strategy on historical data to evaluate its performance before using it in a live trading environment.
