Dash Price Prediction – Drop Back into the $60 AreaBased on the Bitcoin code and launched in early 2014, Dash was initially known as XCoin and soon renamed to DarkCoin. In its early stages, it was mostly focused on privacy and anonymity, which led to the coin being used heavily for darknet market purchases. It was described as “the first privacy-centric cryptographic currency” by Evan Duffield and Daniel Diaz, the co-authors of the coin’s whitepaper, but is still struggling with popularity.
In more recent years Dash moved away from the privacy-centric model and has become an open source peer-to-peer cryptocurrency focused on the payments industry (just like everybody else). It aims to be money that is portable, fast, anonymous and inexpensive, providing instant transactions (through InstantSend) and private transactions (through PrivateSend). According to the official site, “Dash is Digital Cash you can spend anywhere”.
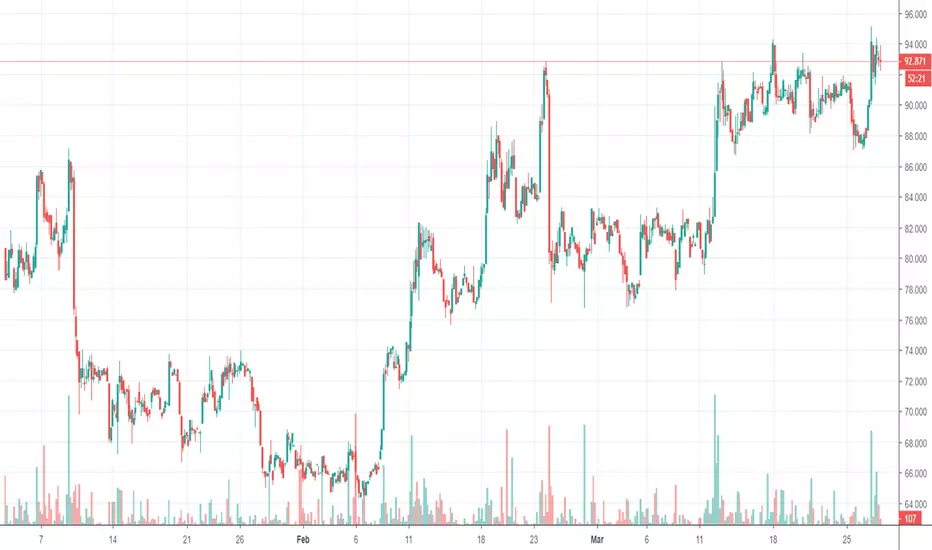
Similar to most other cryptocurrencies, Dash bottomed late last year and is now edging higher. It looks like the token could move higher but that depends on the market. Currently, it is trading at just $92 and is ranked number 15, with a circulating supply valued at $803,052,176.
The lines of the Moving Average Convergence Divergence (MACD) are moving tightly together and the histogram is barely visible which shows very little momentum for bulls or bears. This goes to show that interest for Dash is dwindling and that the coin may be entering an extended period of sideways price action. On the bright side, the MACD lines are crossed bullish and moving slowly upwards which is a sign of recovery. This may be an overly optimistic approach so take it with a grain of salt.
From a daily chart perspective, we can see the pair struggling to break the 100 days Exponential Moving Average and approaching the resistance at $100 (which is both a technical and psychological level). If the bulls can overcome the confluence zone created by 100 EMA and $100, then maybe we will see a stronger climb over the months to come. In my view, $175 is the next target followed by the more important level at $225 (this level acted as support and resistance in the past).
If the resistance zone cannot be broken decisively, we can expect price to drop back into the area around $60 in the coming months and possibly a resumption of the long-term downtrend if $60 support is broken.
Daily Chart Support: $60
Weekly Chart Support: $60 and all-round numbers below it
Daily Chart Resistance: 100 days EMA, $100, $175
Weekly Chart Resistance: $225, 100 weeks EMA, $575 (not expected to be reached in the next 6 months)
Most likely scenario: unless a clear bullish breakout occurs, we can expect downtrend resumption with a break of $60 support
Alternate scenario: a continued period of low volatility, minor upswings due to downtrend exhaustion and overall choppy price action
Dashusd
DASH Price Prediction: DASH to the Top of the Ranks DASH is gearing up for a big move that could see it rise several spots in the market cap rankings. Now sitting at 14th spot it would not take much for this token to gain 4 or 5 spots in the ranks. Currently trading just below the $95 level it is up about 50% since hitting its bottom and looks like it could easily move up to the $120 level in the next few weeks to 3 months. A break above the $95 level would break a strong resistance and a trading range with magnitude near $30. Projecting that $30 puts us near $125 and well above my next target for resistance.


Dashing to MA200*** THIS IS NOT AN ADVICE, DO YOUR RESEARCH AND TRADE WITH YOUR OWN RESPONSIBILITY***
Dash is interesting here.
Symmetrical Triangle breakout, literally text-book.

DASHUSD No long term buy signal yetPattern: Channel Down on 1W.
Signal: Bullish if 105.000 breaks. The last two previous attempts to break those waves failed which resulted into Lower Lows.
Target: 200.000.

Dash looks ready to short.Hello crypto traders
It seems that Dash is ready for a quick short. As you can see, I can count a perfect ABC that retraced 38.2% from the plunge from yesterday. Which basically means that we have to go lower again. In this case, it could be quite severe though. I'm looking for a 10% decline!
I will place my stop at the 161.8% level ($88.4)
Stop: 88.4
Target: <79

Dash ($DASH) - up to 468% PPT! Long term trade.$DASH is one of the top currencies on crypto market.
It has a great community support and great team.
Green - buy. Red - sell.
I do not recommend to use this chart for margin trading.
It's not a financial advice.
Trade carefully and good luck!

DASH Longterm BUY
DASHBTC is situated into a huge falling wedge since 13 november 2017 untill today. At this market stage we need to be patience,so i get some Dash for long term.I don t know when will broke this downtrend BUT it will broke out because a falling wedge is a reversal pattern(from bearish to bullish)
RSI is below 40 on the weekly timeframe which means dash is currently into a bear market from 11 june 2018 untill now.Above 40 RSI weekly timeframe DASH will turn into BULLISH MODE
We have a weekly bullcross at stochastic but with this volume i didn t expect any breakout
Macd is below neutral (0) zone
If you are buy here Dash and you have patience,you can make more then 200% from here. In my opinion the BOTTOM of DASH is NEAR at 0.0150. It s a long term investment!

Dash – Digital Cash With An Emphasis On PrivacyDash was originally launched in early 2014 as a fork of Bitcoin, under the name of Xcoin, and renamed Darkcoin soon after. In its early days, it was allegedly used in darknet markets, mainly due to its focus on privacy, but it has since seen the light. The coin is now on the rise in terms of popularity and one we need to keep an eye on.
In March 2015 the altcoin was renamed Dash and as of August 2016, it is no longer used in any notable darknet market (that we can tell, it's the darknet after all). Dash’s prime goal is to allow instant, private payments online or in-store using their secure open-source platform. To achieve this, its developers instituted a system of Masternodes (proof of stake mining that you can invest in) to simplify and expedite the validation process of transactions.
Dash introduced a self-funding model, which allows for continued development without being dependant on outside influx of capital: the block rewards are split between Masternodes (45% share), Miners AKA lightweight nodes (45%) and Treasury (10%); the latter is used to fund projects and future developments of the network.
DASH/USD Technical Outlook - The Big Picture
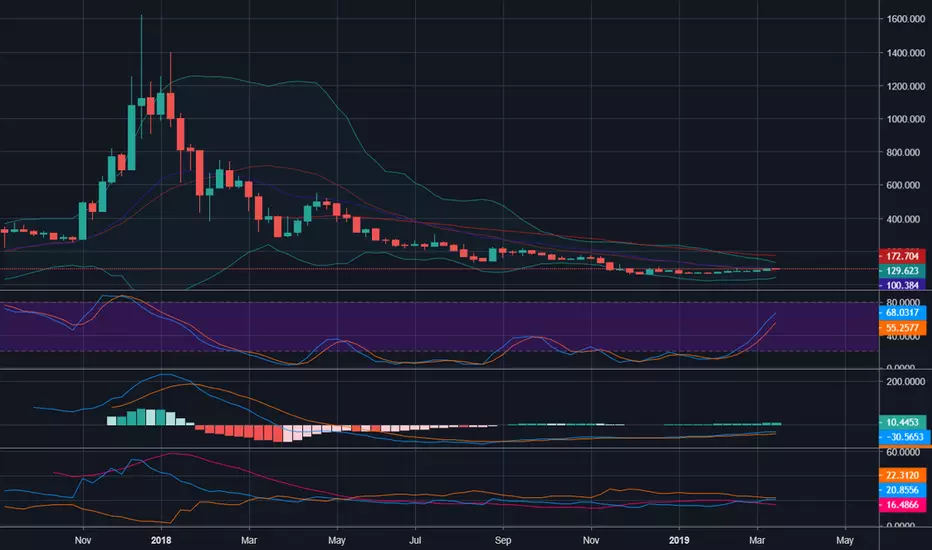
Having reached a high of almost 1,500 against the US Dollar in late December 2017, DASH is currently trading at a mere $72 and has been in a clear downtrend for the entirety of 2018. Its weekly chart looks like the textbook entry for a bearish trend, with lower lows and lower highs printed with each new wave.
Currently the pair is testing the support at 55 – 56, which is a level last touched in early 2017, just before the bull run started. If this support is shattered, we can expect to see extremely low prices, similar to 2016 levels (15 – 20 USD per 1 DASH). It must be noted, however, that the downtrend is starting to fade: the candles are smaller, the dips are not as strong and momentum is fading.
The Daily chart tells the same story as the Weekly, depicting a textbook downtrend but one that is starting to slow down. We have two additional resistance levels on this chart (105 and 175) and both of them will probably hinder any prolonged upside movement if that should develop.
In our view, the only chance of bullish movement will come from the exhaustion of the downtrend because so far nothing points towards a trend reversal; sooner or later price is just going to get so low people can't help but buy it.
As long as the pair is trading below 105, the outlook is bearish, with the possibility of small bumps in price in the form of retracements. A move above 100 – 105 and the Exponential Moving Average will probably make way for additional buying but even if that happens, as long as we don’t see a significantly higher high and higher low, we cannot talk about any type of long term trend reversal.
Daily Chart Support: 55 - 60
Weekly Chart Support: 55 - 60
Daily Chart Resistance: 100 days EMA, horizontal levels: 100, 175, 200, 225
Weekly Chart Resistance: 100 weeks EMA, horizontal levels at 225 and 572
Most likely scenario: continuation of the downtrend, possible low volatility and/or minor upswings due to downtrend exhaustion
Alternate scenario: break above 105, move into 175 during the weeks/months to come

DASH/USDThis market is in an overall downtrend, however, we may see a correction to the upside in the short term, due to the bullish flag pattern inside the descending channel. Not very interesting if you ask me.

Same as verCoin aka Zec, same chart, same setup.Same pseudonymousism.
Long.
Not coz they deserve it, thee #1 marketing coin out there, (A smart man told me 1ce, that if u need 2 market ur coin, yeah, not awesome. )just coz it is unfrtntly in todays markets still a 100 fedShitCoin.
100.
It is what it is.

Price projection for Dash based on 2015 price actionIt is new year and i have nothing better to do while waiting to leave for the party heh.
Not going to go into much detail, but i am just looking at macro level and then comparing 2015 to 2018
Pay attention to FIB numbers for possible good entries or price interests.
The juncture of fractal events in early January is there, so that is good.
Happy New Year !! Welcome to 2019 or the age of 4.. not great, but inserting.
Good luck everyone ;)
**LEGENDS**
BLUE = Bear/Resistance
Yellow = Bull/ Support
~Explore the chart for possible scenarios of price actions - use zoom and scroll for better view.~
/*This information is not a recommendation to buy or sell. It is to be used for educational purposes only.*/
If you want your coin to be analyzed, JUST ask.
If you got a question, ASK away!
And please keep those Stop losses in place!
Fractal dates are moments of interest, where price and time collide to create oscillation - vertical lines!
Thank you,
Ajion

Dash Possible Long Setupi am currently bullish on Crypto Currencies at the moment. Seeing as there has been a lot of movement in the news about certain cryptos i think the rest will all ride the momentum until 1 becomes a victor which i believe will be XRP

DASH: Breakout Coming For BUY !!Buy after Successfully Breakout, if Breakout Fail then don't trade in DASH Coin.
Falling Wedge are Making which is trend reversal pattern.
if Breakout Successfully then we can see Price Move upto 80% Target which wedge Height.
You Can Also set Own Risk reward.
Let see what Will be Next Move.
Warning- I m Not a Financial Advisor this idea Only For Educational Purpose Only.
Thank You !!


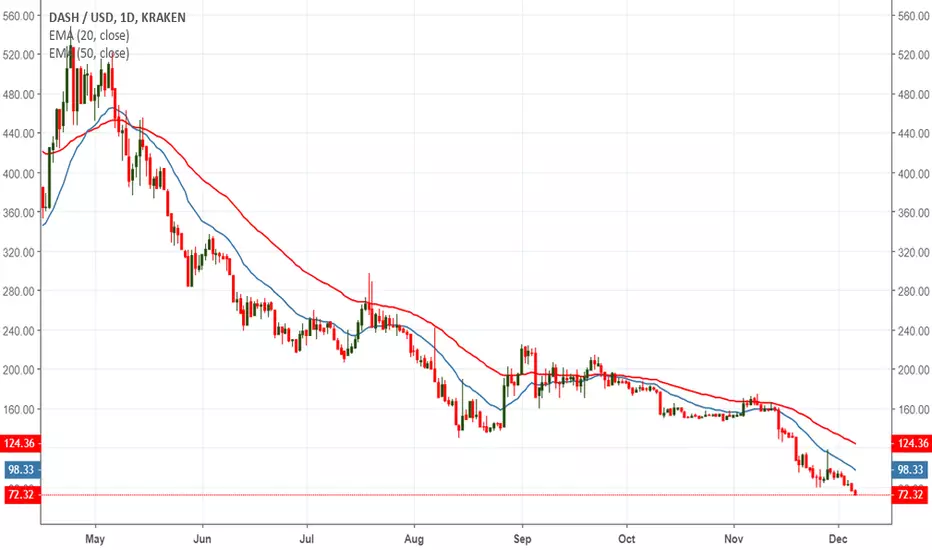
DASH/USDDASH/USD bounced over the past three sessions, a promising change from the bearish sentiment seen before.
Through November Dash dropped over 65%.
The price however, managed to find a bottom most recently just below $60, within the $57 territory. (the lowest level seen since April 2017)
Given the recent stabilization, it gives the DASH/USD bulls something to capitalize on.
A daily hammer candlestick formed after hitting the $58 territory demonstrated a strong sign of a potential reversal to come. (And we witnessed an upward movement today).
Upside targets:
$81-$89 (supported the price from 25 November -4 December)
Before the 65% drop, the price was comfortably trading around the $150 territory. Should the bulls maintain current course of momentum seen and breach the $81-$89 zone. Then it wouldn’t be too surprising seeing a quick move back pre-November fall levels.
Not a trading advice. Never invest (trade with) money you can't afford to comfortably lose.


Dash Automatic InstaSend – A Major Game Changer?Dash is set to perform a major update to their InstaSend feature to make all transactions instant, secure and permanent. This could be a major step towards using cryptocurrency as a viable day to day payment method.
Currently, InstaSend comes as an optional feature that has be manually activated by the user and that incurs an additional transaction fee. With the addition of the new Automatic InstaSend, all “simple” transactions (about 90% of all transactions) will benefit from the instant settlement, which will make paying with Dash as fast as “traditional” methods. Also, InstaSend will not incur an additional fee.
Despite the positive news, Dash has been sliding lower and losing almost 20% against the US Dollar during the last 7 days and close to 5% for the last 24 hours. Currently, it is trading just above $78 and has broken the previous low.
The technical picture looks very much bearish for Dash and all we can expect right now is a bullish retracement because the downtrend is overextended. A reversal is unfortunately not in sight, at least not based on technical reasons.
The previous support at 86 has turned into resistance and the pair has reached a low at 74, which is now turned to support. As seen from the above 4H chart, the price has printed a rejection candle (long lower wick) right on said support level but it seems to lack strength (small candle body, multiple Doji candles just before it). If we are going to see a correction higher, the first target is 86 and the bearish trend line seen on the chart.
Support zone: 74
Resistance zone: 86 and the bearish trend line
Most likely scenario: bullish correction into resistance (no break expected for the short term)
Alternate scenario: break of 74 support and drop into 70 which is the next BRN (big round number)


AAAAnd The Rockets Red Glare! Who Needs Govt We Have Dash! Rockets red glare! Who needs govt we have Dash!
Dash has touched long term support. It should be all uphill from here. First stop 50 day moving average. 2nd stop 200 day moving average... Then new ATH sometime between tomorrow and end of 2019.
If we break lower... Then... The bomb bursting in air will have to suffice.
Godmode shows massive oversold conditions on the daily, so much so i feel its manipulated. No need for conspiracies... Buy a $93-$100 dash. Next All time hi

Can Dash break resistance?Dash has rallied into and reversed off resistance priced in both USD and BTC. This comes after a few months of underperformance against the entire crypto market. If it breaks resistance it would be significant, but the chances may be slim.
If Bitcoin trades higher, capital may flow from Dash to BTC, while more downside for Bitcoin will probably hit all coins.
Worth watching though.
