Triangle broke. Bearish confirmation. Short.DASHUSD broke the Higher Low sequence on the 1D Triangle (RSI = 47.684, Highs/Lows = 0.0000) that kept the price neutral during September. This is the break-out confirmation that the price needed to resume the bearish trend on 1W (MACD = -76.290, B/BP = -43.0033, ADX = 45.294). Our outlook is intact. We expect a quick 166.68 support test followed by our target set, which is the 126.5509 1D bottom and 100.21 in extension.
Dashusd


DASH Short termWith the bullish market sentiments, there is still more ups to go for DASH.
The diagram is self explanatory where yellow and green are support lines and red being the resistance lines.
Important notes:
-RSI comes more important when its a bullish movement. Note the RSI chart and points of entrance and selloffs.
-222 will be the main resistance
Note: It is in the plan for DASH release of EVOLUTION sometime before the end of the year. This will push DASH prices up and make it very popular as no other crypto will have this type of wallet.
Yes, I'm a DASH advocate.

DASH (DASH/USD) - Bullish Breakouts!!DASH has made a breakout from two triangles. First bullish four-hour candle takes down that smaller triangle and the second candle takes down the bigger triangle (blue lines).
We have talked before, that how strong it looks like and etc. Currently, as we said, it has two bullish signs but let's count all bullish signs together, we have:
1. Upwards breakouts from the triangles
2. A break above the round number $200
3. Break above the June and July low (currently no close above)
4. The golden cross between 100 and 200 EMA
So, those criteria will guide us to the higher levels and the target areas could be around:
* $225 - the August high level which starts to work as a resistance
* Currently, the main target would be around $250 - semi-round number, the triangle pattern possible target, Fibonacci extensions!
Technically, DASH is very bullish, many bullish price action criteria matching each other and it is ready to climb into the main target area!
Hopefully, those levels and this analysis helped You out a little bit to confirm Your own analysis!
Please, don't forget to hit the LIKE button to support us!
Best regards!

Dash- Extremely strong coin with excellent breakoutHi Fellow Traders,
Lets look at Dash, a coin which has had massive gains from 2016 to 2018. If i remember correctly this coin went from $4 to $1500 in that period, these values are estimate if i remember correctly but you could check and see for yourself. Now ever since Feb of this year all coins took massive hits including Dash, and what is exciting about this is we have a new opportunity to buy Dash at a cheaper price. So lets take a look at technical analysis of this coin:
1) Divergence on Rsi and MFI on daily chart which is a extremely strong indicator of a possible trend change
2) The directional movement indicator is showing the DI- falling from above the 40 mark, which also adds to the directional change of this coin and also the ADX line also falls from this 40 mark also adding more strength to the idea
3) The massive breakout from the downtrend with much higher volume is also extremely important
4) The retracement after this initial breakout has higher lows with lower volume with more green candle volume which shows how strong this run might be.
5) You can also the Dash/Usd pair and see for yourself that we have reached the start of the fifth wave of the last price run for dash, this is usually a strong point where downtrend might end, although not always the case just remember that.
Put a stop loss 15% of entry point
REMEMBER
In Technical analysis we try to increase the probabilities of success, so be open to new information and being able to adapt to the constantly changing market.
Successful Trading
Crypt1c_one

DASHBTC - 4H - UpdateDASH reacted strongly to the 0.021 demand level with one of the highest volume days ever! Since then, it has continued to trend higher tapping the demand zone around 0.0255 before resuming its uptrend.
It has run into resistance here and is having trouble closing above this supply zone. If the daily candle can close above here, we can expect a continuation of the trend higher. However, if BTC does continue to breakdown, we can enter a short position on a break of the triangle and target the 2 demand zones below as initial targets.
Stops would be placed above the SFP high on that previous attempt to break above and if we do get a fakeout lower, we could chase the upside move with BTC momentum above 6600!
Please hit the 'like' button and give us a follow!
Let us know what you think below!
Thanks

Channel Down intact but Triangle in play. Awaiting for break outDASH remains within a Channel Down formation with 1W applying significant selling pressure (MACD = -77.480, B/BP = -59.3039). On 1D however a Triangle has emerged that is keeping the price neutral (RSI @ 50.830, STOCH @ 53.459, ADX @ 13.271, CCI @ 43.9842, Highs/Lows @ 0.0000). We expect 174.20 to be crossed, which will nullify this Triangle and make the price resume the bearish trend of the Channel Down. Our short targets are intact: TP1 = 126.5509 and TP2 = 100.21.
DASH Shows Us Incredible Strength!!Overall, DASH' has shown us as a pretty strong coin. The drops aren't so deep and the recoveries are faster and higher!
Currently, we have two triangles, one is bigger (blue trendlines ) and one is smaller (orange). Over the weekend, DASH' has made a breakout from the smaller triangle and it found a resistance from the round number at $200. At the moment it has started to make a throwback, the throwback is healthy if we find a support from the orange triangle upper trendline. The trendline is supported with several EMA's (50, 100, 200) which all starts to work as supports. Actually, at the moment, this is a pretty rear case that DASH' trades above the all important EMA's on the four-hour chart it is a very strong statement!
If the whole market starts to show us some positive signs then this retest area would be a perfect spot to invest into the DASH' but You have to watch what BTC' does, currently it 'sitting' on the "Descending Triangle" and we are ready to make a breakout from either direction so, the current market situation is a bit risky because we have mixed signs!
If the bounce happens then again we bounce upwards to the round number level and overall this is a pretty strong level to beat. Why? Because:
1. $200 round number works as a resistance
2. July low works as a resistance
3. The trendline since 20.07.2018 works as a resistance
So, a pretty tough level but if we manage to break upwards then the triangle pattern shows us that the next nearest target would be the next 'round number' $250 and definitely we reach there because DASH' has shown almost incredible strength compared to other top altcoins!
...and to give You a bearish view/confirmation, it is simple - at least a four-hour candle close below both triangles will guide us to the lower levels, so watch out if the price reaches into this area (around $175-$180)
Hopefully, those levels and this analysis helped You out a little bit to confirm Your own analysis!
Please, don't forget to hit the LIKE button to support us!
Best regards!

DASHUSD buy DASHUSD Bullish triangle
Buy 189
target 1 = 219 (15,8%)
target 2 = 239 (26,4%)
no stop loss
no leverage

Breakout tradeRegardless on bitcoin's suspense, DSHUSD is most likely forming a triangle on market.
This trade can be evaluated as rather save deal with good price open and stop level.
DSHUSD is going to decline if BTCUSD corrects on next week.
On other side, UPtrend can drag on that can be reason for DSHUSD rising.
On both ways, you will get some profit with Dash.
Enjoy profit, guys!

DASHUSD - 1D Chart Analysis
Like for the rest of the coins, the bearish trend is applied also for Dashl. Based as well on a decreasing market capitalization, it seems that the price is also searching for a bottom.
Technically speaking, the trend channel seems to be created by the peaks of 292$ and 231$ reached on the 20th of July and the 2nd of September, while the bottoms are 164$ and 127$, values which were reached on the 11th of July, respectively on the 14th of August.
If the price will finish the day below 187$ (the opening price of the candlestick) it means that we will see a red candlestick created below the 20 days Moving Average which can be a nice confirmation of the downtrend.
Both RSI and Stochastic have neutral positions while the MACD Line seems to try crossing the Signal one which can lead us to another bearish signal.
If this scenario gets caught up, the target prices which can be considered are :
* 171$ - Support Level 1
* 159$ - Support Level 2
* 141$ - Support Level 3 (in extension)

dash scalplooking to catch a bounce.
market looks sideways to continuation up short term.
low vol follow through
10 at 177.2


Lower High selling pressure. Shorting intact.Following a short lived (non-technical) rise on 4H, DASH has resured the downtrend, on even stronger momentum, as 209.140 is another Lower High on 1D (Highs/Lows = -4.2017). We expect an emphatic test of 156.55, which will reset the currently neutral RSI = 47.724, STOCH = 46.018, ADX = 17.310 back to a bearish action. Our short targets for DASHUSD are intact: TP1 = 126.5509 and TP2 = 100.21.

DASH (DASH/USD) Looks Good Compared to Other ALTS!Currently, DASH' trades above the round number $200. After the massive market drop and after the tough weekend, DASH shows us still positive signs.
First of all the rare case is the EMA's, in the 4h chart we trade above the all important EMA's (50, 100, 200).
If we look at the monthly chart then there we could see that we got a bounce upwards from the 50 EMA which worked as a support and now if the market stays stable for a while then we could beat the blue trendline which is almost the last down-trendline on the DASH' chart!
If we break above the trendline then the next strong area would be around $230. There are the August high point and the area where the price started the last year's rally upwards!
Let's call this area the August high, this strong price level has worked historically very nicely and we can read this area to our key area. After the breakout above this price level could mean that DASH' have good times ahead, we make a new clean higher high and ready to climb upwards!
Currently, the price shows us (even in this tough market situations) very nice price action but if we want to confirm bearish price action then it would be a candle close below the short blue up-trendline. Then we trade above the EMA's, we broke the minor trendline and it made a new short-term lower-low, this means that it 'want's' to go and retest the lower prices around $125!
Hopefully, those level and this analysis helped You out a little bit to confirm Your own analysis!
Please, don't forget to hit the LIKE button to support us!
Check the full crypto-analysis u.today

DASH/USD | SELL | $197.00 >>> $102.22 (Target Profit = $94.78)The collapse of markets continues. All violas will suffer very badly ...
Margin Trading (Short)!
Sell - $197.00
Take Profit - $102.22
Stop Loss - $225.00
---------------------------
Profit Plan = $94.78
Risk = $30.00


Dash Targets
Welcome Back!
Taking a look at the weekly it looks like were finally finished correction.
Market structure points to a falling wedge breakout which would indicate a reversal, as well as, continuation.
These are my targets for the bounce im expecting.
They were calculated by Fibonacci which thus far, Dash has shown to follow quite accurately.
God Bless,

dash head and shoulders patter suggest lower prices were have a very simple head and shoulders pattern.
a lot of how this pattern plays out depends on what btc does!
with lack of real price action in the market news will most likely be the determining factor in upcoming direction
Its been my experience for 1.5 years trading crypto that low vol usually signals lower price because the market is highly subjective and emotional.
prediction: Dash falls with the market but long term Dash does very well


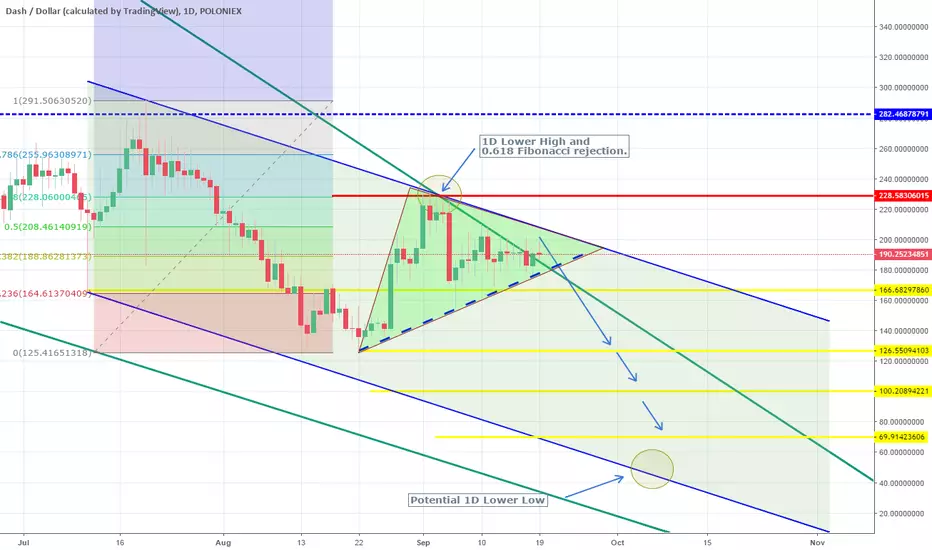
Lower High made. Resuming the downtrend.DASH made its Lower High on the 1D Channel Down (RSI = 44.667, Highs/Lows = -4.5663, B/BP = -34.5288) and has now resumed the downtrend having already broken 166.68. This rejection was on the 0.618 Fibonacci retracement level (288.060), like BTC, so on a 1W Lower High approach, it can be sustainable. For that reason, we are still shorting DASHUSD with TP1 = 126.5509 and TP2 = 100.21.

capthere is some vol drop and bear div on mom / there must be drop to 38% and 61% fibo of last bull wave in matter of that bearish wedge//
if major resistance breached this idea is no longer usable//
if you want more update on this idea give a like or comment// good luck
