DASHUSDT - Pay attention to the chance!Dear mates,
DASH is slowly rising up after breaking out of the main bearish channel.
The current price is already x5 from the bottom, however, given the current market situation, we can be confident that the price will continue to rise before having a strong crash.
Please see the chart for my predictions.
Note: The coin has extremely large support at $ 63 and another at $ 91 if you're an opportunist and strategist, you can place a buy order at these prices because when the market falls it will recover quickly.
~~~~~~~~~~~~~~~~~~~~~~~~~~~~~~~~~~~~~~~~~~~~~~~~~~~~~~~~~~~~~~~~~~~~~~~~~~~~~~~~~~~~~~~~~~~~~~~~~
Above is my personal opinion, I do not encourage anyone to follow suit, please manage your money, Good luck!
Xin Liar
Dashusdanalysis

DASH - $600+ THIS YEAR!DASH is looking at making a comeback in 2021. DASH has a very similar chart pattern to many other coins including WANCHAIN and NEO and EOS, that being a golden gross on the weekly as well as an Ichimoku cloud breakout and long term pennant breakout!
DASH could definitely see $642.92 + this year.
0.382 (642.664) fib retracment = $642.92 usd (fibonacci sequence)
As always let me know what you guys expect DASH to reach this year
''Buy Big Sell BIGGER'' - MegaWhale


DASH 1D First $135 and then we will seeA month has passed since the previous DASH idea was published.
It began working out less than two days after publication and gave +60% in a week, don't you believe?) Check)
Further news in the delisting of the anonymous trio XMR, ZCash and Dash from the Bittrex exchange and not only them, significantly lower the price.
But this news can be considered worked out and one can think of a positive scenario.
To begin with, we can expect the DASHUSDT price to grow to the zone of $130-135.
And only if buyers' aggression is felt and we see a confident fixation of the DASHUSD price above this zone, we will dream of further growth. For example, to the next zone from above $210-230, is it time to catch up with Ether, or not? )
If sellers become active in the zone of $130-135 , then it will again be the fall below $100.
_______________________________
Since 2016 , we have been analyzing and trading the cryptocurrency market.
We transform our knowledge, trading moods and experience into ideas. Each "like under the idea" boosts the level of our happiness by 0.05% . If we help you to be calmer and richer - help us to be happier :)

DA$H Fib Transition, Breakout?A fib transition from 1.618 to 2.618 can be seen
this may allow the price to move up with more ease
outlined some chart patterns for extra detail
the fib transition is the main area of bullish concern however

DASH 1H BUY If DASH managed to hold above trendline for a few hours,
we will buy DASH spot and see how far it can go
Set some buy orders near the Trendline
Stoploss: next sell signal on 1H chart
Easy Trading Indicator for Beginners
When the ema1 crosses above ema2, the area will be painted GREEN in color, and a BUY signal will appear. = BUY
When the ema1 crosses below ema2, the area will be painted RED in color, and a SELL signal will appear. = SELL
Area painted with ORANGE color means ready for flipping your position or take profit from your current position

Dash Tetherus If the arc occurs in one-week candles, the goal is $ 150. (if the boss btc allows.) The sma 10.50 intersection is not yet complete.
On the 4-hour chart, you can see a triangle pattern where buyers are stronger. We can expect an increase of the height of the triangle from where it breaks the triangle upwards.
it is not investment advice. It is amateur work. Good luck.

DASH is doing well DASH/USD prediction + entry LEVELSDASH was like on a rollercoaster, but it seems we have found our bottom at the price of $100. Massive DOJI formation seems like we have buyers' appetite. At least at $100. If there is an opportunity to buy at this price, you should at least consider it.
Entry levels for LONG positions:
$117
$110
$101

DASH 12h There is a chance for a cool tradeMore often than once a month, it is impossible to review the Dash, and there is no need for this, since the coin likes to walk for a long time in large consolidations.
A series of DASHUSDT ideas will be attached below.
After 2.5 months of autumn consolidation, the DASH price has broken the trend and now, for more than a month, is consolidating above the trend.
The price movement corridor is about 35% , trade from border to border and just take profit on time, everything is simple)
Dash did not shoot following BTC and the main reason, we think it is worth mentioning, is the statement of the Bittrex exchange about the delisting of DASH, XMR and ZEC 15.01.
But if you look at the history of Dash trading, it fired when no one expected it.
To the upper limit of the channel +30%.
To the target above, where one will need to sell Dash in the zone of $135-145 +60%.
Long mood will change when more negative news is released, while the price will fall and fix below $80.
A pretty good risk/reward ratio for the mid-term trade is appearing now.
_______________________________
Since 2016 , we have been analyzing and trading the cryptocurrency market.
We transform our knowledge, trading moods and experience into ideas. Each "like under the idea" boosts the level of our happiness by 0.05% . If we help you to be calmer and richer - help us to be happier :)

Dash breaks out the prison...Dash breaks out the triangle and soon will jump to the specified targets...

DASH/USDTI have two plans for DASH. One of these two plans may be formed, so buy wisely and patiently.
Good luck, friends. ✌✌
Like and comment please✏♥️

DASH Break Out? Will we DASH to the MOON?We can see that we are awaiting the break of the cloud on 4 hour, and RSI/CCI looking great at the lower level of cloud/support. I'm monitoring for a candle close ABOVE= BERAKOUT here.
I will be looking to enter break out trade to first target $120. Depending on your trading style, you could have also bought support line and already grabbed ~5% day trade (better with leverage and tight stops and need low fees).
Look further below as I discuss breakout entry in 15 min chart
When looking for entry on the breakout, we will monitor our Camarilla levels in the YELLOW HIGHLIGHT. A nice candle breakout above here and I will enter. Above and await retest bounce also works here for your entry
(STAY IN CONTROL-TRADE YOUR STYLE)
-If we break out- I will monitor at $120 level and likely implement a moving trailing stop loss strategy to allow for higher MOON BLAST breakout potential
-Stop loss is shown at $105 if you are not able to monitor charts and I will have on during overnight
-A 15 minute candle close back below entry level/Camarilla level while watching would allow for closing trade higher than STOP LOSS
-For straight take profits this is TP1 $120
-$140 is a good TP2 and can be looked at further back in higher time frame charts
**BE CAREFUL- OPINIONS NOT FINANCIAL ADVICE***
ENJOY :-)

$50 GIVEAWAY IF YOU CAN GUESS THIS PRICE TARGETWelcome everyone,
My name is Schyler with NewWave Traders. NWT is a movement in Elliott wave and trading education, a movement in creating independent and profitable traders, and a movement in lifestyle. I've been a full time trader since 2017 in the crypto markets and I help traders create a full time income for themselves without working the full time hours by mastering a proven Elliott Wave trading system that will allow you to trade on your time and live the life you deserve. Hit the follow & like button if you'd like to make it a reality. I've helped hundreds of traders just like you make it a reality for themselves. Looking forward to helping you create your success story and life.
Alright...
So lets talk about the excitement..
Drop a comment below on your price projection for DASH/USD by 12/27/20
The trader closest will get rewarded the $50 giveaway!
Don't forget to check out the SUSHI count that highlights one of the most profitable assets of 2021.


DASHUSDt - break out inclined level.Break out the inclined, see how well such break out work out.
The inclined level was formulated on a large of touches.
do you trade inclined levels?
Push like if you think this is a useful idea!
Before to trade my ideas make your own analysis.
Write your comments and questions here!
Thanks for your support!

Dash/usdt broke trendline and retest itDash/usdt
Holding support
Broke trendline resistance and retest it
Buy area
70$ - 65$
Stoploss 4h close below 64$
Targets
72.59$
74.75$
78.90$
86.00$
99$.00


DASH/USD LONG SET UP (HODL) DASH JOINS DEFITitle : DASH/USD BUY SIGNAL
Asset : Crypto
Type : Limit Order Or Market First Entry
Time Frame : WEEKLY
Entry Price 1 : $74.00
Entry Price 2 : $64.00
Stop Loss : $60.00 (140 PIPs)
TP 1: $88.00 (140 PIPs)
TP 2: $98.00 (240 PIPS)
TP3: $114.00 (400 PIPS)
Tp.4 $126.00 (520 0PIPS)
DASH bullish after 15% spike on back of masternode news
OCTOBER 20, 2020 BY BENSON TOTI
Dash has traded between a low of $73 and a high of $77 on the day
Dash has seen its price surge by more than 18% in the past 24 hours. The price is posting to the upside on the back of increased positivity among Dash users eyeing up a slice of the DeFi pie via yield farming in addition to rewards from staking.
DASH/USD price soared from lows of $64 to hit a 30-day high of $77, with the upside spurred by increased buying volume after Dash announced it was partnering StakeHound to make DASH accessible to DeFi users.
Also positive for Dash today is the news that the number of Masternodes on the network has hit a new record high of 5,002. Masternodes on the network use their token holdings as collateral to participate in governance. Operators of these servers earn regular payments in the form of Dash.
Dash price
The cryptocurrency is trading with a bullish bias as shown by the MACD on the 4-hour chart below. A look at the chart also shows that the 20 VWMA is moving away from the 20 SMA, suggesting the price jump was accompanied by increased upside volume.
After breaking above the 20-day, 50-day and 100-day moving averages, bulls have the energy to test resistances around $80. The MACD has strengthened and the MAs are providing healthy support around $70.
On the daily chart, bulls face slight resistance at the SMA200 and SMA100 lines, which are just under the 24-hour highs. Notably, the price has not experienced the aggressive rejection that characterised the last time we saw upside action.
On September 3, the price of Dash crashed 20% to fall from highs of $84, to touch $65. Bears showed the same aggressiveness near $73, with the subsequent action seeing bulls struggle to break above $70.
The hourly and 4-hour charts feature positive candles, although the momentum is squeezed by a decrease in buy volume. Bulls need to flip this to avoid giving sellers the initiative.
In this case, DASH/USD needs to close with a daily candle above the 100-day and 200-day simple moving averages. If bulls achieve this on higher buy volumes, the cryptocurrency will remain bullish.
A reversal in the short term will see bears aim at taking prices to the next major support level around $69.

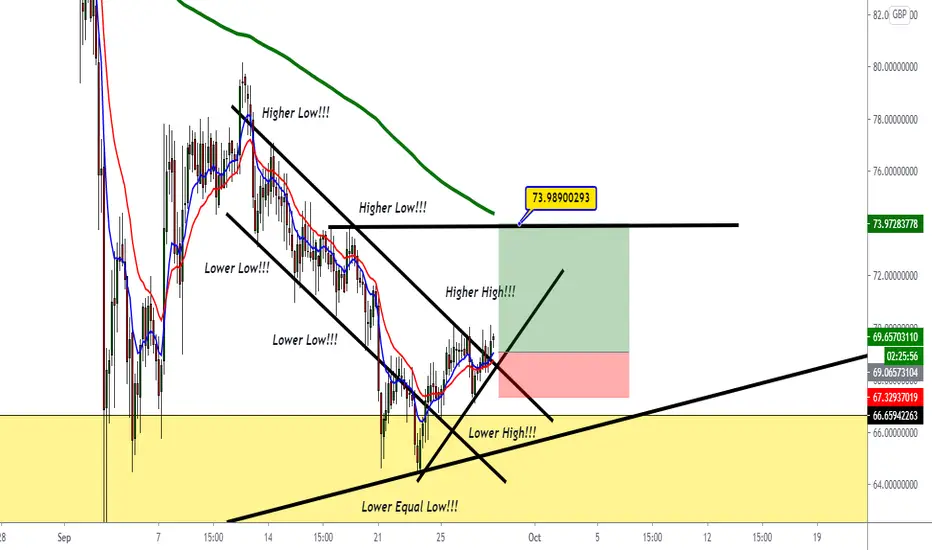
Dash change the momentum of the reversal trend!!! Intersting!!!In this analysis, Dash show us a huge opportunity in long position. It's interesting to see waht Dash do. Because Dash make lower high in the momentum of trend, and we could see that Dash is leading to the $89 USD in medium term.
Also, I suggested to look the Daily timeframe becuase as we retest in the demand supply, there's buyers that buy this crypto!!!
So, in summary I hope a long entry in the buy order limit at $69.06 USD with the SL at $67.32 USD and my own take profit will be $74 USD.
DASH/USD LONG SET UP (HODL) (DASH ROCKET)Dash is a cryptocurrency unlike most others. It’s neither a development platform nor it is like first cryptocurrencies with their huge transactions fees, long transaction waiting times, and volatility Dash is oriented on a completely different level.
Developers define Dash as a cryptocurrency analog for electronic cash. They want Dash to be as liquid and as fast as the online fiat money that is mostly used now
Dash is decentralized peer-to-peer electronic cash built on core of Litecoin, enabling such features as PrivateSend and InstantSend. Dash is decentralized in governance and founded via its own network by mining, which makes autonomous and independent from any authority but its own users. The average block mining time is 2.5 minutes on the Dash Blockchain, making Dash significantly faster than Bitcoin .
Dash Launches Latin America’s First Ever Crypto Debit Card
Crypto exchange Tauros will offer the first crypto debit card backed by Dash in Latin America.
Dash has partnered with Mexican cryptocurrency exchange, Tauros. io , to release the first crypto Visa debit card in Latin America. The offer will initially only be available to Tauros’ customers in Mexico.
The card will work at millions of stores in Mexico by converting crypto funds to pesos using the Tauros mobile app. It will also be capable of conducting online transactions. Speaking with Cointelegraph, Ernesto Contreras, Head of Business Development at Dash Core Group, provided more details about the new product, which is the first of its kind in the region:
"The Tauros card is a first in Mexico and the region, and it will also allow for a very easy way in and out of the Tauros ecosystem, which is very important as it adds massive usability to Dash users in the country. The fact that we are giving the opportunity for people to earn DashBack rewards with their card will also give a boost to the crypto ecosystem in Mexico as now anyone can use their pesos, and Hodl Dash."
COVID-19 drove the debit card’s launch forward
He added that the recent need for contactless payments helped to accelerate the product offering. He emphasized the necessity of social distancing, noting that this will be the “new normal after this pandemic.”
Salador Melendez, CEO of Tauros Exchange, believes that the crypto ecosystem in Mexico is interested in a way to spend crypto directly. He stated that “this new world is about freedom.”
The Dash Core Group recently announced plans to release another update near the end of August.
Title : DASH/USD BUY SIGNAL
Asset : Crypto
Type : Limit Order Or Market First Entry
Time Frame : WEEKLY
Entry Price 1 : $76.00 ✅
Entry Price 2 : $66.00
Stop Loss : $56.00
TP 1: $86.00 (100 PIPS)
TP2: $96.00 (200 PIPS)
Tp.3: $106.00 (300PIPS)
Tp.4 $116.00 (400 PIPS)
tp.5 $126.00 (500 PIPS)
RISK MANAGEMENT
STATUS: 🏃🏽♂️ACTIVE (ENTRY 1)

DASH/USD Short Trade IdeaFailed to provide support at the yearly vwap and broke to the downside.
Because of that $80 area should provide a significant level of resistance and continuation lower to $47 area.
The whole area is invalidated if we accept above $90.

DASH/USD LONG SET UP (HODL) (DASH ROCKET)Dash is a cryptocurrency unlike most others. It’s neither a development platform nor it is like first cryptocurrencies with their huge transactions fees, long transaction waiting times, and volatility Dash is oriented on a completely different level.
Developers define Dash as a cryptocurrency analog for electronic cash. They want Dash to be as liquid and as fast as the online fiat money that is mostly used now
Dash is decentralized peer-to-peer electronic cash built on core of Litecoin, enabling such features as PrivateSend and InstantSend. Dash is decentralized in governance and founded via its own network by mining, which makes autonomous and independent from any authority but its own users. The average block mining time is 2.5 minutes on the Dash Blockchain, making Dash significantly faster than Bitcoin .
Dash Launches Latin America’s First Ever Crypto Debit Card
Crypto exchange Tauros will offer the first crypto debit card backed by Dash in Latin America.
Dash has partnered with Mexican cryptocurrency exchange, Tauros. io , to release the first crypto Visa debit card in Latin America. The offer will initially only be available to Tauros’ customers in Mexico.
The card will work at millions of stores in Mexico by converting crypto funds to pesos using the Tauros mobile app. It will also be capable of conducting online transactions. Speaking with Cointelegraph, Ernesto Contreras, Head of Business Development at Dash Core Group, provided more details about the new product, which is the first of its kind in the region:
"The Tauros card is a first in Mexico and the region, and it will also allow for a very easy way in and out of the Tauros ecosystem, which is very important as it adds massive usability to Dash users in the country. The fact that we are giving the opportunity for people to earn DashBack rewards with their card will also give a boost to the crypto ecosystem in Mexico as now anyone can use their pesos, and Hodl Dash."
COVID-19 drove the debit card’s launch forward
He added that the recent need for contactless payments helped to accelerate the product offering. He emphasized the necessity of social distancing, noting that this will be the “new normal after this pandemic.”
Salador Melendez, CEO of Tauros Exchange, believes that the crypto ecosystem in Mexico is interested in a way to spend crypto directly. He stated that “this new world is about freedom.”
The Dash Core Group recently announced plans to release another update near the end of August.
Title : DASH/USD BUY SIGNAL
Asset : Crypto
Type : Limit Order Or Market First Entry
Time Frame : WEEKLY
Entry Price 1 : $80.00✅
Entry Price 2 : $76.40
Stop Loss : $71.80 ( 100PIPs)
TP 1: $101.80 (100 PIPS)
TP2: $111.80 (200 PIPS)
Tp.3: $121.80 (300PIPS)
Tp.4 $131,80 (400 PIPS)
tp.5 $230.00
RISK MANAGEMENT
STATUS: 🏃🏽♂️ACTIVE (ENTRY 1)

DASH/USD LONG SET UP (HODL)Dash is a cryptocurrency unlike most others. It’s neither a development platform nor it is like first cryptocurrencies with their huge transactions fees, long transaction waiting times, and volatility Dash is oriented on a completely different level.
Developers define Dash as a cryptocurrency analog for electronic cash. They want Dash to be as liquid and as fast as the online fiat money that is mostly used now
Dash is decentralized peer-to-peer electronic cash built on core of Litecoin, enabling such features as PrivateSend and InstantSend. Dash is decentralized in governance and founded via its own network by mining, which makes autonomous and independent from any authority but its own users. The average block mining time is 2.5 minutes on the Dash Blockchain, making Dash significantly faster than Bitcoin.
Dash Launches Latin America’s First Ever Crypto Debit Card
Crypto exchange Tauros will offer the first crypto debit card backed by Dash in Latin America.
Dash has partnered with Mexican cryptocurrency exchange, Tauros.io, to release the first crypto Visa debit card in Latin America. The offer will initially only be available to Tauros’ customers in Mexico.
The card will work at millions of stores in Mexico by converting crypto funds to pesos using the Tauros mobile app. It will also be capable of conducting online transactions. Speaking with Cointelegraph, Ernesto Contreras, Head of Business Development at Dash Core Group, provided more details about the new product, which is the first of its kind in the region:
"The Tauros card is a first in Mexico and the region, and it will also allow for a very easy way in and out of the Tauros ecosystem, which is very important as it adds massive usability to Dash users in the country. The fact that we are giving the opportunity for people to earn DashBack rewards with their card will also give a boost to the crypto ecosystem in Mexico as now anyone can use their pesos, and Hodl Dash."
COVID-19 drove the debit card’s launch forward
He added that the recent need for contactless payments helped to accelerate the product offering. He emphasized the necessity of social distancing, noting that this will be the “new normal after this pandemic.”
Salador Melendez, CEO of Tauros Exchange, believes that the crypto ecosystem in Mexico is interested in a way to spend crypto directly. He stated that “this new world is about freedom.”
The Dash Core Group recently announced plans to release another update near the end of August.
Title : DASH/USD BUY SIGNAL
Asset : Crypto
Type : Limit Order Or Market First Entry
Time Frame : WEEKLY
Entry Price 1 : $81.80✅
Entry Price 2 : $76.40
Stop Loss : $71.80 ( 100PIPs)
TP 1: $101.80 (100 PIPS)
TP2: $111.80 (200 PIPS)
Tp.3: $121.80 (300PIPS)
Tp.4 $131,80 (400 PIPS)
RISK MANAGEMENT
STATUS: 🏃🏽♂️ACTIVE (ENTRY 1)
