dashusdtGiven the specified channel, now it has hit the channel ceiling and the resistance range, we expect the midline range
DASHUSDT

TRADE VIEW ON DASHLooking at #DASH on 4hrs TF... My zone of interest is $360-$380. Price is compressing towards this zone, so i expect price to shout up into the zone(MPL) and drop to $275-#280. That is the price level where i will be on the lookout for a buy. #dashcoin

DASH/USDT 440$?Good day friends! 🤞😊Dash Coin Analysis.
I hope you understand what I'm talking about, because I don't know English , but I would like to share my thoughts with you !:)
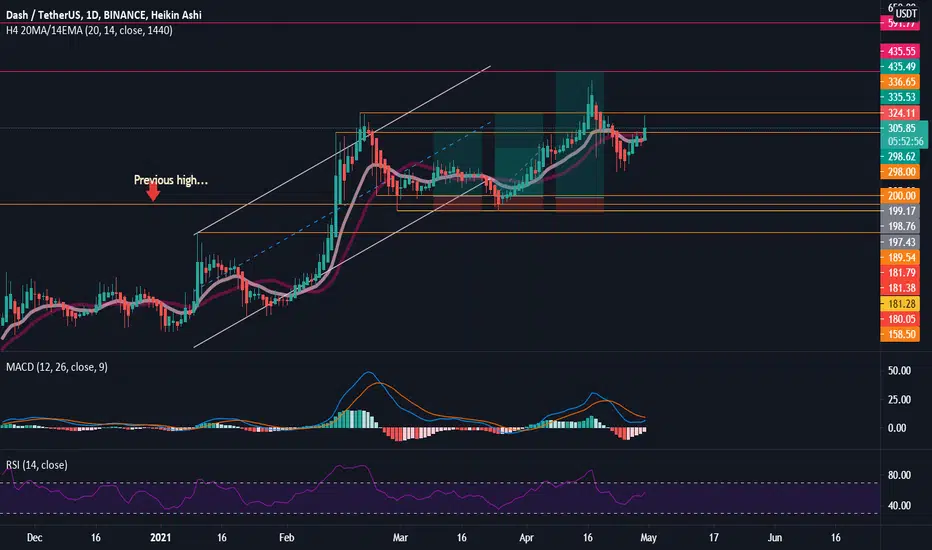
At the moment, the coin is at the bottom of the channel ,if we have enough strength from the current ones, we will see an increase to 338 or with a pullback to the lower border, for the potential formation of a double bottom.
This is also indicated by the pair to bitcoin , where the formation of an ascending triangle occurs.
Target sale 338,390,440.
the cancellation of the scenario will be going beyond the lower border of the channel and fixing below the level of 243,in this case, from the rectangle marked in red on the chart, you can expect a strong reaction and a reversal of the trend.
If you liked this idea, put 👍, write what you think about this analytics in the comments, subscribe ✔, thank you for your attention.🔥😉

Bad scenario test weekly or monthly support ?Bad scenario: #DASHUSDT #dash #dashusd #binance #altcoin #crypto
Monthly support point test
Monthly : I can't believe this is happening right now!
This is just the monthly support point that the charts and indicators show. And there is no reason why it should be tested.
weekly : There is probably still weekly support re-testing.
$ 260-280 area
But now the chances of other scenarios (ascending and bullish scenarios) are higher.
What do you think ?

DASHUSDT 2 target forecasts#bullish #dash# dashcoin #dashbtc #crypto #binance #buy_signal #altcoin #cryptocurrency #trade #dashusd
#forecasts
#DASHUSDT 2 target
about 600 / 880
I'm not sure about the timing, it's just a scenario
But I'm pretty sure about the targets


Dash: Going for 3 out of 3Dash is looking pretty nice at the moment... let this SOB run! Not financial advice... CHEERS!
#dash idea update... $500 target is still a good one!#dashusdt
digital cash coin
LONG
but entries matter!

DASH on the way to $479 as it breaks my parabolic indicatorsSo as per previous analysis, DASH played out how I explained. DASH retested the long term trendline and then on the daily chart the RSI crossed over the red horizontal line causing DASH to become parabolic.
Here is what I mentioned in last analysis 'On the daily chart of LMACD shown below I know when it breaks above the red horizontal line, Dash goes parabolic in price. Dash needs to break this line on the daily chart to confirm the upward move.'
If you monitored my charts you would of picked this up and made the move to buy in after the RSI crossed this red line.
What I can see on this weekly log chart is on the RSI you can see the lime green trendline for the previous bull run on DASH and also for the current one. DASH needs to stay above this line to keep bullish momentum.
On the LMACD you can see on the weekly chart that once DASH goes above the yellow horizontal line it goes on it's bull run as shown where the red down arrow is on the previous bull run in 2017.
DASH has just bounced off the EMA 233 which is the dark blue line on the chart. DASH is above the Ichimoku Cloud.
On this daily chart below we need to be wary of when the LMACD hits the yellow line on the daily chart as we could see a retrace before the next pump upwards to our target @ $479 where the 4.236 Fibonacci retracement indicator is shown on the chart.
Happy trading legends!
HTBB
Take a look at my other charts and analysis below to see my unbelievable correct analysis record. If this kind of analysis interests you and you want more than just 1 or 2 correct chart analyses every month or so, check out my website and become a member.

Zoom zoom!Expecting to have hit at least $425 by July. All on the condition that the BTC top is not yet in.
Disclaimer: this is not financial advice.


DASHUSDT: Below 230 USDT a new Buying Opportunity around 150-183I think DASHUSDT may give us a new buy opportunity around 150-184 USDT if 230 USDT trend support is broken down. HODL! not an investment advice!!

DASHUSDTHello to you all. Mars Signals team wishes you high profits at all times.
As you can see, you can enter the trade for higher targets after breaking the resistance line and stabilizing.
Warning: This is just a suggestion to you and we do not guarantee profits.
Wish you luck!

Dash setting up for more upside Dash has made a solid setup with a potential 13% upside swing trade. A good risk conscious trade might be to buy on a break over 305 with a stop under 288... targeting the 346 area. The downside is nominally significant at 5.4%, however, which should play into sizing (consider being smaller in this trade than a usual setup.) Yet, given the upside of potentially more than 13% a 2.6 R:R justifies taking the trade if you use that variable in your triggers.

DASH BullishDash is going to start a bullish movement, targets and stop loss is as per the chart in case you are interested to buy in spot.
It's not financial advice.

DASH BULLISH CUP AND HANDLEDash printing a nice cup and handle pattern on the 4 hour chart. Opening a leveraged position here. @ 280 Dollars.

DASH/USD $2000 USD+ ALT SEASON BUY EVERY DIP.What I see is a pattern.. BTC/ETH/XMR/ZEC/LTC all the OG cryptos showing the same patterns..
I see Dash blowing past ATH buy all dips and lets come back and celebrate this post after 3-6 months.

$DASH updateI am still bullish about $DASH, even though BTC correction (or to be precise whales shaking weak hands off the bus) we are still continuing our uptrend.
Let's start with the first analysis. We shot through the ascending triangle and gained 35%. Then dropped below the 306$ support zone.
Know we are dancing around that zone forming another ascending triangle. However, due to 1H overbought Stoch RSI there is a high probability for us to drop to the lower side if the triangle or even below it for some time. Risky but profitable entry zone. Otherwise, you can have an entry on the breakout, which is a safer solution. Don't forget that pretty often after breakouts come retest and then we go flying, so don't be scared about a little pullback to the support zone.
Good entry points: 1) 260-265$; or 2) after fixating above 306$ support zone
Goals: 326 - 350 - 380 - 411 - 519 (just and ambitious long-term target calculated from 25 days long ascending tringle)
SL: 255

Dash: 2 Out Of 3Two of three targets have been hit so far... and I still am long for the third target. With that said, I am not saying we can't see more downside. Not Financial Advice... Cheers!

AB=CD and Parallel channel in DASHHello everyone
I expect this way for DASH.
If Bitcoin does not have much correction, the goals are set

