DASH 4H Looks VERY PROMISING - Would you BUY?DASH 4H Los Angeles 11:49PM.
I would appreciate all donations in order for me to attain the PRO version faster and give quality back to the community. If you and I can relate, find things interesting, and benefit from my charts feel free to save up that lunch money and throw me a small donation. Even a $1 will go a long way when used properly. I welcome any criticisms and discussions. If anyone have discounts or know anyone giving out PRO versions that would help as well.
Dash is forming a double bottom and is ready to skyrocket. There is a squeeze within the red candle sticks and it will blast off soon.
Checklist:
BTC has to be stable or rising.
Dash has to stay above the support line.
RSI is at the bottom headed for only one direction - up.
Large amount of bids behind Dash.
CM william indicator is green light.
To me, charting is an experience and experiment. I am trying to be more wrong than right so that I can learn faster. So far its been surprising good. Cheers.
DASHUSDT

Dash: Bullish LifestyleTECHNICALS:
1W SAR swapped and we have closed outside bollinger bands on the 1D candles.
1W candle looking to close outside bollinger bands.
Volume has declined over recent weeks so a break to a higher level would indicate the big money is getting in on move.
FUNDAMENTALS:
Well funded developer team with a solid roadmap.
Has a good scaling solution planned and aims to compete against VISA and MasterCard after upcoming releases.
Bullish pre-conference pump.
www.dash.org
Release mentions "Major Integrations and Announcements".
New Bitmain Dash Miners: bitcointalk.org

DASH/USDI have reasons to believe that this sudden jump in price is anomaly. Looking at historical RSI data we can see that when RSI hits the 70 level it often bounces back, somewhat hard. Looking at the chart I would say this is not a break of the overall bearish pattern over the last days. This is, in my opinion, just an bullish break, and bound to drop to the supportline.
As I am new to technical analysis I would not advice anyone to short the stock based on this analysis. If you have any thoughts to support/opposite my prediction, feel free to share it as I am eager to learn/hear your thoguhts!

Dash Trading OpportunityJust a new trading opportunity which can be used for adding some volume to the previous long trades. The price moves above the cloud and it confirms that the market is bullish. We can use a breakout signal for entry. Pending orders for buy should be placed above 340.00 resistance level. Stop orders must be below 280.00 support level. Profit target is 400.00 level and the rest of volume should be for long term trading. If the market drops below the cloud, we have to delete buy orders and wait for new trading opportunity.

Dash Buy OpportunityThe price bounced from SMA100. RSI confirms price reversal. MACD histogram supports possible upward movement. On the 4H chart the price forms Head & Shoulders pattern which gives a trend reversal signal. We have trading opportunity. Pending orders for buy should be placed above 300.00 level with stop orders at 210.00 level. Profit target is the resistance level and the part of trades can be left for long run.


Dash Triangle Chart PatternThe symmetrical triangle mainly forms during a trend as a continuation chart pattern. But this time the price broke the support line and we should consider this pattern as a reversal one. The market confirms that it's going to move lower. Will it be true or fake signal? We'll see soon. But now we must follow the market movement. Based on this triangle, we can spot estimated profit target. It will be between 200.00 and 170.00 levels. This zone will be good for buying based on reversal signals. But for reaching this zone the market will have to break several strong support levels. As for trading, it will be possible to open long positions with small volume every time when market drops lower. The market is bullish and this falling is good opportunity for buying.


DASH 4 HOUR NEUTRAL RISKYLos Angeles 8:11 PM. Dash 4 hour time frame.
I would wait for a kumo breakout before investing into Dash. Long term - it doesn't look too bad to buy it at discount. Playing with risk if you invest now with all this FUD sensitivity. If you're playing long, buy at support levels.
Fib also shows resistance levels and price action back at .618.


Dash Buy SignalThe price bounces from SMA20 and a support zone formed by 320.00 and 300.00 levels. RSI and a reversal candlestick pattern confirm price reversal. DMI allows open long trades. MACD confirms downward movement, but we can trade based on the previous signals. If you want to get more reliable signal, you should wait for MACD histogram reversal. For other traders, pending orders for buy must be placed at 337.00 level with stop orders at 275.00 level. Profit target should be near 400.00 resistance level. If the market drops below 300.00 support level, the next buy signal will be near SMA50.

DASH: Waiting for a setupI personally think Dash do not get enough attention. This guy been climbing a lot in the past few months. I believe Dash can get close to Bitcoin pricing, but we will have to wait and see, like always. Currently, I see Dash correcting itself back down to the 200s, to retest previous structure. There is a Gartley formation forming for us to enter as well. I am long term on Dash. What are your thoughts?
Trade with care.

DASH/USD Outlook Hello Traders,
DASH/USD broke again to new highs and we still like the idea of pushing it higher. If the market can pullback to around the 50% Fibonacci we like the buying but the market needs to stay below 320.918 to buy any pullbacks, so if the market stays below 320.918 and goes to around the 50R we like the buy. We keep you updated on it.
Hope that helps.
Cheers and trade safely

Dash How to TradeThe price bounces from 400.00 resistance level. RSI and a strong bearish candle confirm price reversal. MACD histogram supports downward movement. The market is going to move downward and give us new trading opportunities. We'll have to watch for price action near SMA20 and 320.00 support level. If the price bounces from these levels, it will be possible to open long trades. Also the same goes about SMA50. Just don't forget that long trades must be opened based on confirmed reversal signals.

DASH 4 HR BULLISH Breakout to new highDash 4 hour time frame. Los Angeles 8:13 pm
1. Price is above the cloud which signals a bullish bias.
2. Price moved below the Tenkan-sen but still stayed above the Kijun-sen.
3. Price had a slight pullback and moved below the Kijun-sen but still stayed above the clouds.
Dash might hit new highs close to $433 if it breaks out of the resistance line. Please don't bet everything on my analysis.


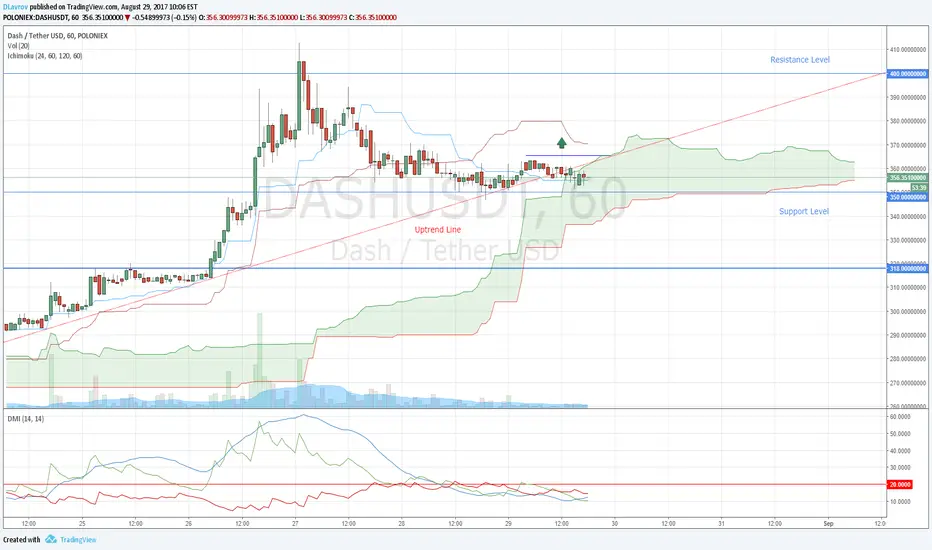
Dash Buy OpportunityIf the market bounces from 350.00 support level and moves above the kumo, we should expect for further upward movement. DMI indicator shows range market conditions and it’s not a good idea to use trend following strategies. But ADX line rises and probably it will confirm the beginning of a new price movement. It’s possible to place pending orders for buy above the local swing high at 365.00 level. Stop orders must be at 345.00 level. Profit target should be near 400.00 resistance level. This is not the perfect trading signal, but it can be a variant for catching possible upward movement on time. If the price drops below the kumo, buy orders must be deleted.
DASH / USDT small correction afterwards further upward trend?As we see, the price is currently moving in a channel that goes upwards. If the RSI touches the trend line and the bars touch the orange trend will show whether the price will continue to rise. The course can thus go up to 500. The target was calculated with several Fibos.

LONG DASH/USD SetupHello Guys,
We want to buy DASH/USD at around 347.150 with a stop loss below 311.1372 and an initial target of 442.360. The market has a bullish trend so we want to buy into a continuation pattern.
As always never risk more than 1% on each trade.
Hope that helps
Cheers

DASHUSD 8h: Two trend way up to 600 USDDash had a strong performance in the last days/hours. The question is, how is it going on? I see current two ways up: correction to 300 usd or correction to 200 usd. Then further upwards. Dash has a position next to btc because dash is more decentralized and anonymous. A long-term uptrend could therefore continue.
Let's see. Happy trading. :-)


DASH reassessed.I previously called a consolidation in DASH, but that was quickly rendered void by the explosive volume seen yesterday. Longterm I think we see 470, but getting there could be quite complicated.

Dash Short Term TradeBased on the 1H chart we can see a short consolidation. DMI confirms range market conditions. We should expect for a strong price movement after a period of low volatility. As the price is above the kumo, we have to buy only. Pending orders can be placed above 300.50 level. If the price breaks this level, we'll get an additional confirmation that the market is going to move upward. Stop orders must be placed below 285.00 level. Profit target should be 318.00 level.
