109% Mapped Short-Term For Streamr DatacoinHello my fellow cryptocurrency trader, another beautiful day today.
Looking at Streamr Datacoin, one of the many low market capitalization altcoins, we have some interesting signals.
While the big market capitalization altcoins printed a lower low after 12-May, the smaller ones are printing higher lows... Giving us a very important and revealing signals.
It will all grow.
We have an ascending triangle, bullish RSI with a break above EMA50.
These are the signals, the rest is on the chart.
Namaste.
DATABTC

DATA/BTC - Streamr ready to pump soon?Streamr (aka: DATA) has been on my radar a lot recently. Shorter timeframes have been showing greater than usual activity suggesting a lot of accumulation going on, zooming out to the daily chart it's easy to see why that may be. Although not a project that pops up in news feeds too often, Streamr is active and currently in the process of a token migration which they assure traders will not affect exchanges. It's possible that this may be a precursor to a larger announcement although it may just be part of the general development plan. Either way, the project's focus on enabling users to control and monetise their own data - as opposed to big tech controlling it - is something that will become increasingly relevant over the next few years, in particular within the crypto space and discussion around the metaverse.
Putting the fundamentals to one side though, the DATA/BTC chart looks very interesting and very tradable imo. No doubt you've already looked at it before reading this so you should know where i'm going here. To start off then, we have a clear uptrend since the beginning of the year, with price following a slight zigzag pattern held up by a strong trendline support. Prior to this, last year's downtrend was held up similarly, overall this pair seems to maintain a clear and stable floor.
What's far more interesting though is the highs, data is no stranger to massive price pumps and high spikes. So far this year it has made significant moves up on 3 separate occasions: Feb, Apr & Jun, each higher than the previous. What is most interesting however are the peaks. Along with two smaller moves from Dec last year, the peaks of each pump fit perfectly to an ascending trendline as shown above. Furthermore, the timing of the Jun peak corresponds to the intersection of this trendline and a horizontal resistance line from the "shoulders" of a h&s pattern from early last year. I have opted to use the daily chart here as it better shows how fast these moves occur thus the origin of this line is off screen unfortunately, but its worth scrolling back for a look.
That brings us up to now, with the peaks-line currently just over 1000 and another intersection approaching with the resistance line from the head of the aforementioned h&s around 1100 and due to meet in a few weeks. I believe this is the reason for the accumulation and a plausible expectation for the price action over the next few weeks. I have drawn in one possible move with a pullback midway, although something like a single parabolic run is also feasible.
Currently data price is low and just above the main support so potentially we are looking at a 3x-4x move with relatively little downside. However should a noticeable break of support occur we should take that as a change of trend and nullify this plan. If everything plays as outlined, we should take note that another resistance line exists from its Nov '19 high around 1750 which may be important at a later date.
All in all, seems like a fairly good trade with a decent risk/reward ratio. Obviously not financial advice - i'm sure you'll do your own research and make your own decisions - but personally i'm joining in with the accumulation for now.

DTATA/USDT (Requested chart)Hi guys, This is CryptoMojo, One of the most active trading view authors and fastest-growing communities.
Do consider following me for the latest updates and Long /Short calls on almost every exchange.
I post short mid and long-term trade setups too.
Let’s get to the chart!
I have tried my best to bring the best possible outcome in this chart, Do not consider it as financial advice.
DATA/USDT TA Update:-
TimeFrame :-D
$DATA is currently trading at $0.067 levels.
Price is consolidating in a DECANDONG Triangle Pattern.
Both sides trade opportunities available once it gives a breakout on either side of the Pattern.
LONG
ENTRY: CMP
Target:- 30% or much higher Targets can be achieved.
Stop loss:- $0.06
2 ) If Price gives a Trend line breakout downside.
ENTRY; BREAK AND RETEST THE DOWNER CHANNEL ($0.062
Targets:- 47%TO$0.064)
Stop loss :- $0.07
This chart is likely to help you in making better trade decisions if it did consider upvoting this chart.
Would also love to know your charts and views in the comment section.
Thank you

Datausdt - has been detected earlier by the scanners The volume impact scanner notify me when the currency are changed in Volume positively and often means a change in the direction of the currency.
Then the hot ticker gives me currency, when it Trend and are traded on strongly.

DATA only for risk takers - red area buy, green to sellPrice looks like there is a bottom...now it should slowly curving up as April is coming - i think we will see some green color in April. Data has nice PA. Usualy this pattern with price under 20 MAs are buys. Lets see and good luck.
NOT A FINANCIAL ADVICE
POSTING THIS JUST FOR EDUCATIONAL PURPOSES

🉑DATA- 2022 New perspective feat. double bottom divergencesThe price reached strong support, left is previous trend forming a potential double bottom there (confirmation after breaking above >0.10$) Multiple bullish divergences can be spotted on various indicators => (RSI,MFI,OBV) The divergence on OBV is insane.
- The chart with longer price history from Bitfinex BITFINEX:DATUSD (different ticker) looks ok (the price is at last point of dynamic support)
- BINANCE:DATABTC pair is at support in a rising channel
The whole 2021-2022 price action could be treated as one big accumulation <= this remains valid as long as the price hold above 0.07$ (red area) Also the good thing is that even if I'm wrong, stop loss can be placed very close(less than 10%) which means that risk:reward ratio here is extremally attractive.
Will post updates whenever I feel like it's needed.

Stremr DATAcoin (DATA) Bullish BreakoutWe have the fake breakdown/stop-loss hunt last week for DATABTC.
Today, we can see a strong recovery.
The stop-loss hunt is the final drop before the bullish jump.
Expect higher prices and this and many other Altcoins.
Namaste.

DATA/BTCI think you can make a good profit from this position
I hope it is profitable for all of you
Stick to the stop loss
#DATA/BTC
Buy: 255-265
TP1: 289
TP2: 325
TP3: 380
Stop Loss : -%8

DATAUSDTHello Guys!
If Price keep holding above Blue Line
Then we can see Upward movement!
___________
Entry: 0.1170 - 0.1080
Most important Resistance 👇
Sell:
$0.1360
$0.1540
$0.1810
Please before any action, Do Your Own Research!
GOOD LUCK..

Databtc 2022 price projectionStreamr(DATA) is launching new features in 2022 including staking data coins. This is a web 3.0 project (decentralized P2P real-time data pub/sub network) which you can create nice applications. 130K nodes have participated in the recent testnet, which shows good community support. In addition, according to the CEO the latency was only 350ms. This is a promising number for a web 3.0 project because it is hard to scale a decentralized network for technical reasons.
The chart is looking good for the midterm. There is a good possibility that the price will perform a butterfly pattern. Commodity channel index supports the idea by making a falling wedge that indicates a bullish sign for the coming months.
IMPORTANT NOTE
In order for this to happen we should not enter a big bear market due to some economic crisis. If the markets go well for the next 6 months, I think there is a very good possibility that this analysis will work.

DATAUSDT TRIANGLE ABCDE PATTERNDATA/USDT
With Triangle Correction
For low risk , wait for the breakout area
Very risk if entry now
Diagonal line can break

DATAUSD Beautiful Triangle FormationA breakout from a falling wedge has led to this large triangle formation (symmetrical triangle)
These often breakout to the upside
It can be seen clearly on the fib circle the transition from a resistance point to a support point
Breakout is coming soon


DATA 3D PREDICTION 1-5$ NEXT YEAR TARGETHi guys, after long time we have here big picture on $DATA streamr Token!
Why iam bullish here?
Next year team Streamr focus on Tokencomics!
-Staking Delegator
-Mining with Run Nodes!
-Governance airdrop token $UNION
and next more bullish price action news!

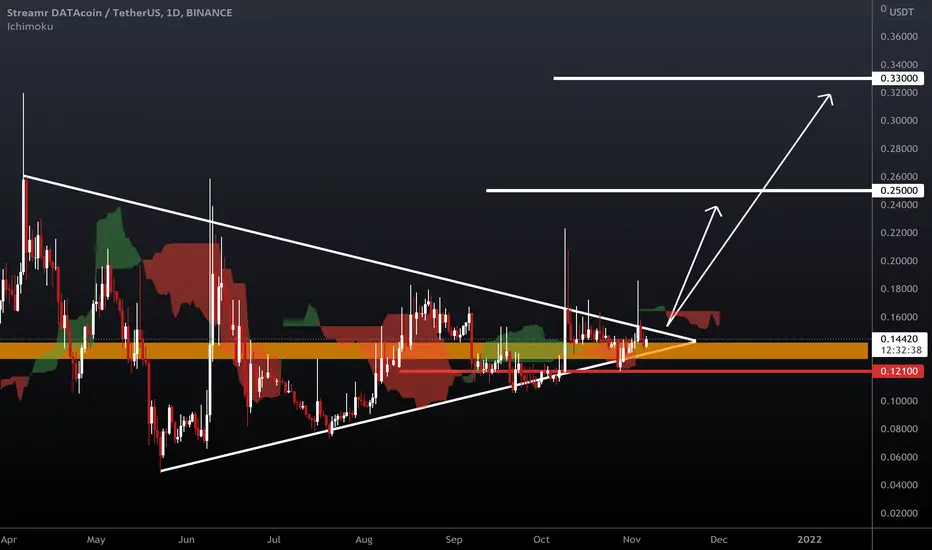
DATA/USDTDATA forming a symmetrical triangle on a daily timeframe with Stoch RSI indicating a buy signal. Breakout is expected very soon after which price can give a huge pump, buy and hold for a quick profit in the short term.
Stoploss is $0.1210 (If the daily candle closes below it).
Streamr DATAUSDT - Symmetrical triangle / bull flag +1100% gains- Streamr - DATA - Rank #424 - Token
- DATA is currently breaking out of the symmetrical triangle.
- After that, explosive move will folow.
- Bullish volume is higher and RSI is prepared.
- Profit target is 1.618 FIB extension.
- For expected duration of the trade, probability, stop loss, profit target, entry price and risk to reward ratio ( RRR ) - please check my signature below ↓
- If you want to see more of these ideas, hit "Like" & "Follow"!

DATAUSDTI am not a fortune teller but I think there will definitely be a trendline breakout, after which, Elliot ABCDE upside waves might follow. DYODD, not financial advice!

DATABTCDATABTC the story is on the chart. It's very simple, yet so elegant. Whales, we see you! Better move it quickl ;)

Data Looks really bullish for a swingVarious important patterns formation:
05 Sep 12:00 Trend Reversal | 4h | $0.15046
04 Sep 20:00 Bollinger Band Breakout | 4h | $0.15236
03 Sep 09:00 Failure Swing | 1h | $0.15
And EMAs are crossing really soon on 4h. a good swing trade.
Cheers 🥂

Datausdt ForecastingAll levels are on the chart waiting for data to pump and hit the targets , Forecasting middle and long-term trade .

Streamr DATAUSDT - Symmetrical triangle / bull flag +1000%- DATA is currently consolidating in the symmetrical triangle.
- After that, explosive move will folow.
- Bullish volume is higher and RSI is prepared.
- Profit target is 1.618 FIB extension.
- For expected duration of the trade, probability, stop loss, profit target, entry price and risk to reward ratio (RRR) - please check my signature below ↓
- If you want to see more of these ideas, hit "Like" & "Follow"!


DATAUSD H&Shead and shoulders on DATA
should bounce on the middle line of the downward parallel trend
