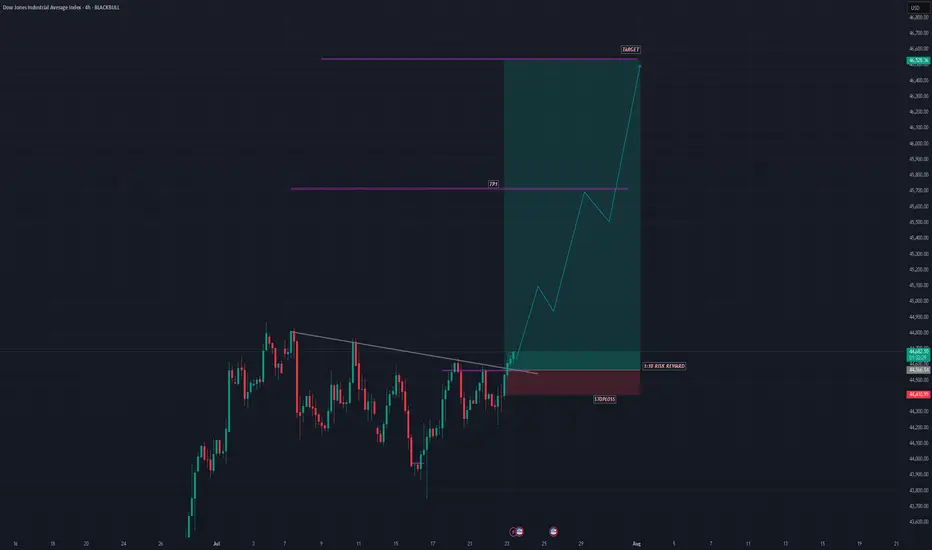
US30 SHOWING A GOOD UPWARD MOVE WITH 1:10 RISK REWARDUS30 SHOWING A GOOD UPWARD MOVE WITH 1:10 RISK REWARD
DUE TO THESE REASON
A. its following a rectangle pattern that stocked the market
which preventing the market to move any one direction now it trying to break the strong resistant lable
B. after the break of this rectangle it will boost the market potential for break
C. also its resisting from a strong neckline the neckline also got weeker ald the price is ready to break in the outer region
all of these reason are indicating the same thing its ready for breakout BREAKOUT trading are follows good risk reward
please dont use more than one percentage of your capital follow risk reward and tradeing rules
that will help you to to become a better trader
thank you
Dawjones
US30The price is moving in Ascending channel
The price has reached the point C of final WAVE ABC
the price will drop down to touch the order block and revisit the daily support and get liquidity before going up again
trade safe

US30 POSSIBLE LONG TRADE Just something to think about and consider. Even though reaching back to the 3500 seems like a farfetched idea, technical analysis is suggesting otherwise. I can already see market structure shifts on the 1hr TF (CHoCH)... Waiting to see how far to the upwards market can move.

us30 is ready to buy ?we have a broken downtrend and backtested 2 times
the price swept the sell side liquidity
so keep ur eyes on it searching for buying opportunities
_____________________________________________________________
don't forget your risk management
follow for more :))

US30 Scalping Trade Order Block Hi Trader's ,, How Area You Today ? Let's Start To Analyze The Market And Get The Best Chance To Enter Trades ,,
On 15 M Time Frame ,, We Can Take A Great Entry For Buy US30 Now ,, Stop And Target On Chart

" US30 " Buy Limit Trade From Gann Level Hi Trader's .. How Are You Today ?!
Let's Take Great Trade On " US30 " On 4 Hour's Time Frame 👇👇
--------------------------------------------------------------------------
Trade Type : Long- Buy
Entry : 31640
Target : 32400 - 32800
Stop Lose : 31380
📊 After 150 Pips Profit Move Stop Lose To Entry Point For Safe 📊

Bitcoin Analyze (Short Term, Timeframe 2H)!!!🧐If we look at carefully to Bitcoin chart at the 2H timeframe, we can see the Inverted Hammer & Tweezer Bottom candlestick patterns inside the support lines.
Also, we can see Regular Divergence (RD+) in RSI Indicator.
I expect Bitcoin to go up(about ➕4%) to near the Resistance line & Monthly Pivot Point (Better, we wait for the trigger of the candlestick pattern).
❗️Note❗️: under 20720$, Bitcoin will continue to fall.
If you don't know about candlestick patterns, you can visit this post👇
Bitcoin Analyze ( BTCUSDT ) Timeframe 2H⏰
Do not forget to put Stop loss for your positions (For every position that you want to open).
Please follow your strategy, this is just my Idea, and I will be glad to see your ideas in this post.
Please do not forget the ✅' like '✅ button 🙏😊 & Share it with your friends; thanks, and Trade safe.

Bitcoin Analyze (Rising Wedge Pattern)!!!🧐Bitcoin made two rising wedges these days, breaking the lower line of the small rising wedge.
I expect Bitcoin will also break the lower line of the big rising wedge.
Also, we can see the Regular Divergence (RD-) between Price and MACD Indicator.
Bitcoin Analyze ( BTCUSDT ) Timeframe 4h⏰
Do not forget to put Stop loss for your positions (For every position that you want to open).
Please follow your strategy, this is just my Idea, and I will be glad to see your ideas in this post.
Please do not forget the ✅' like '✅ button 🙏😊 & Share it with your friends; thanks, and Trade safe.

" US30 " Sell Trade With 1500 Pips TargetGood Morning Trader's ,, Let's Explain Together " US30 " Sell Trade With 99% Accurate Area ,,
1 - Why US30 Will Down From This Area ? Because This IS Golden Area In Our Strategy And That's Order Block Area
2- How Many Pips For Target ? 1500 Pips
3- How Many Pips For Stop ? 350 Pips
4- When We Will Enter Sell ? 33000 - 33250
Don't Forget To Put Like And Comment

Bitcoin Analyze (Expanding Flat Correction)!!!😉It seems Bitcoin is making the Expanding Flat Correction at 15 min timeframe.
The Main wave C of Expanding FLat has 5 microwaves, and I tried to find the end of Main wave C in my chart.
Bitcoin Analyze ( BTCUSDT ) Timeframe 15min⏰
Do not forget to put Stop loss for your positions (For every position that you want to open).
Please follow your strategy, this is just my Idea, and I will be glad to see your ideas in this post.
Please do not forget the ✅' like '✅ button 🙏😊 & Share it with your friends; thanks, and Trade safe.

Bitcoin Analyze (Short Term, Timeframe 15min)!!!🧐Bitcoin is running in near the lower line of ascending channel and trendline.
I expect that Bitcoin goes up to the middle line zone of ascending channel and after that, it will go DOWN again.
Bitcoin Analyze ( BTCUSDT ) Timeframe 15min⏰
Do not forget to put Stop loss for your positions (For every position that you want to open).
Please follow your strategy, this is just my Idea, and I will be glad to see your ideas in this post.
Please do not forget the ✅' like '✅ button 🙏😊 & Share it with your friends; thanks, and Trade safe.

Daw Jones Us100 index harmonic patternDaw Jones,US100 and also s&p 500 bearish harmonic pattern complete, this 3 index showing reversal sign, my view maximum 1 % more up then maybe see some pullback.

Meta Platforms (Road Map)!!!🗺️Today, I want to analyze the Meta Platforms.
What are Meta Platforms ❓
Meta Platforms, Inc., doing business as Meta and formerly named Facebook, Inc., and TheFacebook, Inc., is an American multinational technology conglomerate based in Menlo Park, California. The company owns Facebook, Instagram, and WhatsApp, among other products and services.
Meta Platforms are close to the end of main wave A.
I expect Meta Platforms to grow up around the support zone (for the short term).
Meta Platforms Analyze Daily Timeframe (Log Scale /Heikin Ashi)⏰
🟢Support zone🟢: 149$ until 137$
Do not forget to put Stop loss for your positions (For every position you want to open).
Please follow your strategy, this is just my idea, and I will be glad to see your ideas in this post.
Please do not forget the ✅' like '✅ button 🙏😊 & Share it with your friends; thanks, and Trade safe.

US30-DOW JONESMove in an upward direction until reaching resistance
Then it begins to reach the target

" US30 " BUY Trade With 1500 Pips TargetPair Name : US30 - Daw Jones
Time Frame : 4 Hour's
Analysis Type : Swing Trade
--------------------------------------
➡️ Main Support Level : 29650
➡️ Main Resistance Level : 33000
➡️ Time To Entry : Long From 31250
➡️ Target : 33000
➡️ Stop Lose : On Chart

" US30 " Sell Trade With 1500 Pips TargetPair Name : US30 - Daw Jones
Time Frame : 30 Min
Analysis Type : Scalping Trade
--------------------------------------
➡️ Main Support Level : 29650
➡️ Main Resistance Level : 31850
➡️ Time To Entry : Now From 31000
➡️ Target : 29650

" US30 " Sell Trade With 500 Pips TargetPair Name : US30 - Daw Jones
Time Frame : 15 Min
Analysis Type : Scalping Trade
--------------------------------------
➡️ Main Support Level : 29700
➡️ Main Resistance Level : 37600
➡️ Time To Entry : Now From 31550
➡️ Target : 31000
➡️ Stop Lose : 31750

" US30 " Buy Trade With 2000 Pips Target Pair Name : US30 - Daw Jones
Time Frame : Weekly
Analysis Type : Swing Trade
--------------------------------------
➡️ Main Support Level : 29700
➡️ Main Resistance Level : 37600
➡️ Time To Entry : Now From 29800
➡️ Target : 1000 - 2000 Pips
➡️ Stop Lose : Close Weekly Candle Down The Area

" US30" Buy Trade ( With 1000 Pips Target )Pair Name : US30 - Daw Jones
Time Frame : 15 Min
Analysis Type : Scalping Trade
--------------------------------------
➡️ Main Support Level : 30150
➡️ Main Resistance Level : 33250
➡️ Time To Entry : After Break Out The Area On Chart
➡️ Target : 1000 Pips
➡️ Stop Lose : 250 Pips
➡️ Risk Reward : 1: 5

US30 Top-down AnalysisHello traders, this is the full breakdown of this pair. We will take this trade if all the conditions are satisfied as discussed in the analysis. Smash the like button if you find value in this analysis and drop a comment if you have any questions or let me know which pair to cover in my next analysis.

US 30 sell we have sell opportunity after breakout 32600 it will be great chance with hike interest rate by USD next week .


