DAX H4 | Pullback resistance at 61.8% Fibonacci retracementDAX (GER30) is rising towards a pullback resistance and could potentially reverse off this level to drop lower.
Sell entry is at 20,212.82 which is a pullback resistance that aligns with the 61.8% Fibonacci retracement level.
Stop loss is at 20,393.00 which is a level that sits above the 78.6% Fibonacci retracement and an overlap resistance.
Take profit is at 19,825.69 which is a pullback support.
High Risk Investment Warning
Trading Forex/CFDs on margin carries a high level of risk and may not be suitable for all investors. Leverage can work against you.
Stratos Markets Limited (www.fxcm.com):
CFDs are complex instruments and come with a high risk of losing money rapidly due to leverage. 64% of retail investor accounts lose money when trading CFDs with this provider. You should consider whether you understand how CFDs work and whether you can afford to take the high risk of losing your money.
Stratos Europe Ltd (www.fxcm.com):
CFDs are complex instruments and come with a high risk of losing money rapidly due to leverage. 66% of retail investor accounts lose money when trading CFDs with this provider. You should consider whether you understand how CFDs work and whether you can afford to take the high risk of losing your money.
Stratos Trading Pty. Limited (www.fxcm.com):
Trading FX/CFDs carries significant risks. FXCM AU (AFSL 309763), please read the Financial Services Guide, Product Disclosure Statement, Target Market Determination and Terms of Business at www.fxcm.com
Stratos Global LLC (www.fxcm.com):
Losses can exceed deposits.
Please be advised that the information presented on TradingView is provided to FXCM (‘Company’, ‘we’) by a third-party provider (‘TFA Global Pte Ltd’). Please be reminded that you are solely responsible for the trading decisions on your account. There is a very high degree of risk involved in trading. Any information and/or content is intended entirely for research, educational and informational purposes only and does not constitute investment or consultation advice or investment strategy. The information is not tailored to the investment needs of any specific person and therefore does not involve a consideration of any of the investment objectives, financial situation or needs of any viewer that may receive it. Kindly also note that past performance is not a reliable indicator of future results. Actual results may differ materially from those anticipated in forward-looking or past performance statements. We assume no liability as to the accuracy or completeness of any of the information and/or content provided herein and the Company cannot be held responsible for any omission, mistake nor for any loss or damage including without limitation to any loss of profit which may arise from reliance on any information supplied by TFA Global Pte Ltd.
The speaker(s) is neither an employee, agent nor representative of FXCM and is therefore acting independently. The opinions given are their own, constitute general market commentary, and do not constitute the opinion or advice of FXCM or any form of personal or investment advice. FXCM neither endorses nor guarantees offerings of third-party speakers, nor is FXCM responsible for the content, veracity or opinions of third-party speakers, presenters or participants.
DAX Index

#202501 - priceactiontds - weekly update - daxGood Evening and I hope you are well.
tl;dr
dax xetra: Bulls printed 5 consecutive bull bars but price went nowhere. We are still below the daily 20ema and this looks like a shallow pull-back in a bear trend. Bears need a strong close below 19800 to confirm it. If bulls close above 20000 again, bears could give up and we test higher again. Market is in breakout mode and we will see a bigger move next week. Right now I see the odds 60/40 for the bears.
comment: I don’t have anything to add to my tl;dr paragraph.
current market cycle: Bull trend or trading range. Only a daily close below 19600 would be my confirmation for the trading range.
key levels: 19600 - 20100 (below 19600, 19000/19200 come into play / above 20100, 20400 or higher is possible again)
bull case: Bulls are preventing the market from making a new low for now but they fail to close daily bars above 20000. Once they do that again with follow-through, they likely took control of the market again and we could expect higher prices above 20200 again. Their first target above 20000 is to close the bear gap to 20240 and above that there is no more resistance until 20400.
Invalidation is below 19600.
bear case: Bears are doing good in keeping the market below 20000 which is the most important price for both sides. I still favor the bears to get a second leg down to 19200/19400 but those odds will only rise if we close below 19600. Market is currently in balance.
Invalidation is above 20100.
short term: Slightly bearish but once this goes with some momentum above 20000 again that bearish bias is gone. Bears have the setup here and now and if they fail to break down below 19600 early next week I will view this as neutral or bullish if we go above 20100.
medium-long term from 2024-12-22: Any short near 20000 is reasonable if you can hold for another 1000 points higher. 17000 is much more likely than 21000 though. My first target for the next months is 19000, followed by 17700ish and ultimately down to 16000-16300 in 2025.
current swing trade: None
chart update: Added bear gap and still having my preferred path down as a two legged correction down to 19000.

DAX // risky phase of the correctionThe market has printed a deep correction of the last weekly impulse.
The correction fibo 61.8 is already done, and we may be heading towards the 78.6
There is a clean (not yet tested) H1 breakout, where entry signals have some chance, but don't forget, we are deep into the correction, where the accumulation phase may be built up with frequent changes in direction.
———
Orange lines represent impulse bases on major timeframes, signaling the direction and validity of the prevailing trend by acting as key levels where significant momentum originated.
———
Stay grounded, stay present. 🏄🏼♂️
<<boost🚀 if you enjoy💚

DAX H1 | Potential bullish reversalDAX (GER) is falling towards a swing-low support and could potentially bounce off this level to climb higher.
Buy entry is at 19,771.69 which is a swing-low support.
Stop loss is at 19,640.00 which is a level that lies underneath a swing-low support.
Take profit is at 20,020.69 which is a multi-swing-high resistance.
High Risk Investment Warning
Trading Forex/CFDs on margin carries a high level of risk and may not be suitable for all investors. Leverage can work against you.
Stratos Markets Limited (www.fxcm.com):
CFDs are complex instruments and come with a high risk of losing money rapidly due to leverage. 64% of retail investor accounts lose money when trading CFDs with this provider. You should consider whether you understand how CFDs work and whether you can afford to take the high risk of losing your money.
Stratos Europe Ltd (www.fxcm.com):
CFDs are complex instruments and come with a high risk of losing money rapidly due to leverage. 66% of retail investor accounts lose money when trading CFDs with this provider. You should consider whether you understand how CFDs work and whether you can afford to take the high risk of losing your money.
Stratos Trading Pty. Limited (www.fxcm.com):
Trading FX/CFDs carries significant risks. FXCM AU (AFSL 309763), please read the Financial Services Guide, Product Disclosure Statement, Target Market Determination and Terms of Business at www.fxcm.com
Stratos Global LLC (www.fxcm.com):
Losses can exceed deposits.
Please be advised that the information presented on TradingView is provided to FXCM (‘Company’, ‘we’) by a third-party provider (‘TFA Global Pte Ltd’). Please be reminded that you are solely responsible for the trading decisions on your account. There is a very high degree of risk involved in trading. Any information and/or content is intended entirely for research, educational and informational purposes only and does not constitute investment or consultation advice or investment strategy. The information is not tailored to the investment needs of any specific person and therefore does not involve a consideration of any of the investment objectives, financial situation or needs of any viewer that may receive it. Kindly also note that past performance is not a reliable indicator of future results. Actual results may differ materially from those anticipated in forward-looking or past performance statements. We assume no liability as to the accuracy or completeness of any of the information and/or content provided herein and the Company cannot be held responsible for any omission, mistake nor for any loss or damage including without limitation to any loss of profit which may arise from reliance on any information supplied by TFA Global Pte Ltd.
The speaker(s) is neither an employee, agent nor representative of FXCM and is therefore acting independently. The opinions given are their own, constitute general market commentary, and do not constitute the opinion or advice of FXCM or any form of personal or investment advice. FXCM neither endorses nor guarantees offerings of third-party speakers, nor is FXCM responsible for the content, veracity or opinions of third-party speakers, presenters or participants.

2024-01-01 - priceactiontds - daily update - daxGood Evening and happy new year.
comment: Xetra (futures are currently trading 143 points higher) closed the year 2024 below 20000 and bulls could not get a decent bounce during the most bullish days of the year. My base assumption for the next days/weeks is a bigger second leg down which will leave no doubt that this bull trend is over and investors would be lucky to see 2025 close near 20000. There is a much greater chance of a decent bear year where market corrects a big chunk of the past 2 years and then moves sideways for the rest of the year.
current market cycle: trading range
key levels: 19600 - 20200
bull case: Very weak price action by the bulls the past week. We have a big open gap between 20032 - 20241 and until bulls close that, bears are in control. If bulls manage to close above 20000 again, the odds of closing the gap will be good. We have the start of 2025 and you never know which side it will turn. Both 2023 and 2024 saw huge inflows and the start of the year also marked the low of the year. Bulls hope this time will be the same but I have big doubts about that.
Invalidation is below 19800.
bear case: Bears are in control. Decent two-legged pullback after the sell-off, we are trading below the daily 20ema and the bull bars last week were bad buys for the bulls. Bears expect a bigger profit taking to take place over the next days and another leg down to at last 19200 or even 19000. Their next target is a close below the breakout point 19660 to confirm the first leg and I doubt many bulls will hold long below 19600 because we could go and test the bull trend line around 19200. I can’t see this breaking much below 19000 for now because that price was tested so much between October and December, that we will likely go sideways there for many days.
Invalidation is above 20150.
short term: Neutral around 19900. Bearish below 19800 and uber bearish below 19600 for 19200 or lower.
medium-long term from 2024-12-22: Any short near 20000 is reasonable if you can hold for another 1000 points higher. 17000 is much more likely than 21000 though. My first target for the next months is 19000, followed by 17700ish and ultimately down to 16000-16300 in 2025.
current swing trade: None
trade of the day: Market was closed

DAX TODAYDAX TODAY is buy at the moment but.......
For me DAX start to deeper down.
On screen you see my view at the moment

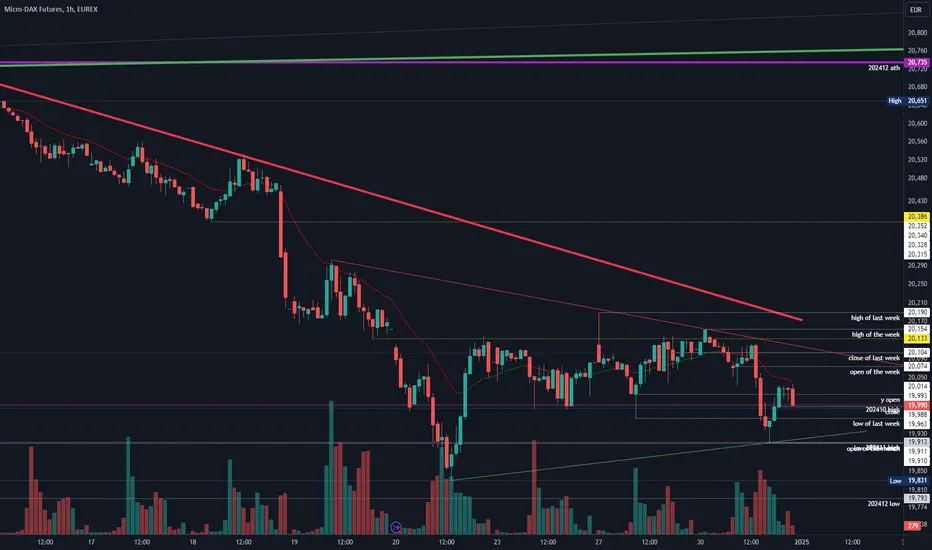
2024-12-30 - priceactiontds - daily update - daxGood Evening and I hope you are well.
tl;dr
dax futures - Neutral between 20000 - 20100, Bearish below 20000. Bears tried to break down the bear flag and make new lows but failed above 19900 and bulls retraced 50% of it. Good for bears is that they kept the 1h 20ema resistance and xetra closed the year below 20000, which is a sell signal going into January. Bulls did a good job at retracing more than 50% of the sell-off the keeping it above 20000. Market formed a triangle so buy low and sell high inside it. Below 19900 we could see an acceleration downwards and I see the chance of that happening much greater than going above 20160 again.
comment: Xetra closed below 20000 and that was very important for the bears. The December bar is now a nasty reversal bar and once we make new lows below 19800, bulls can’t hold long since we could easily pull back down to 19100 - 19400.
current market cycle: trading range
key levels: 19800 - 20200
bull case: Bulls do not have much going for them currently, other than keeping the market close to 20000 and that means above the breakout price for the recent bull leg. They have to keep this above 19800 or this bull leg was indeed the exhaustive end of this bull trend and market will test lower. Bulls would need a daily bull bar closing above 20000 to begin with.
Invalidation is below 19800.
bear case: Bears are in control but not as strong as I hoped they would be. Daily bear bars all have tails below but at least bears have now printed 5 consecutive bear bars. This looks clearly like a bear flag about to break down after the strong selling from 20500 down to 19800. Confirmation would be a daily close below 19800 and bears next target then is 19500 and testing the bull trend line. Bulls would have to break above two bear trend lines to start making the market neutral again.
Invalidation is above 20160.
short term: Neutral around 20000. Bearish below 19990 and uber bearish below 19900 for 19800 or lower.
medium-long term from 2024-12-22: Any short near 20000 is reasonable if you can hold for another 1000 points higher. 17000 is much more likely than 21000 though. My first target for the next months is 19000, followed by 17700ish and ultimately down to 16000-16300 in 2025.
current swing trade: None
trade of the day: Selling the pull-back at 20100 down to 19900 was good. Buying 19900 second best trade today.
DAX H4 | Falling to overlap supportDAX (GER30) is falling towards an overlap support and could potentially bounce off this level to climb higher.
Buy entry is at 19,678.29 which is an overlap support that aligns with the 50.0% Fibonacci retracement level.
Stop loss is at 19,446.00 which is a level that lies underneath a pullback support and the 61.8% Fibonacci retracement level.
Take profit is at 20,002.09 which is an overlap resistance that aligns with the 38.2% Fibonacci retracement level.
High Risk Investment Warning
Trading Forex/CFDs on margin carries a high level of risk and may not be suitable for all investors. Leverage can work against you.
Stratos Markets Limited (www.fxcm.com):
CFDs are complex instruments and come with a high risk of losing money rapidly due to leverage. 64% of retail investor accounts lose money when trading CFDs with this provider. You should consider whether you understand how CFDs work and whether you can afford to take the high risk of losing your money.
Stratos Europe Ltd (www.fxcm.com):
CFDs are complex instruments and come with a high risk of losing money rapidly due to leverage. 66% of retail investor accounts lose money when trading CFDs with this provider. You should consider whether you understand how CFDs work and whether you can afford to take the high risk of losing your money.
Stratos Trading Pty. Limited (www.fxcm.com):
Trading FX/CFDs carries significant risks. FXCM AU (AFSL 309763), please read the Financial Services Guide, Product Disclosure Statement, Target Market Determination and Terms of Business at www.fxcm.com
Stratos Global LLC (www.fxcm.com):
Losses can exceed deposits.
Please be advised that the information presented on TradingView is provided to FXCM (‘Company’, ‘we’) by a third-party provider (‘TFA Global Pte Ltd’). Please be reminded that you are solely responsible for the trading decisions on your account. There is a very high degree of risk involved in trading. Any information and/or content is intended entirely for research, educational and informational purposes only and does not constitute investment or consultation advice or investment strategy. The information is not tailored to the investment needs of any specific person and therefore does not involve a consideration of any of the investment objectives, financial situation or needs of any viewer that may receive it. Kindly also note that past performance is not a reliable indicator of future results. Actual results may differ materially from those anticipated in forward-looking or past performance statements. We assume no liability as to the accuracy or completeness of any of the information and/or content provided herein and the Company cannot be held responsible for any omission, mistake nor for any loss or damage including without limitation to any loss of profit which may arise from reliance on any information supplied by TFA Global Pte Ltd.
The speaker(s) is neither an employee, agent nor representative of FXCM and is therefore acting independently. The opinions given are their own, constitute general market commentary, and do not constitute the opinion or advice of FXCM or any form of personal or investment advice. FXCM neither endorses nor guarantees offerings of third-party speakers, nor is FXCM responsible for the content, veracity or opinions of third-party speakers, presenters or participants.

Falling towards 50% Fibonacci support?DAX40 (DE40) is falling towards the pivot which has been identified as a pullback support and could bounce to the 1st resistance which is a pullback resistance.
Pivot: 19,681.24
1st Support: 19,244.23
1st Resistance: 20,427.78
Risk Warning:
Trading Forex and CFDs carries a high level of risk to your capital and you should only trade with money you can afford to lose. Trading Forex and CFDs may not be suitable for all investors, so please ensure that you fully understand the risks involved and seek independent advice if necessary.
Disclaimer:
The above opinions given constitute general market commentary, and do not constitute the opinion or advice of IC Markets or any form of personal or investment advice.
Any opinions, news, research, analyses, prices, other information, or links to third-party sites contained on this website are provided on an "as-is" basis, are intended only to be informative, is not an advice nor a recommendation, nor research, or a record of our trading prices, or an offer of, or solicitation for a transaction in any financial instrument and thus should not be treated as such. The information provided does not involve any specific investment objectives, financial situation and needs of any specific person who may receive it. Please be aware, that past performance is not a reliable indicator of future performance and/or results. Past Performance or Forward-looking scenarios based upon the reasonable beliefs of the third-party provider are not a guarantee of future performance. Actual results may differ materially from those anticipated in forward-looking or past performance statements. IC Markets makes no representation or warranty and assumes no liability as to the accuracy or completeness of the information provided, nor any loss arising from any investment based on a recommendation, forecast or any information supplied by any third-party.

DAX // minor long trendThe correction of the daily short impulse on H4 forms the minor long that that is valid.
The main H4 breakdowns (aqua) and the daily breakdown zone (orange) are the targets of this long trend, but it is a minor one, so it can turn south any time, and if the H4 impulse base is crossed down significantly, the next targets become valid in the short countertrend.
———
Orange lines represent impulse bases on major timeframes, signaling the direction and validity of the prevailing trend by acting as key levels where significant momentum originated.
———
We may not know what will happen, but we can prepare ourselves to respond effectively to whatever unfolds.
Stay grounded, stay present. 🏄🏼♂️
Your comments and support are appreciated! 👊🏼

DAX Rebound Ahead! Buy!
Hello,Traders!
DAX is trading in a strong
Long-term uptrend and
Has made a local bearish
Correction but as the price
Is about to retest the horizontal
Support level of 19,600 we
Will be expecting a rebound
And a further bullish continuation
Buy!
Comment and subscribe to help us grow!
Check out other forecasts below too!

2024-12-23 - priceactiontds - daily update - daxGood Evening and I hope you are well.
tl;dr
dax futures - Neutral. Bears defended the Globex gap and market stayed below the lower bear trend line, which we broke below on Thursday. Very good for the bears but since we opened and closed near Friday’s close, market is in balance for now. Bears need to break below 20000 and bulls above 20150. Clear support and resistance, so play the range or wait for a breakout.
comment: Let’s try not to extrapolate more from today’s price action than there was. Open was 40 points below Friday’s close and US session closed 10 points above the EU open.
current market cycle: trading range
key levels: 19800 - 20200
bull case: Bulls stopped the selling near the 50% retracement of Friday’s bull leg. Until they get a 1h bar close above 20150, the market is as neutral as it gets. Above 20150 there probably won’t be any resistance until 20250ish or even 20300.
Invalidation is below 19970.
bear case: Bears have going for them that they kept it below the channel we broke below from and below Friday’s high, which means we have an open Globex gap. Problem they have is that they tried 3 times to get below 19990 today and failed. Now market has made two credible higher lows and bears can not hold short once we get above 20140.
Invalidation is above 20140.
short term: Neutral around 20050. Very bullish above 20150 and bearish only below 19980.
medium-long term from 2024-12-22: Any short near 20000 is reasonable if you can hold for another 1000 points higher. 17000 is much more likely than 21000 though. My first target for the next months is 19000, followed by 17700ish and ultimately down to 16000-16300 in 2025.
current swing trade: None
trade of the day: Selling 20060 and buying 20000 was good for much more trades than you should take.

DAX POTENTIAL LONG|
✅EUR_USD is going down now
But a strong support level is ahead at 19,600
Thus I am expecting a rebound
And a move up towards the target at 20,000
LONG🚀
✅Like and subscribe to never miss a new idea!✅

#202451 - priceactiontds - year end special - daxGood Evening and I hope you are well.
dax xetra - outlook 2025
comment: We look at the chart from the beginning of the current bull trend in 2022-10. Dax has gained 71% while German GDP is now negative for two consecutive years. The bull trend has 3 clear and big legs up. The upper and lower trend lines were respected and we have seen an acceleration upwards in the last leg. This is not the start of a new and stronger one but the climactic ending which traps the weak & late traders. These are the people who started gambling with Bitcoin as it hit 100k because they wanted some of that fairy dust.
A healthy correction would be around 20% which is very close to the 50% retracement of this whole trend, the 2023-11 previous ath and the big bull trend line from the Covid lows. More than enough magnets to test down to that price around 16000. How will we get there? Absolutely no idea and all of my drawings with a potential wave series, are just rough guesses how I think it could potentially play out. Sometimes those are accurate and other times they are way off. It’s a good habit of anticipating what markets could do and take the trade if they do it.
Final thoughts. Buying the dax above 19000 hoping for a new and stronger trend upwards because surely this time it’s different, is as unwise as can be if you want to invest your money. Meaning buying and holding or trading on a daily/weekly chart. The odds of this breaking above two major trend lines while we already made 70%+ without any meaningful correction, are so slim that the only reason your are doing it is because of FOMO.
current market cycle: Bull trend of the past two years has likely ended and new lows below 18780 will be the confirmation.
key levels for 2025: 16000 - 20000 (decent chance we will see 20000 only in the first couple of weeks and then only in a couple of months or years again)
bull case: 2 years, 70%+. What more can you dream of? No matter how you draw your technicals on the chart, you can only see this as bullish, if you think we can break strongly above the two upper trend lines and go for 25000 or more. That is trading on hope and nothing else. If you have bought any dip the past two years you were never wrong and that is why we have so many articles about “this time it’s different”. In a bull trend, everyone is a genius. I can not come up with any legitimate reason why this should go meaningful above 20600. The absolute best I can do for this section is that we will likely see a lot of sideways price action at the big magnets. 19000 will be the first over the next days/weeks and at this point, we can’t expect the bulls to just give and let the market melt through those prices. BTFD mentality has been profitable and it will take a while or a huge drop, before it ends and we shift to STR (sell the rips).
Invalidation is below 14600. Below that price, an event has happened or is happening. For now it’s unreasonable to ever think this market could see prices below 12000 again.
bear case: Peak bullish sentiment and option positions over the past weeks can only go on for so long before the market reverses big time. It’s perhaps because there is literally no one left to buy because everyone and their dog went max long. The chart is clear and the downside risks are much greater than any coke-induced perma-bull argument on why the markets will break higher another 10-20%.
Bears short term targets are the weekly 20ema near the small bull trend line around 19000. There we can probably expect more sideways movement before we get another impulse down to the huge support around 17700. My chart is a best guess about price but the timing could be way off. My biggest target for 2025 is the 2011-11 previous ath 16290, which is very close to the 50% retracement of this bull trend. There is also the big bull trend line from the Covid low and I expect this to be tested in Q1 or Q2 2025.
Invalidation is above 20700.
short term: The year end rally could give us another new ath or lower high. It does not matter because the upside will probably be very limited. My highest price is 20700 give or take. I fully expect 19000 to be hit over the next 2-6 weeks.
medium-long term: Any short near 20000 is reasonable if you can hold for another 1000 points higher. 17000 is much more likely than 21000 though. My first target for the next months is 19000, followed by 17700ish and ultimately down to 16000-16300 in 2025.
current swing trade: None but I think any short ETF, levered or not, is reasonable. Short term is 19000 and medium term (2-5 months) is 17000-18000.

DAX - short term correction currently very Overbought!Hi guys, we are following up with our next opportunity DAX :
Currently it has been perfoming fantastic as being part of the biggest Economy in Europe, and it reached a glorious All time High, following up with the western Indices , SP500,NASDAQ100 and Dow Jones. Currently the price has reached a very overbought level based on the RSI check on 1H time frame and 4H time frame, so for the time being I am looking into a short term correction with a follow up to maybe break down the current all time high and get passed it.
Entry : 20,400
Target : 19,916
Let's see how things are going to formulate and move from there.
As always my friends happy trading!
P.S. If you have questions or inquiries about one of my existing set-ups or personal questions / 1 on 1 sessions consider joining my channel so you can follow up with me in private!

2024-12-19 - priceactiontds - daily update - daxGood Evening and I hope you are well.
tl;dr
dax futures - Neutral. Bears confirmed the sell-off and bears are hoping for a second leg down. I lean to closing tomorrow near 20000 instead of a big second leg down tomorrow but I am open to surprises. Anything above 20150 would surprise me.
comment : Bear confirmation and I got 2 measured move targets between 19750 and 19800. Can we get there tomorrow? Possible but not likely I think. We saw decent buying above 19900 and I think it’s more reasonable to expect a close of the week around 19950 - 20000. If bear gap from 20100 - 20200 stay open for the whole 100 points, it would show great bear strength and we could expect a bigger second leg down. Base case for me tomorrow is chop from hell.
current market cycle: trading range
key levels: 19800 - 20200
bull case: Bulls tried multiple times and market still closed the US session at the lows. Best bulls can hope for tomorrow is to prevent the second leg down and stay above 19900.
Invalidation is below 19900.
bear case: Follow-through selling by the bears which is nice. For now I think it’s more reasonable for bears to take profits going into quad witching and that’s probably why we saw a bigger trading range today. Look at the 1h 20ema and if it continues to be resistance.
Invalidation is above 20200.
short term: Neutral around 20000 and very bearish below 19900. I expect this week to close a bit below 20000 and anything below 19900 would surprise me.
medium-long term - Update from 2024-12-15: Will write a new outlook for 2025 next week.
current swing trade: None
trade of the day: Chop chop. Best trade was probably selling the double top bar 54 (prev high was bar 35).

2024-12-18 - priceactiontds - daily update - daxGood Evening and I hope you are well.
tl;dr
dax futures - Neutral. Big up, big down, big confusion. Can the selling continue and accelerate? Yes. Can we also see a bigger bounce from 20000? Also yes. Not as easy to trade as you might think because bounces can be big and you have to trade really small. Huge volatility is not the time to swing for the fences. 19802 is the next target for bears (breakout retest) and chances are good that we get there. 20000 is a very important number and that is why the path leading down to 19800 could be choppier than your account is comfortable with.
comment : Bull trend is likely over and I will give my bigger outlook on the next weekly update. US session closed it around 20000 and that price is the obvious magnet. 1h close below brings 19800 in play but it’s also possible that we bounce from here. Selling was strong enough that the best bulls can get over the next days is some sideways movement. Don’t short the hole. We have quad witching this week and markets can always do a huge pullback.
current market cycle: bull trend is very likely over - expecting more sideways until end of 2024 before the real selling can begin
key levels: 19800 - 20400
bull case: Bulls could be running for the exits to secure the profits. It’s hard to tell in quad witching weeks because prices tend to get distorted. In any case the upside will very likely be limited now. Best bulls can hope for tomorrow is sideways around 20000. Any bounce above 20200 would surprise me.
Invalidation is below 19800.
bear case: Huge day for the bears and they want to accelerate this down to trap many late bulls. 19800 is the breakout retest and their next target. If we drop below, this could get really nasty. 19600 is close to the big bull trend line and other markets have already broken theirs, so it could happen this week. If you still have long positions, I would not hope for a huge year end rally and just get out.
Invalidation is above 20400.
short term: Neutral around 20000. Bears need follow through down to 19800 and they can get it but always remember, markets can have huge pullbacks and huge volatility comes with big risk, so trade small.
medium-long term - Update from 2024-12-15: Will write a new outlook for 2025 next week.
current swing trade: None
trade of the day: Choppy EU session and it closed near the open. FOMC totally changed the markets and now it comes down to tomorrow’s follow through by the bears. No trade of the day. You could not have known what Jpow says and how markets react. Don’t fool yourself.

DAX/GER - HOPE YOU CHECK LAST SHORT TRADETeam, with DAX
last week, we suggested shorting at 20515-25, and we reached 3 of our target
Today, we find an opportunity to go to LONG DAX at 20208-20215
STOP LOSS at 20182 - extension to 20165
Target at 20245-56 - please take partial and bring stop loss to BE
Target 2 at 20272-83

2024-12-17 - priceactiontds - daily update - daxGood Evening and I hope you are well.
tl;dr
dax futures - Neutral. Third consecutive bear bar on the daily chart but the selling is weak. Bears barely push the market down and we are still 200 points above 20000. The bear channel held but chances are decent that it breaks tomorrow and we either go more sideways 20200 - 20400 or test 20500 again.
comment: Bears made new lows, which is nice but the pullback is still minor on the daily chart. Anything below 20200 would surprise me and then we could see some acceleration down to 20000. Much more likely is a break of the bear trend line around 20300 and a retest of 20500+
current market cycle: bull trend but very late and will end soon
key levels: 20000 - 20500
bull case: Bulls buying all the dips and it’s probably just a matter of time when the bears give up again. All bear bars below 20300 look weak and bears have tried 6 times now to break below the channel and have failed. Bullish targets for tomorrow are 20300, 20370 and then 20500.
Invalidation is below 20200.
bear case : Bears are trying but getting nowhere. Best they can hope for tomorrow is sideways between 20200 - 20300. How likely is it that Jpow grows some, tells the markets they are insane and no more rate cuts? Yeah.
Invalidation is above 20600.
short term: Neutral 20200 - 20300. Bullish above for 20400 or higher. Bearish below 20200 for 20000.
medium-long term - Update from 2024-12-15: Will write a new outlook for 2025 next week.
current swing trade: None
trade of the day: Buying the open and then selling at the bear trend line. The move down accelerated at a weird time and price, so I cut my profitable shorts too early. FML.

Mastering the German 40 Index: A Comprehensive Trading Strategy 👀👉 In this detailed video, I examine the complexities of trading the German 40 Index (DAX), sharing my personal trading plan and strategies aimed at identifying lucrative trade opportunities. Most importantly, my goal is to provide you with the essential tools to effectively navigate the indices markets. 📈✨
KEY HIGHLIGHTS:
✅ Trading Strategy Overview: I outline a structured approach to planning trades and identifying optimal trading opportunities.
✅ Technical Analysis Techniques: We explore concepts such as Wyckoff Theory and ICT (Inner Circle Trader) principles, emphasizing their application in real-world trading scenarios.
✅ Timeframe Analysis: The video guides you through analyzing higher timeframes to inform lower timeframe entries, ensuring a well-rounded trading strategy.
✅ Entry Points & Risk Management: Learn how to pinpoint entry points, set effective stop-loss orders, and establish profit targets to maximize your trading success. 🎯
✅ TradingView Features: I highlight essential features of TradingView, showcasing two advanced indicators: the Volume Profile and VWAP (Volume Weighted Average Price), which are crucial for intraday analysis and understanding market trends. 📊
🔔 Disclaimer: Trading involves risk and may not be suitable for all investors. Past performance is not indicative of future results. Always conduct thorough research and consider your financial situation before engaging in trading activities.
Join me on this journey to enhance your trading skills and gain valuable insights into the German 40 Index! Don't forget to comment and if you found the info of value, giving this post a BOOST would be awesome! 🙏

DAX H1 | Bearish downturn to extend further?DAX (GER30) could rise towards an overlap resistance and potentially reverse off this level to drop lower.
Sell entry is at 20,321.48 which is an overlap resistance that aligns with the 23.6% Fibonacci retracement level.
Stop loss is at 20,380.00 which is a level that sits above the 38.2% Fibonacci retracement level and an overlap resistance.
Take profit is at 20,200.37 which is a pullback support that aligns close to the 127.2% Fibonacci extension level.
High Risk Investment Warning
Trading Forex/CFDs on margin carries a high level of risk and may not be suitable for all investors. Leverage can work against you.
Stratos Markets Limited (www.fxcm.com):
CFDs are complex instruments and come with a high risk of losing money rapidly due to leverage. 64% of retail investor accounts lose money when trading CFDs with this provider. You should consider whether you understand how CFDs work and whether you can afford to take the high risk of losing your money.
Stratos Europe Ltd (www.fxcm.com):
CFDs are complex instruments and come with a high risk of losing money rapidly due to leverage. 66% of retail investor accounts lose money when trading CFDs with this provider. You should consider whether you understand how CFDs work and whether you can afford to take the high risk of losing your money.
Stratos Trading Pty. Limited (www.fxcm.com):
Trading FX/CFDs carries significant risks. FXCM AU (AFSL 309763), please read the Financial Services Guide, Product Disclosure Statement, Target Market Determination and Terms of Business at www.fxcm.com
Stratos Global LLC (www.fxcm.com):
Losses can exceed deposits.
Please be advised that the information presented on TradingView is provided to FXCM (‘Company’, ‘we’) by a third-party provider (‘TFA Global Pte Ltd’). Please be reminded that you are solely responsible for the trading decisions on your account. There is a very high degree of risk involved in trading. Any information and/or content is intended entirely for research, educational and informational purposes only and does not constitute investment or consultation advice or investment strategy. The information is not tailored to the investment needs of any specific person and therefore does not involve a consideration of any of the investment objectives, financial situation or needs of any viewer that may receive it. Kindly also note that past performance is not a reliable indicator of future results. Actual results may differ materially from those anticipated in forward-looking or past performance statements. We assume no liability as to the accuracy or completeness of any of the information and/or content provided herein and the Company cannot be held responsible for any omission, mistake nor for any loss or damage including without limitation to any loss of profit which may arise from reliance on any information supplied by TFA Global Pte Ltd.
The speaker(s) is neither an employee, agent nor representative of FXCM and is therefore acting independently. The opinions given are their own, constitute general market commentary, and do not constitute the opinion or advice of FXCM or any form of personal or investment advice. FXCM neither endorses nor guarantees offerings of third-party speakers, nor is FXCM responsible for the content, veracity or opinions of third-party speakers, presenters or participants.

#202450 - priceactiontds - weekly update - daxtl;dr
dax xetra: Market has printed the most shallow two-legged pullback imaginable and this is as bullish as it gets. Are bulls getting stopped by at least 2 upper trend lines which could continue to be resistance? I highly doubt it. If we get above 20600, there is no reason to not just go to 21000 or higher. I have two potential measured moves above 21000 but until we have a daily close above 20800, there is no reason to look for targets that high. Bears can only begin to dream again with a daily close below 20000.
Quote from last week:
comment: Late bull breakout during the week like the week before that. Another clear buying signal going into next week. There is not much to add from my tl;dr. Both of my upper bull trend lines run through 20k and I have multiple measured move targets there. More than enough reasons to be bullish and look for longs. Bears can do almost nothing to change my mind, unless we see on giant bear bar closing below 19100 on Monday.
comment: Since the market did not go down even the slightest, we can not hold any other thoughts than bullish ones. I won’t do anything other than small scalps on this though. On my chart I have marked the most extreme cases to either direction for the next 3 weeks. I give the bearish one a chance of at max 30% while the bulls are heavily favored to either move higher or at least sideways only. I can’t really imagine reaching 21500+ but that’s the biggest measured move I have calculated. I do think 21k and then sideways is the most reasonable outlook.
current market cycle: Bull trend - parabolic rally which is the very end.
key levels: 20000 - 21000
bull case: Bulls send a strong message, closing Opex above 20000, so they remain in full control and 21000 has become a possibility for the next 3 weeks. We are still trading near at least 2 upper bull trend lines but since market is not showing big reactions to the downside, we can only expect higher prices. A daily close above 20500 brings 21000 in play.
Invalidation is below 19100.
bear case: The pullback did not manifest at all and even if bears get this down to 20000 next week, I think we find way more buyers then sellers at that price. Bears really have no arguments at all on their side, besides the upper trend lines which are above us but at this point, I doubt they will be much resistance going into the next 3 weeks. Only thing that would make me more neutral would be a really strong bear bar closing below 20000 tomorrow. If bears somehow manage to do that, we could test down to my C target from last week, which is the breakout price around 19670. For now, I won’t look for shorts unless we see a huge volume increase on strong follow through-selling.
Invalidation is above 20500.
outlook last week:
short term: No more bullish outlooks. I want to see big juicy red bars and people posting on x about “buying opportunity of a lifetime” while they double down all the way back to 19000. Neutral until bears come around. No interest in buying anything above 20100 as of now. 20k might be a decent long scalp for a quick bounce.
→ Last Sunday we traded 20384 and now we are at 20405. Perfect outlook, given I was neutral until bears would come around. They did not and market went nowhere on the week.
short term: Given that we are in the most bullish season of the year and bears could not even get the market to drop into Opex, I can not hold any bearish wishful thought anymore and I will only look for small long scalps over the next 3 weeks. Daily close below 20000 would make me reevaluate.
medium-long term - Update from 2024-12-15: Will write a new outlook for 2025 next week.
current swing trade : None
chart update: Added potential measured move higher.

2024-12-12 - priceactiontds - daily update - daxGood Evening and I hope you are well.
tl;dr
dax futures - Neutral. Bulls tried 4 times to push above 20450 and failed. Bears did not take advantage and we printed higher lows. As of now it looks like 20400 is the neutral price for tomorrow but I expect a bigger range to both sides before we settle probably somewhere around 20400 again. Any close at the extremes to either side would surprise me.
comment: Clear trading range 20300 - 20500 until we strongly break above or below. For tomorrow I think we can do a retest of the ath 20506 and maybe even a breakout below the channel and test 20350 or lower. I do not expect the week to close to at either extreme. 20400 is the 50% of the current range and the biggest magnet for now. Tomorrow is quad witching. So don’t mess up your trading week getting trapped.
current market cycle: bull trend but very late and will end soon
key levels: 20000 - 20500
bull case: Market is not finding enough buyers above 20450 but bulls are still eager to not let the market make lower lows.
Invalidation is below 20300.
bear case: Bears are content with selling 20450 and that’s about it. We are far above the daily 20ema and bears have only printed 2 daily doji bars. That’s as weak as it gets. Higher prices are still possible. Only a daily close below 20k would help their case. On the 1h chart one could argue that we had 3 legs up inside the current bull channel and market is free to test lower but where are the consecutive strong bear bars? Bears are weak.
Invalidation is above 20520.
short term: Mostly neutral but we are making higher lows and higher highs. Expecting a bigger range for tomorrow but any close above 20500 or below 20380 would surprise me.
medium-long term - Update from 2024-12-02: 20000 hit, hope you listened. This market is beyond overvalued and will drop 30-50% in the next 5 years. I have no doubts about that. That fact should not be relevant to your current trading at all. Now it’s about being patient and waiting for the profit taking to start.
current swing trade: None
trade of the day: Buy low sell high inside range or just don’t trade at all. Atrocious day.
