DAX (Ger40): Defying Global TensionsDespite all this tariff drama, the DAX hit another record high. What gives? Markets seem to be betting that Trump enjoys the threat of tariffs more than the implementation. Some traders are pricing in yet another extension beyond the August 1 deadline.
The DAX is riding momentum from both global AI enthusiasm, thanks to Nvidia’s $4 trillion market cap milestone, and the assumption that European exporters might dodge the worst of Trump’s trade penalties, at least for now. However, this rally is precarious. If a tariff letter hits Brussels, or copper tariffs ripple into industrial demand expectations, we could see a swift correction.
Technically, near term resistance is sitting around. 24,700. However as stated, should sentiment change. A correction back down, to the support level at 24,200, which also aligns with the 50 Fibonacci retracement level, could be on the cards. Or even all the way down to 23,800, aligning with the 88% Fibonacci level.
DAX Index

DAX flirts with ATHs againAfter breaking out of the triangle formation a couple of days ago, the DAX is now flirting with the previous record hit in early June at 24490. With Trump's tariffs uncertainty at the forefront again, there is a possibility we could potentially see a double top or a false break reversal formation here, so do watch out for that. However, we will continue to focus on the long side until we see an actual, confirmed, reversal. With that in mind, dip-buying remains the preferred trading strategy.
Key support levels to watch:
24,278, marking yesterday's high
24,176, broken resistance from last week
23,927, the base of this week's breakout
The technical picture would turn bearish in the event we go back below the support trend of the triangle pattern.
In terms of upside targets,
24,750, marking the 127.2% Fib extension of the big drop from March
24,890, marking the 127.2% Fib extension of the most recent drop from June high
25,000, the next big psychological level
By Fawad Razaqzada, market analyst with FOREX.com

2025-07-08 - priceactiontds - daily update - daxGood Evening and I hope you are well.
comment: Not many times a month where the chart is as clear as this one. Every pattern can fail but you have to take these setups because they work more than they fail. Market is clearly refusing to go down, so don’t try to short it yet.
current market cycle: trading range - bull trend on the 1h tf
key levels: 23600 - 24700
bull case: Bulls want a retest of 24500+ and today they got a clear breakout above the prior high and stayed there. They have all the arguments on their side to test the ath. Only thing they could stop this is a news event.
Invalidation is below 23860.
bear case: Bears kinda gave up. Channel is tight and looking for shorts in these channels is not a good strategy. Above 24400 bears have to cover again since the obvious target is 24500+. Bears basically have nothing here. No matter what you think of we where should trade.
Invalidation is above 24400.
short term: Can only be bullish. Any long has stop 24170
medium-long term from 2025-06-29: Bull surprise last week but my targets for the second half of 2025 remain the same. I still expect at least 21000 to get hit again this year. As of now, bulls are favored until we drop below 23000
trade of the day: Buying any pullback was good. Most obvious one was the double bottom on EU open, right at the 1h 20ema.
DAX: Target Is Up! Long!
My dear friends,
Today we will analyse DAX together☺️
The in-trend continuation seems likely as the current long-term trend appears to be strong, and price is holding above a key level of 24,193.11 So a bullish continuation seems plausible, targeting the next high. We should enter on confirmation, and place a stop-loss beyond the recent swing level.
❤️Sending you lots of Love and Hugs❤️

Make German Index Great Again? DAX Moves in Silence While the World Screams 📊⚡
It’s loud out there — tariffs flying, currencies shifting, old alliances shaking.
We’ve got Trump hinting at tariffs against U.S. allies and China, the Euro flexing, the dollar facing devaluation talk, and a tangled mess of energy politics with Russia and Germany in the middle. All of this creates layers of macro uncertainty…
But in the middle of all that chaos?
📈 The chart speaks. And it’s speaking clearly.
🎯 What We’re Watching
On the 8H and 30M chart, DAX has printed a beautiful technical structure. And regardless of how things unfold on the political stage, the price action is offering us a clean framework.
🔹 Key S/R at 20,552
We are hovering around this pivotal level. Above it? Bulls regain control. Below it? Things get choppy, fast.
🔹 Main Support: 18,896
This is the level to hold. It’s structurally valid and tested. A break below here triggers the deeper scenario.
🔹 Scenario Breakdown:
Bullish Case (60%) — If 20,552 holds, DAX can re-ignite a rally toward:
22,248: interim resistance
23,870: all-time high zone
28,035: macro extension target
Bearish Case (40%) — If the key level is lost and we fall through 18,896, look out below:
16,978 minor support
14,408 becomes the "bad scenario" support
🔄 So… What Now?
We're not fortune tellers, and this isn't about guessing what the next political headline will be. We don’t need to understand the full implications of the euro/dollar dynamic or predict whether Germany will pivot on energy policy.
This is about the chart. Period.
📌 Above 20,552? I’m long toward 22K+
📌 Below it? I prepare for the slide
⚠️ Key decision zone right now. Market structure is everything.
Don’t get caught up in macro debates. The world may be unstable — but price action remains our anchor.
Trade the level, not the noise.
One Love,
The FXPROFESSOR 💙

Quick take on DAXTariffs, no tariffs, tariffs, no tariffs... Let's look at the technical picture...
XETR:DAX
MARKETSCOM:GERMANY40
Let us know what you think in the comments below.
Thank you.
77.3% of retail investor accounts lose money when trading CFDs with this provider. You should consider whether you understand how CFDs work and whether you can afford to take the high risk of losing your money. Past performance is not necessarily indicative of future results. The value of investments may fall as well as rise and the investor may not get back the amount initially invested. This content is not intended for nor applicable to residents of the UK. Cryptocurrency CFDs and spread bets are restricted in the UK for all retail clients.

#202527 - priceactiontds - weekly update - daxGood Day and I hope you are well.
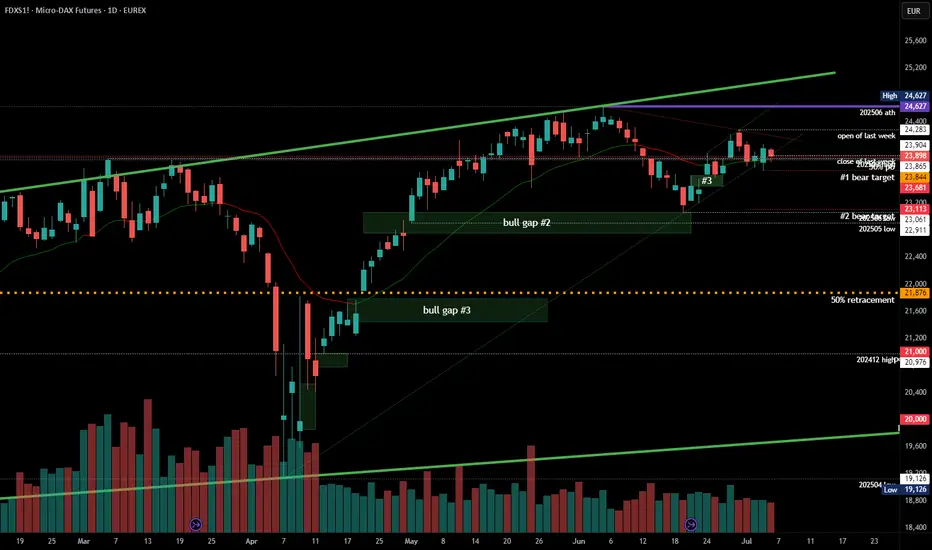
comment: Neutral. Clear triangle on the daily chart and mid point is 23850. Week closed at 23900. Market is in balance and I think it’s completely 50/50 for both sides where the breakout will happen. Given the tariff shit show, I would wait for it to happen and be flat until then. If they apply 10%+ tariffs on EU imports, we go down, if they postpone, we rally further. I trade only technicals but this is one of the few moments per year where news will completely determine where the markets will breakout out next.
Big if. If orange face does another TACO move, momentum is strong enough for markets to keep going and squeeze further. We need a very strong daily bear bar to kill it.
current market cycle: trading range - triangle
key levels for next week: 23500 - 24300 (above 24300, 500 comes into play and also likely 600+)
bull case: Bulls made a higher low but barely. This is a bad looking bull trend from the 23061 low and market is currently in breakout mode to decide where we go next. The 24283 high is a reasonable high to turn lower but as longs as bulls stay above 23600, there is a chance of this doing another try at 23300 and above the ugly bull channel is confirmed and higher prices are likely.
Invalidation is below 23500
bear case: Bears keeping it below 24000 is good but they are not doing enough or we would have made lower lows below 23600. Everything depends on the US-EU tariffs over the next days. Technically all bullish targets are met and the 24283 was high enough to qualify as a re-test. Market is free to go down again, it just needs a catalyst.
Invalidation is above 24300
short term: Neutral. I won’t gamble on the trade talk outcome but I am much more eager to sell this on bad news than to buy it on not-too-bad news.
medium-long term from 2025-06-29: Bull surprise last week but my targets for the second half of 2025 remain the same. I still expect at least 21000 to get hit again this year. As of now, bulls are favored until we drop below 23000.
2025-07-03 - priceactiontds - daily update - daxGood Evening and I hope you are well.
comment: On my weekly chart I think this W4 was too deep to be part of a strong bull trend. 24000 is a decent spot to go sideways rather than up but above 24100 means I’m likely wrong and bears could give up for 24500+. I would not look for shorts until we see better selling pressure again. The Globex spike from 23681 to 23963 was beyond weird. It’s a bull wedge but will likely break out sideways in Globex session. 50/50 for both sides I think.
current market cycle: unclear. bull trend could continue but trading range is most likely
key levels: 23600 - 24500
bull case: Bulls want a retest of 24500+ but they find no buyers around 24000. They tried so many times to print 24000 and today they finally did it again but they would need to stay above 23900 and go sideways until bears give up. Markets can poke at a price long enough until one sides gives up.
Invalidation is below 23860.
bear case: Bears need lower lows again and if they can get below 23860, many bulls could cover in fear of a bigger pullback down to 23700. As of now bears have zero arguments since we only made higher lows since Globex low but we are also barely making higher highs and if we do, they have tails above.
Invalidation is above 24100.
short term: Completely neutral. Can go both way. US markets are overbought and once the profit taking starts, Dax won’t hold up either. Not much interest in guessing which way we go from 24000. Best to sit on hands and wait for a clear and strong signal.
medium-long term from 2025-06-29: Bull surprise last week but my targets for the second half of 2025 remain the same. I still expect at least 21000 to get hit again this year. As of now, bulls are favored until we drop below 23000
trade of the day: Longs since the giant Globex bull spike but had to have wide stops and scale in. Not an easy day.

DAX H4 | Heading into a swing-high resistanceThe DAX (GER30) is rising towards a swing-high resistance and could potentially reverse off this level to drop lower.
Sell entry is at 24,104.89 which is a swing-high resistance that aligns closely with the 78.6% Fibonacci retracement.
Stop loss is at 24,380.00 which is a level that sits above the 127.2% Fibonacci extension and a swing-high resistance.
Take profit is at 23,714.12 which is an overlap support.
High Risk Investment Warning
Trading Forex/CFDs on margin carries a high level of risk and may not be suitable for all investors. Leverage can work against you.
Stratos Markets Limited (tradu.com ):
CFDs are complex instruments and come with a high risk of losing money rapidly due to leverage. 63% of retail investor accounts lose money when trading CFDs with this provider. You should consider whether you understand how CFDs work and whether you can afford to take the high risk of losing your money.
Stratos Europe Ltd (tradu.com ):
CFDs are complex instruments and come with a high risk of losing money rapidly due to leverage. 63% of retail investor accounts lose money when trading CFDs with this provider. You should consider whether you understand how CFDs work and whether you can afford to take the high risk of losing your money.
Stratos Global LLC (tradu.com ):
Losses can exceed deposits.
Please be advised that the information presented on TradingView is provided to Tradu (‘Company’, ‘we’) by a third-party provider (‘TFA Global Pte Ltd’). Please be reminded that you are solely responsible for the trading decisions on your account. There is a very high degree of risk involved in trading. Any information and/or content is intended entirely for research, educational and informational purposes only and does not constitute investment or consultation advice or investment strategy. The information is not tailored to the investment needs of any specific person and therefore does not involve a consideration of any of the investment objectives, financial situation or needs of any viewer that may receive it. Kindly also note that past performance is not a reliable indicator of future results. Actual results may differ materially from those anticipated in forward-looking or past performance statements. We assume no liability as to the accuracy or completeness of any of the information and/or content provided herein and the Company cannot be held responsible for any omission, mistake nor for any loss or damage including without limitation to any loss of profit which may arise from reliance on any information supplied by TFA Global Pte Ltd.
The speaker(s) is neither an employee, agent nor representative of Tradu and is therefore acting independently. The opinions given are their own, constitute general market commentary, and do not constitute the opinion or advice of Tradu or any form of personal or investment advice. Tradu neither endorses nor guarantees offerings of third-party speakers, nor is Tradu responsible for the content, veracity or opinions of third-party speakers, presenters or participants.

DAX: Strong Growth Ahead! Long!
My dear friends,
Today we will analyse DAX together☺️
The market is at an inflection zone and price has now reached an area around 23,758.99 where previous reversals or breakouts have occurred.And a price reaction that we are seeing on multiple timeframes here could signal the next move up so we can enter on confirmation, and target the next key level of 23,821.90.Stop-loss is recommended beyond the inflection zone.
❤️Sending you lots of Love and Hugs❤️

2025-07-01 - priceactiontds - daily update - daxGood Evening and I hope you are well.
comment: If I had longs for 24400+ I would really doubt my position right now. Problem for the bears is, that it’s not low enough to be definitive. Only below 23600 we are making lower lows again and those can not happen in bull trends. Strong enough selling but I have my doubts that bears get follow-through tomorrow. Especially when other markets are rallying instead of selling. Above 24000 we likely see more upside but if bears are strong, they keep the market below and continue lower.
current market cycle: unclear. bull trend could continue but trading range is most likely
key levels: 23100 - 24500
bull case: Bulls need to stay above 23700 bad and continue higher for 24000. If they manage to break above 24k and the bear trend line, there is no reason why we can’t have another strong leg up. Until the bear channel is broken, they are not favored for anything. This could have been a retest of the daily 20ema, but only if we move strongly higher tomorrow.
Invalidation is below 23600.
bear case: Bears need follow-through below 23600 and close the gap to 23540. Then they have a good argument to trade down to 23100 or lower. Right now I would not short the lows because the risk of trading back up to 24000 is too big. The bear channel is clear and valid until broken.
Invalidation is above 24050ish.
short term: Slightly bullish that we bottom out above 23750 and trade back up to 24000 but I would only do small scalps here. Anything below 23700 would surprise me more than 24000.
medium-long term from 2025-06-29: Bull surprise last week but my targets for the second half of 2025 remain the same. I still expect at least 21000 to get hit again this year. As of now, bulls are favored until we drop below 23000
trade of the day: Short from EU open.

DAX H4 | Bullish uptrend to extend further?The DAX (GER30) could fall towards a pullback support and potentially bounce off this level to climb higher.
Buy entry is at 24,077.90 which is a pullback support.
Stop loss is at 23,850.00 which is a level that lies underneath a pullback support and a Fibonacci confluence zone identified by the 23.6% and 38.2% retracements.
Take profit is at 24,369.51 which is a multi-swing-high resistance.
High Risk Investment Warning
Trading Forex/CFDs on margin carries a high level of risk and may not be suitable for all investors. Leverage can work against you.
Stratos Markets Limited (tradu.com ):
CFDs are complex instruments and come with a high risk of losing money rapidly due to leverage. 63% of retail investor accounts lose money when trading CFDs with this provider. You should consider whether you understand how CFDs work and whether you can afford to take the high risk of losing your money.
Stratos Europe Ltd (tradu.com ):
CFDs are complex instruments and come with a high risk of losing money rapidly due to leverage. 63% of retail investor accounts lose money when trading CFDs with this provider. You should consider whether you understand how CFDs work and whether you can afford to take the high risk of losing your money.
Stratos Global LLC (tradu.com ):
Losses can exceed deposits.
Please be advised that the information presented on TradingView is provided to Tradu (‘Company’, ‘we’) by a third-party provider (‘TFA Global Pte Ltd’). Please be reminded that you are solely responsible for the trading decisions on your account. There is a very high degree of risk involved in trading. Any information and/or content is intended entirely for research, educational and informational purposes only and does not constitute investment or consultation advice or investment strategy. The information is not tailored to the investment needs of any specific person and therefore does not involve a consideration of any of the investment objectives, financial situation or needs of any viewer that may receive it. Kindly also note that past performance is not a reliable indicator of future results. Actual results may differ materially from those anticipated in forward-looking or past performance statements. We assume no liability as to the accuracy or completeness of any of the information and/or content provided herein and the Company cannot be held responsible for any omission, mistake nor for any loss or damage including without limitation to any loss of profit which may arise from reliance on any information supplied by TFA Global Pte Ltd.
The speaker(s) is neither an employee, agent nor representative of Tradu and is therefore acting independently. The opinions given are their own, constitute general market commentary, and do not constitute the opinion or advice of Tradu or any form of personal or investment advice. Tradu neither endorses nor guarantees offerings of third-party speakers, nor is Tradu responsible for the content, veracity or opinions of third-party speakers, presenters or participants.

#202526 - priceactiontds - weekly update - daxGood Evening and I hope you are well.
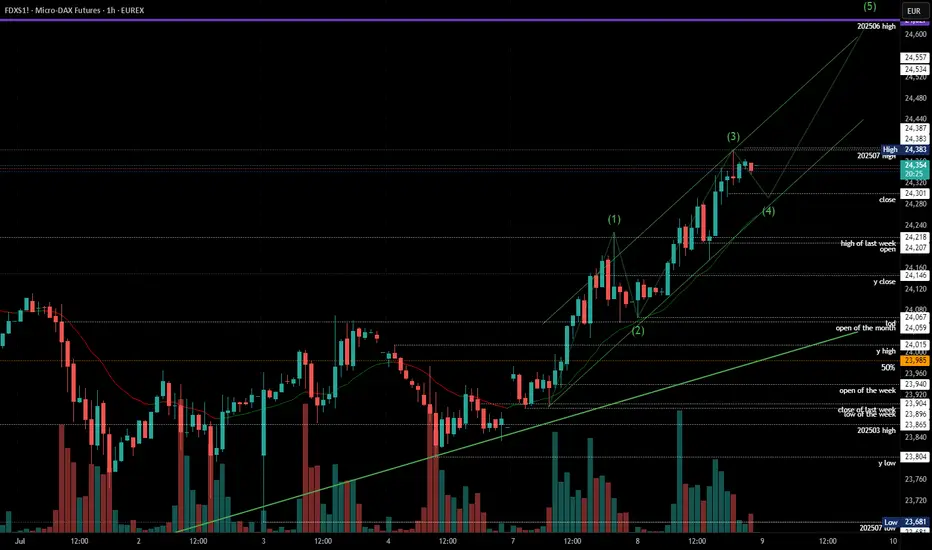
comment: Monday was neutral and the warning to bears that the markets do not care about the risk at hand. Tuesday’s gap up then was the sign of bull strength and defending the Globex gap was the sure sign we are going higher. Thursday was the bears giving up and since we have a measured move target up to 24700. I have drawn my 5-wave thesis on the chart, which I think is currently the most likely outcome. All depends if the US markets continue the squeeze as well. There is always the possibility that Friday marked the highs but that is very low and in the absence of bear bars, we can only assume higher prices.
current market cycle: trading range
key levels for next week: 23500 - 25000
bull case: Bulls made the bears give up on Thursday and since we have been going only up. The obvious next targets are 24500 and then 25000. As of now, there is absolutely no reason to assume we reverse from here and print lower lows again. Bulls took over control of the market again and we have two clear legs up, with a third one we may do a new ath but as always, every pattern can fail.
Invalidation is below 23500
bear case: Not much. A pullback is expected but so is the third leg up for W5 and everything below 23500 would be a huge bear surprise and cut this short. As of now I don’t think this chart can lead you to looking for shorts. We would need a break of two bull trend lines and prices below 23500 before you should think bearish again.
Invalidation is above 24400
short term: Bearish was the obvious read last weekend and when bears failed on Monday, it set the stage for an explosive move to the upside. That can always happen since we are in a profession where you play odds.
medium-long term from 2025-06-29: Bull surprise last week but my targets for the second half of 2025 remain the same. I still expect at least 21000 to get hit again this year. As of now, bulls are favored until we drop below 23000

2025-06-26 - priceactiontds - daily update - daxGood Evening and I hope you are well.
comment: Is this a bigger two-legged pullback to the 4h ema and now we strongly break above 23900 to go for 24200+ again? It’s my most likely case. It’s still not a good trade to buy above 23800 since that trapped you two times this week for 230 and 300 point pullbacks.
current market cycle: broad bull channel on the weekly chart. Daily chart is in a trading range 23000 - 24500
key levels: 23500 - 24500
bull case: Everything aligns for the bulls. They need the breakout above Tuesday’s high and then we go for the obvious big round number 24000 but I doubt we will stop here. Once the bears who sold above 23800 this week give up, I doubt there will be much resistance until maybe 24300 or higher. Anything below 23600 would be a huge bear surprise tomorrow and my bullish bias is likely wrong.
Invalidation is below 23000.
bear case: Bears don’t have much until they print below 23600 again. Can they hold the market below 24000 and keep this trading range alive? I doubt it. Bears tried 3 times this week and the bull gap to 23550 stayed open.
Invalidation is above 24100.
short term: Bullish. Still expecting 24000 and no print below 23600 tomorrow. Everything else would be a big bear surprise and we could go much lower than 23500 but this is the most unlikely scenario.
medium-long term from 2025-06-22: New bear trend has likely started on 2025-06-05 and we saw W2 conclude on Friday. Daily close below 23000 will be the confirmation for the bears and I have drawn 2 potential final W5 targets. I have written that we will see 20000/21000 again over the summer for many weeks/months now, this even is just another excuse for “analysts” to justify the move down.
trade of the day: Longs close to 23600 were the obvious trade today. The selling for 198 was at least 100 points stronger than I expected and stopped me out but I immediately went long again on the very strong buying below 23650 and closed the day with profits.

DAX Inverse Head and Shoulders target 24600!DAX (DE40) is about to complete an Inverse Head and Shoulders (IH&S) pattern, with the price currently stuck in range within the 4H MA50 (blue trend-line) and the 4H MA200 (orange trend-line).
A 4H candle closing above the 4H MA200, confirms the IH&S pattern and the bullish break-out technically targets the 2.0 Fibonacci extension, currently a little above 24600. On top of that, the break-out may be accompanied by a 1D MAD Bullish Cross, further confirmation of the bullish sentiment.
-------------------------------------------------------------------------------
** Please LIKE 👍, FOLLOW ✅, SHARE 🙌 and COMMENT ✍ if you enjoy this idea! Also share your ideas and charts in the comments section below! This is best way to keep it relevant, support us, keep the content here free and allow the idea to reach as many people as possible. **
-------------------------------------------------------------------------------
Disclosure: I am part of Trade Nation's Influencer program and receive a monthly fee for using their TradingView charts in my analysis.
💸💸💸💸💸💸
👇 👇 👇 👇 👇 👇

DAX H4 | Potential bearish reversalThe DAX (GER30) is rising towards a swing-high resistance and could potentially reverse off this level to drop lower.
Sell entry is at 23,740.18 which is a swing-high resistance.
Stop loss is at 23,960.00 which is a level that sits above the 61.8% Fibonacci retracement and an overlap resistance.
Take profit is at 23,341.19 which is a pullback support that aligns with the 61.8% Fibonacci retracement.
High Risk Investment Warning
Trading Forex/CFDs on margin carries a high level of risk and may not be suitable for all investors. Leverage can work against you.
Stratos Markets Limited (tradu.com ):
CFDs are complex instruments and come with a high risk of losing money rapidly due to leverage. 63% of retail investor accounts lose money when trading CFDs with this provider. You should consider whether you understand how CFDs work and whether you can afford to take the high risk of losing your money.
Stratos Europe Ltd (tradu.com ):
CFDs are complex instruments and come with a high risk of losing money rapidly due to leverage. 63% of retail investor accounts lose money when trading CFDs with this provider. You should consider whether you understand how CFDs work and whether you can afford to take the high risk of losing your money.
Stratos Global LLC (tradu.com ):
Losses can exceed deposits.
Please be advised that the information presented on TradingView is provided to Tradu (‘Company’, ‘we’) by a third-party provider (‘TFA Global Pte Ltd’). Please be reminded that you are solely responsible for the trading decisions on your account. There is a very high degree of risk involved in trading. Any information and/or content is intended entirely for research, educational and informational purposes only and does not constitute investment or consultation advice or investment strategy. The information is not tailored to the investment needs of any specific person and therefore does not involve a consideration of any of the investment objectives, financial situation or needs of any viewer that may receive it. Kindly also note that past performance is not a reliable indicator of future results. Actual results may differ materially from those anticipated in forward-looking or past performance statements. We assume no liability as to the accuracy or completeness of any of the information and/or content provided herein and the Company cannot be held responsible for any omission, mistake nor for any loss or damage including without limitation to any loss of profit which may arise from reliance on any information supplied by TFA Global Pte Ltd.
The speaker(s) is neither an employee, agent nor representative of Tradu and is therefore acting independently. The opinions given are their own, constitute general market commentary, and do not constitute the opinion or advice of Tradu or any form of personal or investment advice. Tradu neither endorses nor guarantees offerings of third-party speakers, nor is Tradu responsible for the content, veracity or opinions of third-party speakers, presenters or participants.

DAX: Move Down Expected! Short!
My dear friends,
Today we will analyse DAX together☺️
The price is near a wide key level
and the pair is approaching a significant decision level of 23,509.95 Therefore, a strong bearish reaction here could determine the next move down.We will watch for a confirmation candle, and then target the next key level of 23,438.51..Recommend Stop-loss is beyond the current level.
❤️Sending you lots of Love and Hugs❤️

2025-06-24 - priceactiontds - daily update - daxGood Evening and I hope you are well.
comment: Market stalled exactly at the 50% retracement from the bear leg 24627 down to 23061. I highly doubt we top out here but 24000 is a possible target for the high. Issue for the bears is that this is as bullish as it get’s right now. All markets printing big green candles and bears gave up. US markets are heading for new ath and they will likely print new ones this week. So thinking about topping out is dumb as of now. Will only look for longs closer to the 1h ema until we see much much bigger selling pressure and prices below 23500.
current market cycle: broad bull channel on the weekly chart. Daily chart is in a trading range 23000 - 24500
key levels: 23500 - 24000
bull case: Big Globex gap up, retest and go. Market is leaving gaps below and until they close, we are in a max bullish market. 24000 is the obvious target but we can do more. Any pullback now has to stay above 23700 or bears might come around again.
Invalidation is below 23000.
bear case: There is a tiny chance for the bears that this is just a retest of 24000 and the breakout price area and also the daily 20ema. Tiny. Don’t bet on it. You can not look for shorts until we close the next gap down to 23550ish.
Invalidation is above 24100.
short term: Bullish af. 24000 I see as given unless a newsbomb hits. Market should not drop below 23690 if bulls want to continue higher.
medium-long term from 2025-06-22: New bear trend has likely started on 2025-06-05 and we saw W2 conclude on Friday. Daily close below 23000 will be the confirmation for the bears and I have drawn 2 potential final W5 targets. I have written that we will see 20000/21000 again over the summer for many weeks/months now, this even is just another excuse for “analysts” to justify the move down.
trade of the day: Long on Globex or buying pullbacks near the 15m or 60m ema. All were profitable at least for scalps. When you see this much buying during Globex session and a perfect double bottom above a big bull gap, chances that this day is bearish are abysmally low so don’t look for shorts.

DAX H1 | Rising into an overlap resistanceThe DAX (GER30) is rising towards an overlap resistance and could potentially reverse off this level to drop lower.
Sell entry is at 23,858.94 which is an overlap resistance that aligns closely with the 61.8% Fibonacci retracement.
Stop loss is at 24,200.00 which is a level that sits above the 78.6% Fibonacci retracement and an overlap resistance.
Take profit is at 23,531.83 which is a pullback support that aligns the 38.2% Fibonacci retracement.
High Risk Investment Warning
Trading Forex/CFDs on margin carries a high level of risk and may not be suitable for all investors. Leverage can work against you.
Stratos Markets Limited (tradu.com ):
CFDs are complex instruments and come with a high risk of losing money rapidly due to leverage. 63% of retail investor accounts lose money when trading CFDs with this provider. You should consider whether you understand how CFDs work and whether you can afford to take the high risk of losing your money.
Stratos Europe Ltd (tradu.com ):
CFDs are complex instruments and come with a high risk of losing money rapidly due to leverage. 63% of retail investor accounts lose money when trading CFDs with this provider. You should consider whether you understand how CFDs work and whether you can afford to take the high risk of losing your money.
Stratos Global LLC (tradu.com ):
Losses can exceed deposits.
Please be advised that the information presented on TradingView is provided to Tradu (‘Company’, ‘we’) by a third-party provider (‘TFA Global Pte Ltd’). Please be reminded that you are solely responsible for the trading decisions on your account. There is a very high degree of risk involved in trading. Any information and/or content is intended entirely for research, educational and informational purposes only and does not constitute investment or consultation advice or investment strategy. The information is not tailored to the investment needs of any specific person and therefore does not involve a consideration of any of the investment objectives, financial situation or needs of any viewer that may receive it. Kindly also note that past performance is not a reliable indicator of future results. Actual results may differ materially from those anticipated in forward-looking or past performance statements. We assume no liability as to the accuracy or completeness of any of the information and/or content provided herein and the Company cannot be held responsible for any omission, mistake nor for any loss or damage including without limitation to any loss of profit which may arise from reliance on any information supplied by TFA Global Pte Ltd.
The speaker(s) is neither an employee, agent nor representative of Tradu and is therefore acting independently. The opinions given are their own, constitute general market commentary, and do not constitute the opinion or advice of Tradu or any form of personal or investment advice. Tradu neither endorses nor guarantees offerings of third-party speakers, nor is Tradu responsible for the content, veracity or opinions of third-party speakers, presenters or participants.

#202525 - priceactiontds - weekly update - dax futuresGood Day and I hope you are well.
comment: Full bear mode. Bulls tried 3 times to get some pullback going but only huge rejections on every try and since we have crossed the daily ema, we have not touched it or came close to it. Maybe we see some sideways movement around 23000 but given my uber bearish expectation due to US bombs on Iran, I can see a giant move down to 22000 and some stalling around it. Any price above 23700 means I am wrong and markets continue to ignore every risk under the sun.
1500 points down by the bears in two weeks is decent enough for a first leg. I market two potential W5 targets for the next weeks.
current market cycle: most likely new bear trend which can bring us to 21k or 20k over the next weeks
key levels for next week: 22000 - 23700
bull case: Can they try another “ignore the risk” move after the weekend news? I doubt it but anything can happen, so my invalidation for the bears is 23700. If they print it, we move sideways but I can not, for the life of me, see this printing new highs. If you are still holding long term longs on anything, I think you are late on running for the exit.
Invalidation is below 22900
bear case: Bears have been given another gift by orange face. The selling started two weeks ago, so it has nothing to do with Iran but it will likely help in confirming the trend and maybe accelerate it. The drawn channel is a rough guess for now. We have seen slow and steady liquidation the past 2 weeks and now we could see a shift to a huge “run for the exits” and type of “liberation-day” markets. 22000 is the big next target for bears since I expect 23000 or lower to get hit immediately on futures open.
Invalidation is above 23700
short term: Full bear mode. 23000 is almost a given and we could move quickly to 22000 over the next days. If we produce an island gap with the previous bull gap 22800-23100 (don’t take those numbers per tick value, this is not an exact science, many algos see the gap differently) it’s a huge confirmation and it could not be closed for months. If we do a big gap down and bulls close it, much less chance for the bears to continue down faster.
medium-long term from 2025-06-22: New bear trend has likely started on 2025-06-05 and we saw W2 conclude on Friday. Daily close below 23000 will be the confirmation for the bears and I have drawn 2 potential final W5 targets. I have written that we will see 20000/21000 again over the summer for many weeks/months now, this even is just another excuse for “analysts” to justify the move down.

DAX: Target Is Up! Long!
My dear friends,
Today we will analyse DAX together☺️
The recent price action suggests a shift in mid-term momentum. A break above the current local range around 23,435.79 will confirm the new direction upwards with the target being the next key level of 23,572.93 and a reconvened placement of a stop-loss beyond the range.
❤️Sending you lots of Love and Hugs❤️

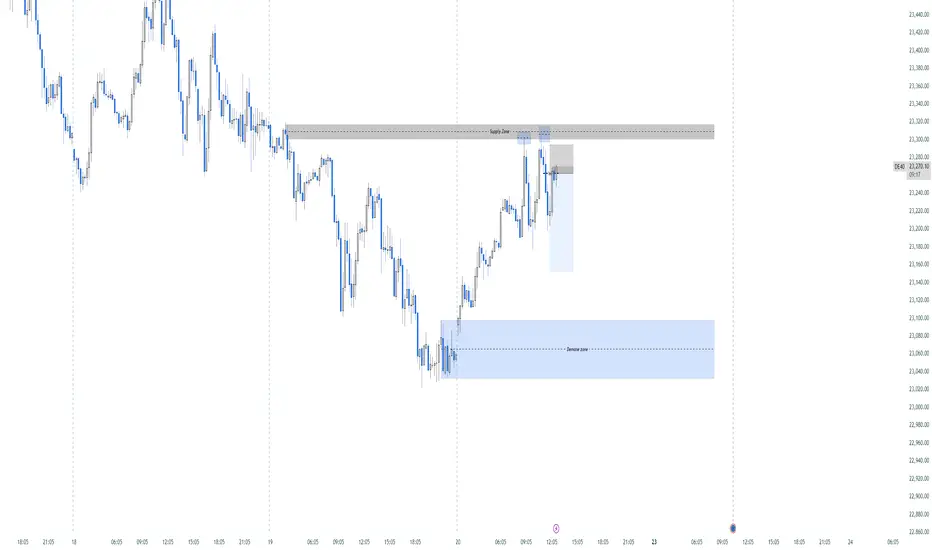
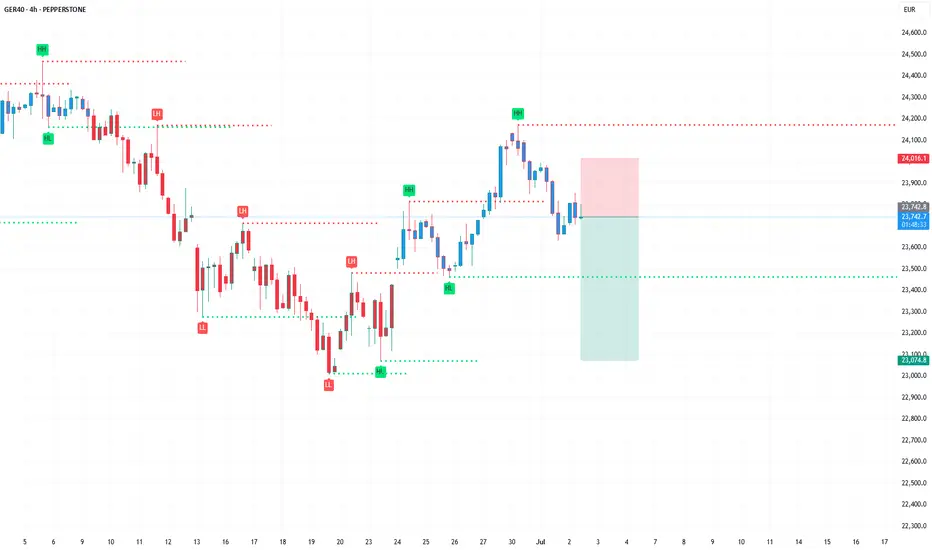
Possible Sell On Dax. Every thing taken into account, dax could shortly see a sell, given that a 1h Supply zone and 5 minute candles were rejected twice.