DAX long ideaDAX has closed above the last broken support (marked with green) on the daily. This is how the market changes rapidly... With this move, the market is in sync, every time frame shows the long trend, so I will look for opportunities on the lower time frames. Targets are marked with pink.
Idea is valid until price breaks below the red zone on the daily.
Dax30


US30 Analysis US30 is in a strong up trend however price is currently retracing before it will continue to go to 35000. Price will come to 34667 the middle trend line, before going up. However if price breaks 34667 and continues then price may go down further to 34524 before going back up. If price does break 34524 then we can see more sell offs.
Bulls: Target 35000
Bears: 34667-34524

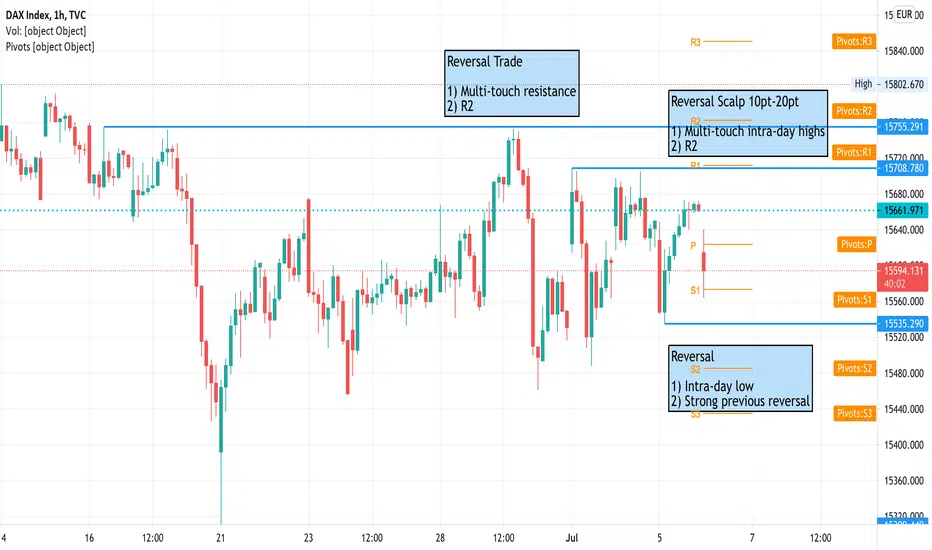
DAX Reversal ScalpsMainly scalping trades for 10 - 20 points.
I'm looking for obvious support and resistance levels to use. Ideally with some confluence with daily pivot points.
Orders taken off the 5m chart and I'm looking for reactions at these levels. I don't want to see price wander slowly into the level. I would prefer to see a strong move to the level for a reaction.
DE30 Buy the dip.GER30 - Intraday - We look to Buy at 15513 (stop at 15457)
Dips continue to attract buyers.
We look to buy dips.
Daily signals are bullish.
Pivot support is at 15500.
Support is located at 15500 and should stem dips to this area.
Daily signals for sentiment are at overbought extremes.
Our profit targets will be 15666 and 15686
Resistance: 15650 / 15670 / 15700
Support: 15600 / 15550 / 15500

DAX (every week I will update the chart)Yellow zone is the key level in the short term, it could go to purple zone, just wait 🤓

DAX: Push, Push! 😎😎😎The German index has had its troubles with the resistance at 15806 points. However, the longer the course is stable and close to this mark, the more positive are we that the final push will come soon. Once above 15806 points, we expect the course to reach new all-time highs around 16591 points.
Patience is key!

DAX: What is the current forecast? Buy now?Technical analysis of the DAX index - viewed in the D1 chart
The DAX was able to defend its upward trend above the 50-day line despite a more volatile pace in the past trading days. It is still within walking distance of the record high of 15,803 points. A decision as to whether the index remains true to its seasonal pattern and can mark a new high in a timely manner in order to then switch to a corrective phase of several weeks to several months after a top in the course of July should be made in the coming trading days.
Short term opportunities on the upside remain
We continue to favor a temporary new high in the orbit of the remaining potential target areas at 15,900 / 16,000 points or 16,187-16,274 points in July. There are various Fibonacci extension targets, the capping resistance line along the highs of April 19 and June 11, as well as the upper limit (measured by indicators) in the weekly chart. A price confirmation would be seen in a daily close above the current resistance at 15,803 points. After the targeted high, we expect a medium-term downtrend to be established.
Trigger zone on the bottom
From our point of view, the alternative would be an upstream slide below the critical support zone at currently 15,448-15,461 points, especially at the end of the day. A horizontal accumulation zone and the 50-day line act as support themes here. In this case, we would classify a dynamic sell-off in the direction of 15,309 points and then 14,816-14,961 points as likely. Below the last-mentioned zone, the higher-level chart image would then also become significantly clouded.
Note:
Despite careful analysis, Global Investa does not accept any liability for the content, topicality, correctness or completeness of the information provided. The information provided does not constitute investment advice, purchase recommendations or investment brokerage.

dax40 in comming week will go upper secret= dax is very sensetive on daily chart pinbar 99% work
you can see 8 days ago pinbar,do its job exclent but not done yet , in 16000 will done (as we predict 6 month ago)
in other side dax30 going to add 10 big company ,it will give dax + trend to 17000
in comming week with exclent NFP news behind dax , it must go up,up,upper
if bad news comes,dax can break yesterday low , it can go to 15000 then 14850(buylimit place for hold 20-30 day) gap(on cash xetra dax) then will fly up to 16000
2021-2022 is bull market,enjoy it ,looking for buy in deep , dont risk with sell in powerful + trend
note=in 16000 you can pick selllimit but put SL=80 point , easily dax after 16000 can go to 17000, we will see on 16000 too with target 15200
ichimoku not work on dax (good for trendy markets like gold) , i put it on daily chart only you can see its up,down level , pro traders use EMA200 on dax
prnt.sc
dow and dax have relationship , here open orders by larg banks(brokers) and funds money managers, they pick heavy buy this week ,buy more will continue in next weeks
prnt.sc
prnt.sc

ALERT= dax going to fly up exclent NFP new and factory orders will push dax to 16000 in next 6-7 day you will see + effect
i mportant news = dax30 going to add 10 new company , DAX40 and 10 big company will push dax to 17000 to 20.000 (target for end of 2021)
strongly advice stand on buy side ,looking for buy in deep , dont pick sell signals
www.cnbc.com
DAX is worth to keep an eye ofThe German index has been broken the recent rally on the daily (18 June), and the impulse to the south has been corrected. Both directions play now. Long from the green area, short from the red. Targets are market with pink.

GER30 Buy the dip.GER30 - Intraday - We look to Buy at 15507 (stop at 15448)
Daily signals are bullish.
Pivot support is at 15500.
Dips continue to attract buyers.
We look to buy dips.
We have a Gap open at 15570 from 15570 to 15600.
A lower correction is expected.
Our profit targets will be 15666 and 15686
Resistance: 15600 / 15670 / 15700
Support: 15550 / 15500 / 15470

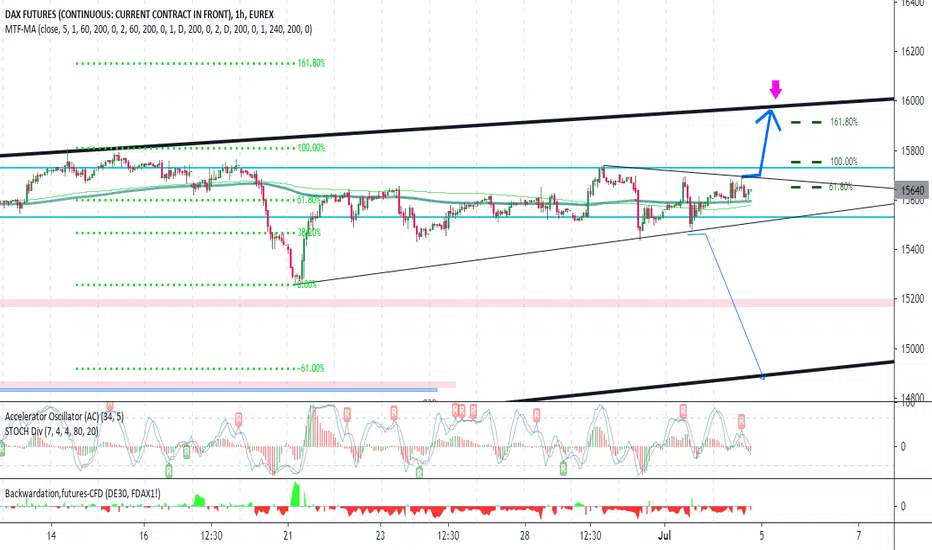
buyer target is 16000for dax daily analyse,every morning check last analyse on dax futures FDAX1 ! fdax data is very accrue
other dax charts,data (high,low) can be wrong ,give you wrong trend lines
max , min = dax down target can be 14850...up target is 16200
advice=above today low 15450 ,looking for buy until 16000(dont pick sell signals) , if low break ,looking for sell
if you have sell ,you must put sl=15700,,,break 15700 support ,can explode dax to up

FDAX RSI Divergence Dax RSI Divergence, watch for close below trend to enter short position. Volume appears to confirm this after accounting for out close-out volumes.

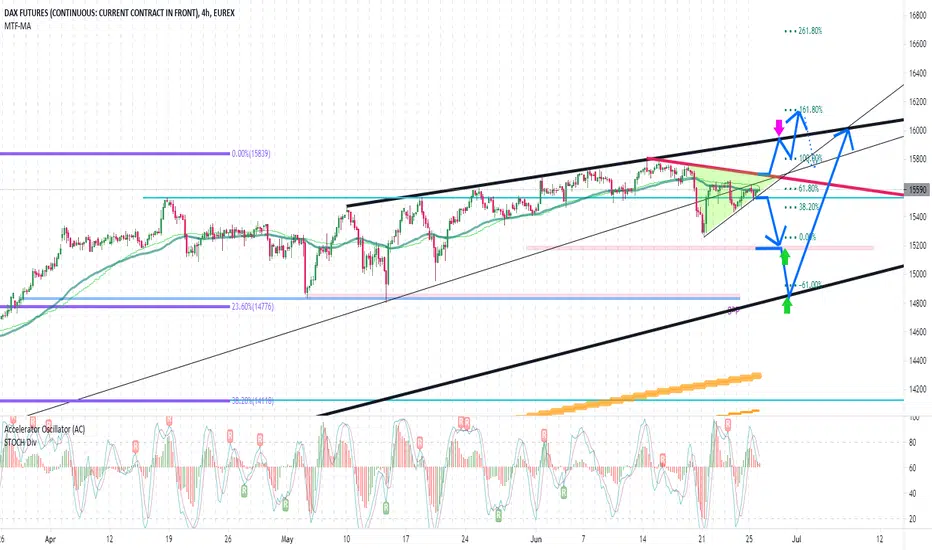
dax crash by emotion but can fly up to 16000see AC indicator (or stochastic 7.4.4) on 4hour chart , it turn red in today morning , force many open sell !!!
be inform dax target stil is 16000 (see fibo 161%)
now on 1hour chart we have buy pinbar going to fibo 61%( FDAX LOVE FIBO 61%) then will go to fibo 161%
ALERT=if low break ,dax can see 14850 powerfull support (gap on cash xetra dax too)

DAX - the rally continuesTechnical analysis of the DAX index - viewed in the D1 chart
The German benchmark index DAX seems to want to end its consolidation phase and in this context only recently turned up again in the support area of 15,450 to 15,500 points. US labor market data (NFP) are back on the agenda for Friday. These could provide further boost towards a new all-time high. Prices over 16,000 points therefore only seem like a question of time. From a medium-term projection perspective, further upside potential of up to 16,665 points is permitted above this round price mark. Accordingly, the bulls stay on course and ensure the continuation of the rally movement, which can generally be defined as absolutely intact. However, increased volatility must be taken into account on Friday. The cards for the further course of the course will be shuffled in July.
In any case, it would only become critical for all bulls if they fell below the reaction low of June 21. Quotes below 15,300 points allow further losses towards the 14,800 point mark.
Note:
Despite careful analysis, Global Investa does not accept any liability for the content, topicality, correctness or completeness of the information provided.


GER30 Sell the downtrend.GER30 - Intraday - We look to Sell at 15623 (stop at 15671)
Trend line resistance is located at 15630.
We look for a temporary move higher.
Bearish divergence is expected to cap gains.
Daily signals for sentiment are at overbought extremes.
Our profit targets will be 15501 and 15481
Resistance: 15600 / 15630 / 15670
Support: 15550 / 15500 / 15470

DE30 Sell the resistance.GER30 - Intraday - We look to Sell at 15588 (stop at 15645)
Short term bias is mildly bearish.
20 4hour EMA is at 15570.
50 4hour EMA is at 15600.
Pivot resistance is at 15603.
Preferred trade is to sell into rallies.
Although the bulls are in control, the stalling positive momentum indicates a possible turnaround is possible.
Our profit targets will be 15421 and 15401
Resistance: 15550 / 15600 / 15630
Support: 15500 / 15470 / 15450

DE30 Sell the downtrend.GER30 - Intraday - We look to Sell at 15658 (stop at 15711)
Trend line resistance is located at 15650.
The trend of lower highs is located at 15650.
The previous swing high is located at 15675.
Early optimism is likely to lead to gains although extended attempts higher are expected to fail.
Our profit targets will be 15515 and 15495
Resistance: 15650 / 15670 / 15700
Support: 15600 / 15550 / 15500

DE30 Sell the downtrend.GER30 - Intraday - We look to Sell at 15641 (stop at 15691)
Trend line resistance is located at 15640.
The trend of lower highs is located at 15650.
We look for a temporary move higher.
Preferred trade is to sell into rallies.
We are trading at overbought extremes.
Our profit targets will be 15501 and 15481
Resistance: 15650 / 15670 / 15700
Support: 15600 / 15550 / 15500

MASSIVE BEARISH ABCD Harmonic Pattern in DAX30Hello everyone,
I spotted this MASSIVE ABCD harmonic pattern in the German DAX30, and wanted to share a few details about my current DAX 30 short trade.
in order for you to understand what I am talking about I added this snapshot of the whole ABCD structure:
(TMF: Daily)
The retracements/extensions:
As you can see, the B-C move retraced exactly as far as 0.382 of the A-B move.
While the C-D move extends as far as 2.272 of the initial B-C retracement.
While 2.272 is a very uncommon extention number for C-D moves, it still is a valid number, and I consider it worth a try.
In order to confirm the potential mega-short chance, I took a look at the RSI and spotted a huge divergence in both, the 24h and 72h timeframes.
RSI settings: standard except the range, which is set to (8):
About the actual trade:
My stop is set slightly above the most recent high, as we may still see a recovery and I don't want the trade to immediately get stopped out.
In terms of profit taking:
I attached a FIB retracement from D to C, and each of the displayed Fibonacci numbers will be partial take profit levels. My final take profit is sitting on 1.618.
If any of that actually came true, then, yes, this would be yet another historical mega-crash of even greater scale than the 'Corona-Crash'.
Feel free to comment your opinion or to hit me up and share your current analysis if you disagree :)

in comming week = 15500 support and 3angel pattern in focuspinbar on daily chart push dax up
AC 4hour is red now but cant move dax down so with little up move ,can turn green and dax fly up
buystop= if dax can break red trend line can fly up to 16000 (60%)
sellstop= if dax break 15500 can crash to 14850 (40%)
green arrow powerfull place we must put limit order with sl=40 (hold 15 day until new high)
weekly chart ,long term target= dax in way to 17000 (according fibo on crona crash)
advice= 90% looking for buy specialy when AC 4hour is green (AC 30min is in down,full red want turn green)
100% put SL in 15min chart high,low ,,,like gold ,dax can explode 1000 point too
take look on COT data , larg banks and big funds money managers (they buy near 200.000 lot sp500 futures)
prnt.sc
prnt.sc