Daytrade

GBPUSD COMING BACK UP Hello Traders, i hope you all have had a wonderful weekend and first 2 days of trading. Me personally, yesterday wasnt too hot but thats OK, because we are here for a long time not a short time. Anyways, enough of my ranting, lets get into this idea.
Yesterday, we observed that GBPUSD was on a mission to push up up up, making it apparent that we are in an extended uptrend. More than likely, price is going to come back up since the up trend has already been established. On top of this, price tends to go opposite directions when we enter a new session, not always the case, but very common for this to happen.
Observing the lower time frames, we see on the 15M chart that price has made a very interesting inverted hammer, pay attention and wait for the right entry.
Be sure to exercise patience and use reasonable stop losses. Remember, we are trying to control our losses, let the profits ride until you are comfortable (and within reason of course)
PRECISION ,PATIENCE, AND POWER

2021.01.19 GBPJPY Fundamental + Technical Analysis Practice BuyOverall Trend showing bearish after defending current bullish trend @ 142.000 level.
Price retraces @ 140.400 (current support) to meet the mid level zone.
Temporary retracement from the support to the mid zone driven by the COVID19 news in Japan, expecting to bring the price up to the nearest level of 141.300 level.
1:1.51 risk reward
17 pips to 11.5 pips.

Price analysis in NANOBUSD - Upward triangle formationTechnical analysis regarding the price of NANO in relation of dollar attached to Binance for the next scenarios, based on 4 hour movement.
There was a strong correction, causing the price to close further below its value. From 2,234 onwards it started to rise, leaving funds and ascending tops, making a graphical projection of an ascending triangle.
The price has accumulated and the chance to break this resistance, which has already occurred 3 touches, is a very good one, for the price to continue its upward trend (since the graphical formation of the ascending triangle is bullish and a continuation pattern).
Designing this channel based on mathematically (Fibonacci), which coincides with the maximum price top, in its impulse wave.
disclaimer
*** This is not a recommendation to purchase and/or sale. It is for educational purposes only. ***

GBP/JPY Short Opportunity for a potential of 30 PIPS!!OVERVIEW:
Yesterday I called a sell trade on GBP/JPY from 140.900 to target 140.340 which ended up being a 55 pip win! As soon as the target was hit the market has spent the current trading day retesting 140.900 break of support as NEW RESISTANCE. There is now another opportunity to go short on GJ as it is coming up to NYSE open which could bring high volume into the market to move to the downside once more towards 140.390.
TECHNICAL ANALYSIS:
This is a nice simple market structure set up, if it plays out well this will be a very easy 30 pip win on top of the 55 pip win earlier today. As you can see GBP/JPY has been moving very strongly to the downside starting from last Friday, continuing on towards this current trading week. Earlier on today there was a break of major support at 140.900, now the market is retesting the area as resistance, I need to see a 1 Hour candle close below 140.900 and for the next candle to break below the previous before entering a sell to target 140.390.

BTCUSDT - Short by Keltner Channels 17 Jan 20211. How to use Keltner Channels
a_ Length of Keltner's basis line is 50. It gives the best result in finding rule of BTCUSD.
b_ How to confirm a trend.
- Upper 2 is used to confirm Keltner channels at Uptrend.
- Lower 2 is used to confirm Keltner channels at Downtrend.
c. How to determine a swing Entry.
_ Upper 1 is used to buy when the market makes a corrective.
_ Lower 1 is used to sell when the market makes a corrective.
2. Long signal is confirmed when Closed of candle crossover the Upper 2.
3. Short signal is confirmed when Closed of candle crossunder the Lower 2.
4. Stoploss is calculated by the price closed candle +/- the value of Average true range (length=20 bars)
Stoploss = previous Close +/- atr(20)x2x1.3
-> To move the stoploss every 1 hour.


Long term buyWait for it you wanna make sure you have a stochastic to determine when the market touches the bottom as far as possible use (correct leverage) wait till the market calms down to get in because of (spreads) also the (momentum strategy) helps you determine when to get in just make sure you (risk correctly)
Also look at the research on the lowest point in the market to see what kind of history it had to get an idea of what it may look like. if you need an entry don't worry look at the arrows at the rejection period then get in one

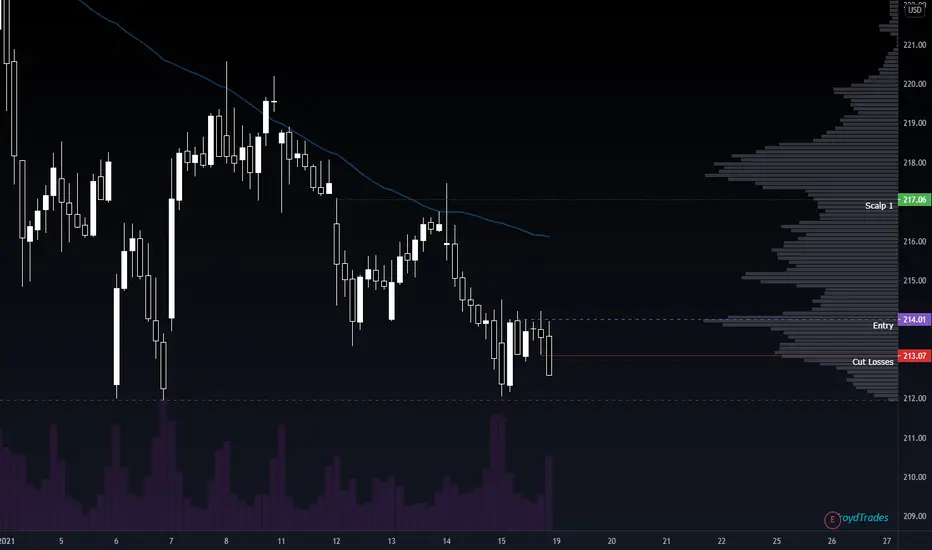
$MSFT 217c 1/22 - Entry 214, PT 217, SL 213 #optionsValid: January 19th, 2020
Rationale: Funds will, at some point, buy up a bunch of cheap tech. We're also approaching the bottom of long term support. I want to scalp the next round of funds buying big tech. There is a historical shorter term demand/supply gap between 214 and 217.
Entry Rules
5 minute close above entry point, indicates positive momentum.
Purchase a strike near target
Scalps - buy the weekly
Swings - buy one week out
Stop loss only after Entry, indicates sideway action is taking place, exit to avoid theta or downside.
Technical analysis fits perfectly - work of art at BTCTechnical analysis regarding the price of BITCOIN in relation of dollar Tether for the next scenarios, based on 4 hour movement.
According to the price movement following the Elliott waves (Ralph Nelson Elliott theory), the bitcoin price is correcting and, soon after, I projected the same wave sequence of the first part and pasted it. Look how this is a work of art, where the prices fit perfectly between the lines. Obviously, it may not be as expected, but it is my vision.
disclaimer
*** This is not a recommendation to purchase and/or sale. It is for educational purposes only. ***

GBPUSD PUSH DOWN (FR THIS TIME) Whats up guys, first off, i want to apologize for the idea yesterday, i totally f'd up on that one, but i promise ill do better this time!
So its Friday!! The trading week has come to a close almost. Lets finish strong and start the week off right on Monday.
Lets take a look a GBP:
From my analysis, I see that price broke the level of support we used for a buy yesterday, (this is the same support that i though we were going to break yesterday), this tells me that its very likely for price to trend downwards now, until we hit maybe the blue line at the bottom of my markup. the only thing that makes me cautious is the fact that its Friday, and from my experience, price tends to range in a specific area on Friday or it can absolutely demolish a certain setup.
Pair this with the oversold RSI on virtually all timeframes up to 1H and you have a recipe for a potential reversal that came out of nowhere. Nontheless, dont let this scare you away, rather let it make you exercise caution and be sure to use CORRECT RISK MANAGEMENT
My bias for today is going to be short but if we see a strong push up, we can expect a reversal back to a higher support
Trade safe, trade smart, and trade precise yall, ill be back next week!!!

Newly launched RIF with a lot of growth potentialTechnical analysis regarding the price of RSK Infrastructure Framework (RIF) in relation of dollar Tether for the next scenarios, based on daily movement.
The price of this newly launched crypto is already in an upward trend, right after breaking the high of January 8th, making its price gain upward momentum. I was able to trace my price projections for the next scenarios, if everything goes according to plan.
This currency has an enormous potential for return and growth, because its foundation has a thesis and purpose, so, in my view, I believe that it can achieve such targets.
Taking this period in which the currency has already appreciated, the Moving Averages are taking shape already pointing upwards.
disclaimer
*** This is not a recommendation to purchase and/or sale. It is for educational purposes only. ***

GBP/AUD ANALYSIS + POTENTIAL SHORT POSITION!GBPAUD has been moving strongly to the upside for some time now creating consistent LH and HH, confirmed with the multiple bounces off the trendline. Price has been ranging throughout the London and New York sessions today, however at 5PM GMT the market has broken out of a major 4H support zone @1.75700. A bearish candle closed below 1.75700 on the 1H timeframe which indicates further downside potential. There is now a retest taking place of the 1.75700 zone, if this candle closes bullish but below 1.75700 then I am confident that the market is going to move further to the downside towards 1.75400 and I will be looking to enter a SELL position.
Feel free to like this post if you agree with my analysis, comment any thoughts or ideas you may have and follow me for more content!
Happy Trading!

GBO USD PUSH DOWNHello traders, welcome back to my page. I hope everyone is having a good trading week so far. Lets keep it that way. 2021 starting off RIGHT YA FEEL ME!
If you are new here, consider liking this idea because it tells me you guys are messin with the content. But with out further a due, lets get it!
So as we can see, we have some weakness from the pound. This is shown by the inverted hammer on the top of this 1H formation. I have it circled in red. this tells me that the sellers have pushed price down stronger than the buyers were able to push up, a nice indication of a downward movement. We can pair this with the recent crossover of the 2 EMA's marked on my chart.
Also, during the London session, we can observe price tried to move back up but it only ended up making a lower high compared to the previous move up, which was yesterday during the day.
My chart shows the little details as well as my potential targets.
Remember to trade smart and trade safe! Precision over EVERYTHING!!!

EURJPY - POSSIBLE TREND LINE BREAK TO THE DOWNSIDEHere is my analysis behind EURJPY and why I think with the current price action we could be seeing a swing to the downside to reach 125.000
Remember, always wait for candle closure!
Leave a comment if you agree, disagree or have any questions :)

EURUSD - Signal by Keltner - Stoch - ADX 14 Jan 2021Risk/reward: 1/1.3 | Entry by: Upper/Lower | Keltner crossing: 2 | Candle not entry: 80% | Stochastic: 70/15 | Adx: 31/9/9 | Notrade friday
Max risk: 1.5% - Risk / reward: 1 / 1.3.
1. Trend identification:
... Keltner: Price Through Upper / Lower 1 gives 1 point. 2 points are eligible for entry.
... Stochastic:
...... k> 70: Uptrend. k <15: Down trend.
... ADX: 31 provides strong trend following signal.
2. Entry point:
... Price corrects to Upper / Lower when 3 conditions Keltner , Stochastic & ADX indicator meet.
3. Not trade friday.
4. Entry point 2: Entry 1 is available. Risk/reward: 1/2.
**** Percentage of Entry 2 < 50%.

USDCAD - POSSIBLE DOWNTREND CONTINUATIONHere I explain all the reasons why I think we could see another push to the downside for USDCAD and why we could see possibly new lows for this pair at 1.26000.
Leave a comment if you agree, disagree or have any questions :)

AUDCAD LONG-BollingerBands acting as support
-Price bounced off support by Forming a bullish engulfing
-TP= High of the london session
-SL= Low of bullish engulfing

GBPUSD Short into longs IDEAHi Guys,
This is my first publication of an trading idea.
Keep in mind price could go always push a bit higher before falling to our area of interest for the long position.
I won't put R/R Tools on these charts as of yet as i like to have more of a PA (Price action) confirmation before entering a trade myself.
Anyway thats it for my first trading idea.
If you guys have any questions about my trading style or anything like that feel free to leave a comment!
Keep on grinding guys!
Peace,
Daytrading Dave

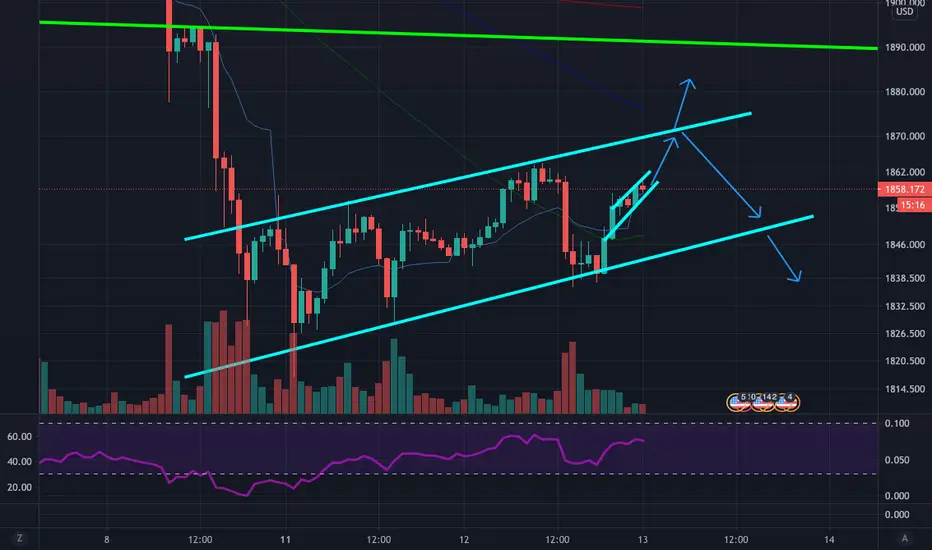
GOLD B/E Next Setup! Our last trade was a break even. Now we are looking at a few key areas. We are trading with the ascending channel playing off the support the resistance. If we break 1869 there is limited resistance which could give us a further bullish push and a break to the upside of the channel.
Inversely if we break down and break the support we will made a new lower low around 1815.
We will wait for a confirmation of the channel to make our next move.
GBPUSD LOOKING FOR A DROP... (MY THOUGHTS)Wow, its been a long time since I have been on here. Dont worry, I have been trading in the time being, i just havent been posting. Alas, here i am again, I miss you guys hope everyone is well. So my first idea back online;
As I observe the chart of GBPUSD, I notice alot of fluctuation at this high level that price has established. We were bullish during the first half of London session and this tells me that we can possibly see a reversal since price likes to change directions during NY session (SOMETIMES, Not always)
We can see on the hourly chart, price made a candle with a long wick up top, a sell indication (potentially, if all other factors line up) Pair this with the fact that price has been making lower highs and lower lows, pay attention to where price changes direction, even if its something that doesnt look that significant.
If we need further verification, we can see that the Hourly RSI as well as the 15M is heavily over-bought, not our main signal, but it is a supporting signal to go off of.
Nontheless, Im favoring a short on this pair as of now, good luck traders. Practice good risk management and remember to be PATIENT!!!
Observe, Execute, Play. Dont hesitate to make a move
FOLLOW ME FOR MORE IDEAS. PROMISE IM POSTING EVERYDAY FROM NOW ON, I NEED TO PUT IN SOME WORK!!!

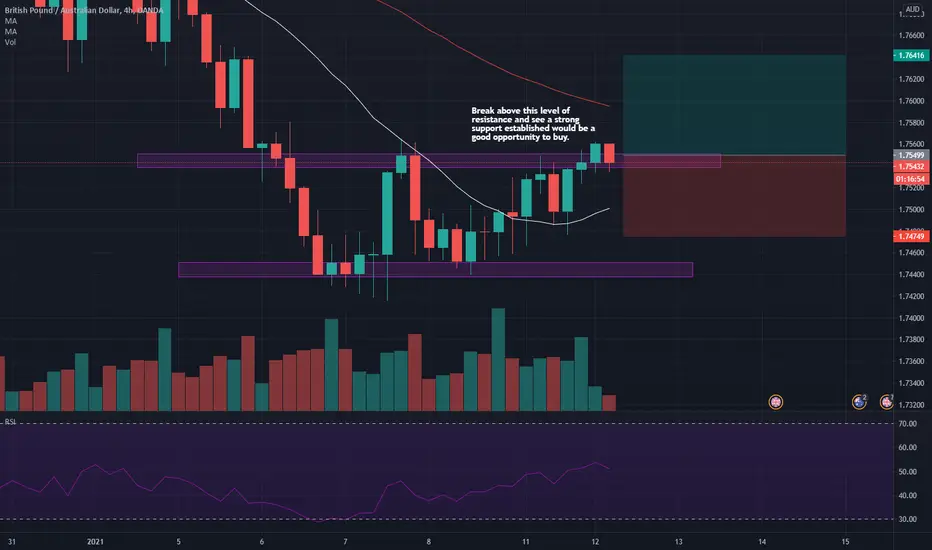
GBPAUD Long IdeaOANDA:GBPAUD
Here is my take on the GBP/AUD Pair for the coming days.
Waiting for a break above H4 resistance and retest.
Also, strong price rejections at the bottom which prompts me a bullish bias on this pair.
EURUSD - Signal by Keltner - Stoch - ADX 12Jan 2021Risk/reward: 1/1.3 | Entry by: Upper/Lower | Keltner crossing: 2 | Candle not entry: 80% | Stochastic: 70/15 | Adx: 31/9/9 | Notrade friday
Max risk: 3% - Risk / reward: 1 / 1.3.
1. Trend identification:
... Keltner: Price Through Upper / Lower 1 gives 1 point. 2 points are eligible for entry.
... Stochastic:
...... k> 70: Uptrend. k <15: Down trend.
... ADX: 31 provides strong trend following signal.
2. Entry point:
... Price corrects to Upper / Lower when 3 conditions Keltner , Stochastic & ADX indicator meet.
3. Not trade friday.
