GOLD: Pre-market PrepSo for gold today, I see a lot of confluence around the prior week's high, prior day's high, and the prior value area high. We also had a poor high last Friday that we've clearly broken through.
Right now, we're in balance up above these key levels. My immediate plan is to continue going long up to the prior month's value area high. If we get a pullback to the confluence area, I want to take it up from there.
If the market opens and we accept back into the previous area, I'll be looking to go short from that area and take it down. That's my main analysis for gold today. Let’s trade smart, peace!
Daytrader

XAUUSDgold has played over a week and finally took a long as we know it will fly on wednesday but trap with seller.. i am looking for continue long on gold, as i have drw simple line reason is clear w pattern,, and the (bos) .. lets see is it flying without fvg, or lit a bit to fill the fuel..what are your thought let me know in the comment.

Pre-Market Prep 7.18.2025What it do, everyone! Here’s my pre-market prep for Friday, July 18th. Just to give you a quick overview, I'm using my prior value areas, the prior day's high and low, and the CVA levels from my market profile. I use all this history to help me plan my trades for the day.
So, starting with the S&P, as of now we’re green across the board. We’re in balance up from the prior day’s range, value area, and the CVA. My main plan is to look for acceptance and a pullback to a confluence area for longs. If we get rotational and break out of that area, I’m ready to go short.
For the NASDAQ, it's a similar story. We’re rotational in the prior value area and range, but we’re balanced up from the recent CVA. Right now, I’m waiting to see if we can confirm acceptance and then I’ll look for a short from that rotational area down to the prior value area low.
In the Russell, I’m seeing clear acceptance above all levels, so a pullback to the confluence area for a long would be ideal.
For Gold, I’m also seeing it in balance up on all fronts. My first move would be a long from the prior day’s high. If we drop a bit lower, I’ll be looking at that CVA and PVA area for another long.
The Euro is a bit more mixed. We’re rotational in the prior day’s range but balanced up in the value area and CVA. I want to clear the prior day’s high before taking any big moves.
The Yen is also rotational, so I’m looking to trade the extremes, maybe some scalps while we’re balanced in the prior value area.
For the Aussie Dollar, we’re in balance up from the PVA, but rotational in the prior day’s range and CVA. I’m looking for shorts near the top area and longs at the bottom, staying out of the middle for now.
And finally, Crude Oil is rotational on all fronts. My first plan is to look for shorts from the confluence area down to the prior day’s range.
That’s my pre-market prep for today. Let’s trade smart. Happy Friday, peace!

Pre-Market Prep
Today, I'm narrowing down to six key markets. For the S&P, it's all about waiting for a pullback from the prior day's high or a breakout above the CVA. If it dips back inside the range, I'm ready to go short with some scalps.
For the NASDAQ, it's looking strong. I'm thinking about a long position if it pulls back to the prior day's high.
Gold is in a downtrend across all areas, and I'm already in a short position from the CVA low. I'm thinking about adding to that if it pulls back to the prior day's low.
Crude Oil is pretty balanced. I'm looking at the high of the CVA for a short opportunity if it gets there.
For the Yen and Euro, both are rotational. I'm eyeing long opportunities if they show some acceptance and pullbacks from key levels.
That's the vibe for today. Let's trade smart, avoid the chop, and keep it moving. Peace!


Trading Day SummaryTrading Day Summary
Today wasn’t a winning day on the books, but it was a major win in discipline.
I hit my daily loss limit before 10 AM, stopped live trading, and switched over to paper trades to protect my capital.
The setups I took—especially in Gold and Euro—lacked full confirmation, and one overnight trade didn’t align with my plan.
I experienced around $200 in slippage, which added to the loss.
The bright side? I stayed in control. No revenge trades. No emotional spirals.
My paper trade afterward was textbook—5R+ potential. That tells me the strategy is sound. Execution and timing just need to be sharper.
Bottom line: this is a marathon, not a sprint. I’m proud of the discipline and the mindset. Tomorrow, we reset and refocus.

Mid-Session Market ReviewMid-Session Market Review
S&P 500: After some initial volatility from the 8:30 news, the market accepted above the prior day’s levels but has since pulled back within range, consolidating just below the highs.
NASDAQ: The NASDAQ remains above all of yesterday’s levels and is currently balancing between the high of the day and the 23,100 level, showing a rotational pattern.
Russell 2000: This market is rotational within the prior day’s range and has accepted below the CVA and PVA. Potential trade opportunities might come with a pullback to the 2,245 area.
Gold: Gold has accepted below the prior value area and is still rotational within the CVA. Trade opportunities could present themselves near the prior day’s low.
Crude Oil: The market is quite choppy, hovering around the prior day’s low and value area low. Caution is advised, with potential long opportunities on a pullback, as long as conditions align.
Euro Dollar: The Euro is dropping significantly, moving below all key levels without much respect for them. This could provide short opportunities if there’s a pullback.
Yen: Similar to the Euro, the Yen is also pushing below previous levels. It’s getting choppy near the CVA low, so caution is needed until it shows more respect for those levels.
Natural Gas: The market is rotational within the prior day’s range and respecting the CVA high. Long opportunities might be possible if conditions are right.
Aussie Dollar: It’s showing some respect for the CVA low and is still rotational. There could be a potential long setup forming, depending on how it plays out.
British Pound: The Pound has accepted below all key levels, and a pullback to the CVA low might provide short opportunities, though caution is needed around the VWAP.

End-of-Session Market ReviewToday was a solid trading day with some interesting moves across the markets:
S&P 500: The market trended upwards from the open, gradually moving into and above the prior day’s value area, closing near the high of that range.
NASDAQ 100: After some initial back-and-forth, it climbed above the prior day’s high and value area, showing strength into the close.
Russell 2000: This market was quite choppy and balanced for a good part of the session, but eventually pushed up to close near the prior value area high.
Gold: It stayed range-bound, moving between the CVA high and the prior day’s value area without breaking out.
Crude Oil: We saw a significant drop right from the start, with prices falling about 1.5 points and ending the day lower, though still within the prior day’s range.
Euro Dollar: It tested the CVA low, dipped below the prior day’s low, and then bounced back to close around that level.
Yen Dollar: It started near the prior value area low, accepted below it by midday, and remained balanced in that lower range.
Aussie Dollar: Initially, it held above the CVA area and tested a higher level before sharply dropping below the prior day’s low and then balancing in that lower area.
In total, I took eight trades today. Two of them were in the Yen, both valid setups that didn’t work out and ended in stop-outs. I also took some long trades in the Aussie Dollar that I probably could have avoided since the market was choppy.
On the positive side, I managed risk well and ended up with two winning trades that put me in the green by about $1,200. Overall, I’d rate today as an A- day. Moving forward, I’ll focus on staying out of choppy markets, paying attention to the developing value area, and possibly using Heikin Ashi bars for better clarity.

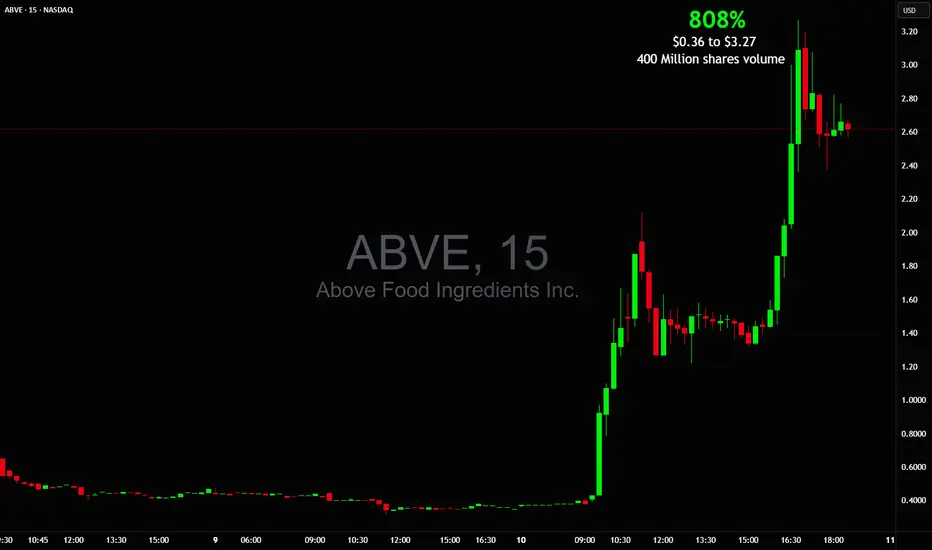
WOW! 808% in 1 day $0.36 to $3.27 on BIG 400M+ shares tradedMentioned it in chat several times with breakout prices
It traded more shares than NASDAQ:NVDA NASDAQ:TSLA NASDAQ:AAPL and NASDAQ:AMZN combined!
NASDAQ:ABVE picture perfect after hours squeeze
HUGE +979% day $4 to $46 on 100M shares traded $BMNR🚀 HUGE +979% day $4 to $46 BMNR on 100M shares traded 🤯
Shortsellers were trying all kinds of manipulations during the day but at the end got squeezed after hours
#stockmarket #stocktrading #trader #daytrading #chart #10X

Gold Short Term OutlookYesterday, we noted that gold was attempting a recovery from the Support Zone but remained below both the 50 and 200 MAs, meaning bearish pressure was still intact.
Since then, price has broken and held above $3,298, and is now trading around $3,330, just beneath the 200MA.
This marks a shift in short-term momentum — gold has reclaimed the 50MA and is now challenging the 200MA.
If bulls manage to break and hold above the $3,327 resistance, it could open the path toward $3,352 - $3,364 and potentially higher resistance zones.
However, if price rejects the 200MA and fails to hold above $3,327, we may see a pullback toward $3,298 or deeper into $3,270, where bulls could look to reload.
📌 Key Levels to Watch:
Resistance:
$3,327 • $3,364 • $3,383 • $3,400
Support:
$3,298 • $3,270 • $3,241
🧠 Fundamental Focus:
📌 Fed Chair Powell speaks today at the ECB Forum in Portugal.
Markets will closely watch for any shift in tone on inflation or rate outlook. His comments may influence USD direction and gold volatility.
📌 ISM Manufacturing PMI – a key gauge of economic activity. A strong print may pressure gold; a weak reading could support it.
📌 JOLTS Job Openings – offers insight into labor market strength. A tighter market could delay rate cuts and weigh on gold.
With multiple risk events packed into today, expect increased volatility across the board.

GBP/CAD (Two Trade Recaps) EUR/NZD Long and GBP/JPY LongEUR/NZD Long
Minimum entry requirements:
- If tight non-structured 15 min continuation forms, 5 min risk entry within it if the continuation is structured on the 5 min chart or reduced risk entry on the break of it.
- If tight structured 15 min continuation forms, reduced risk entry on the break of it or 15 min risk entry within it.
- If tight non-structured 1H continuation forms, 15 min risk entry within it if the continuation is structured on the 15 min chart or reduced risk entry on the break of it.
- If tight structured 1H continuation forms, 1H risk entry within it or reduced risk entry on the break of it.
GBP/JPY Long
Minimum entry requirements:
- Tap into area of value.
- 1H impulse up above area of value.
- If tight non-structured 15 min continuation follows, 5 min risk entry within it if the continuation is structured on the 5 min chart or reduced risk entry on the break of it.
- If tight structured 15 min continuation follows, reduced risk entry on the break of it or 15 min risk entry within it.

+266% in ONE DAY from $1.30 to $4.75 $RCT🔥 +266% in ONE DAY from $1.30 to $4.76 🚀
Spotted the setup early, but my official safety criteria checklist wasn't all green due to price action until later when it was too late NASDAQ:RCT
Sometimes discipline keeps you out early on even when the move goes wild

500% in a day banger from $0.32 to $1.95 $IBO500% in a day banger 🚀Please bring another stock like this today $0.32 to $1.95 AMEX:IBO
In and out at safest levels, no holding and hoping, then we move on to the next stock and keep repeating until too much money is made 🤑

EUR/AUD Short, EUR/NZD Short, NZD/USD Long and AUD/NZD ShortEUR/AUD Short
Minimum entry requirements:
- If tight non-structured 1H continuation forms, 15 min risk entry within it if the continuation is structured on the 15 min chart or reduced risk entry on the break of it.
- If tight structured 1H continuation forms, 1H risk entry within it or reduced risk entry on the break of it.
EUR/NZD Short
Minimum entry requirements:
- If tight non-structured 1H continuation forms, 15 min risk entry within it if the continuation is structured on the 15 min chart or reduced risk entry on the break of it.
- If tight structured 1H continuation forms, 1H risk entry within it or reduced risk entry on the break of it.
NZD/USD Long
Minimum entry requirements:
- If tight non-structured 1H continuation forms, 15 min risk entry within it if the continuation is structured on the 15 min chart.
- If tight structured 1H continuation forms, 1H risk entry within it.
AUD/NZD Short
Minimum entry requirements:
- If tight non-structured 1H continuation forms, 15 min risk entry within it if the continuation is structured on the 15 min chart.
- If tight structured 1H continuation forms, 1H risk entry within it.

EUR/AUD ShortEUR/AUD Short
Minimum entry requirements:
- 1H impulse down below area of interest.
- If tight non-structured 5 min continuation follows, reduced risk entry on the break of it.
- If tight structured 5 min continuation follows, reduced risk entry on the break of it or 5 min risk entry within it.
- If tight non-structured 15 min continuation follows, 5 min risk entry within it if the continuation is structured on the 5 min chart or reduced risk entry on the break of it.
- If tight structured 15 min continuation follows, reduced risk entry on the break of it or 15 min risk entry within it.

Another Banger $2.82 to $13.10 with 364% total move $APVOCatching just a piece of this kind of move pays a lot when moves are 300%+
Sitting at +72% realized gain over the past 3 days since the week started, from just 5 trades!
More to come this market is awesome
NASDAQ:APVO

$6 to $27 in minutes after market open $CERONASDAQ:CERO went $6 to $27. All I did was just take safest piece of the move, bought right before halt and sold into easy gap up blowout after halt 🎯

HUGE $1.45 to $10.84 in hours +647% run with Double Buy! $SRMMentioned it in chat early premarket, then warned again as it started setting up. Buy Alert twice with $5.86 average price and waiting for the new highs blowout.
Huge win into the strong push 💸✈️ NASDAQ:SRM

$3 to $20 in 1 day! 517% verticalPrice action was signaling $20 so I alerted a buy in teens and said if you don't mind swings give it a chance for $20. Soon after we got the $20 for an awesome win! NASDAQ:RBNE

EUR/USD Short and GBP/USD ShortEUR/USD Short
Minimum entry requirements:
- If tight non-structured 15 min continuation forms, 5 min risk entry within it if the continuation is structured on the 5 min chart or reduced risk entry on the break of it.
- If tight structured 15 min continuation forms, reduced risk entry on the break of it or 15 min risk entry within it.
- If tight non-structured 1H continuation forms, 15 min risk entry within it if the continuation is structured on the 15 min chart or reduced risk entry on the break of it.
- If tight structured 1H continuation forms, 1H risk entry within it or reduced risk entry on the break of it.
GBP/USD Short
Minimum entry requirements:
- If tight non-structured 1H continuation forms, 15 min risk entry within it if the continuation is structured on the 15 min chart.
- If tight structured 1H continuation forms, 1H risk entry within it.

Strongest stock of the day with 3 Buy $CGTL1st and 3rd alert paid for the whole day, including 2nd which was cut quick at $1.70

Just crazy $XTIA in minutesFrom halt to halt, doubling on power volume. It started the year at $60 seems like traders are looking at that as they're buying into vertical.
