XAU/USD: Potential Reaction at Supply Zone*On the 4H timeframe, XAU/USD has shown a clear CHoCH (Change of Character), with the previous Higher Low (HL) being broken, taking out Buy-Side Liquidity near the highs. Price is now trading within a supply zone, aligning with bearish order flow.
On the 30M timeframe (see chart):
• A CHoCH has been identified within the supply area, signaling a potential shift in direction.
• Price looking to clear the inducement (IDM) before tapping into the zone, strengthening the likelihood of a sell-off.
• I’m anticipating a reaction and continuation to the downside, targeting lower liquidity levels around $2,730.500.
Key Points:
• Bearish Bias from the 4H Supply Zone.
• Liquidity grab + CHoCH on the 30M confirms bearish intent.
• Targeting the lows near $2,730.500 for a high-probability trade setup.
Trade Idea:
Wait for confirmation within the 30M supply zone (e.g., a lower timeframe entry such as a CHoCH or breaker structure). Maintain discipline and proper risk management.
What do you think about this setup? Drop your thoughts below!
Bless Trading!
Daytrading

NASDAQ 100 (NAS100USD): Assessing the Potential BreakoutOver the past few months, the NASDAQ 100 (NAS100USD) has demonstrated a clear upward trajectory, marked by higher highs and higher lows—a classic sign of sustained bullish sentiment. However, we've seen periods of consolidation and recent volatility - let's take a look at its current technical landscape.
Current Market Overview:
As of January 29, 2025, the NASDAQ 100 is trading at approximately 21,600, a level that has served as a significant pivot point in recent trading sessions. A decisive move above this threshold could validate the ongoing uptrend and open the door to further gains.
Key Levels to Monitor:
Immediate Resistance : The 21,600 level is crucial. A sustained break above this point could signal the continuation of the bullish trend.
Support Levels : Should the price retreat, the 21,300 - 21,200 are notable support areas to watch.
Recent Developments:
The market has recently experienced heightened volatility, notably a sharp dip around January 27, followed by an aggressive recovery. This shows how unpredictable the market can be and hints at continued bullish movement.
Strategic Considerations:
Breakout Confirmation : A sustained move above 21,600, ideally accompanied by increased trading volume, would provide stronger confirmation of the breakout.
Support Retest : If the price successfully breaches the 21,600 resistance, this level could transform into a support zone. A subsequent retest of this level as support could present a compelling entry opportunity for long positions.
However , considering the Fed decision and fundamental factors around todays announcement - the most likely scenario would be slightly hawkish or a hawkish pause , which would be somewhat negative for the index. This would allow price to experience a temporary drop back down to the previous support (demand) level of 21,200 before buyers re-engage.
Trading Strategies:
Long Positions on Breakout Confirmation : A clear break and close above 21,600 could signal a long (buy) entry.
Long Positions on Retest of Support : A pullback to the 21,200 support level (assuming it holds) could offer a better opportunity to enter long positions.
Disclaimer:
This analysis is for informational purposes only and should not be considered financial advice. Trading involves significant risk, and it's essential to conduct your own thorough research and analysis before making any investment decisions. Past performance is not indicative of future results. Always use appropriate risk management techniques and trade responsibly. OANDA:NAS100USD IG:NASDAQ PEPPERSTONE:NAS100

EurJpy ideal longI'll be looking to Long EurJpy at 160.776 which is my H4 point of interest while taking a previous Monday low 160.955 as Inducement. Please note the data feed and compare it with whichever data feed you are using.
Kindly boost this post if you done it insightful 🫴

EUR/USD LongEUR/USD Long
Minimum entry requirements:
• 1H impulse up above area of interest.
• If tight non-structured 5 min continuation follows, reduced risk entry on the break of it.
• If tight structured 5 min continuation follows, reduced risk entry on the break of it or 5 min risk entry within it.
• If tight non-structured 15 min continuation follows, 5 min risk entry within it if the continuation is structured on the 5 min chart or reduced risk entry on the break of it.
• If tight structured 15 min continuation follows, reduced risk entry on the break of it or 15 min risk entry within it.

XRP/USD: Continuation of Bullish Momentum Towards 3.3901 In this analysis, I entered an XRP/USD trade at 2.8887, utilizing Smart Money Concepts (SMC) and inducements for precise direction and entry timing. My trading framework combines multiple timeframes to ensure alignment with market structure and intent.

EUR/USD Long, GBP/USD Short and EUR/GBP ShortEUR/USD Long
Minimum entry requirements:
• 1H impulse up above area of interest.
• If tight non-structured 5 min continuation follows, reduced risk entry on the break of it.
• If tight structured 5 min continuation follows, reduced risk entry on the break of it or 5 min risk entry within it.
• If tight non-structured 15 min continuation follows, 5 min risk entry within it if the continuation is structured on the 5 min chart or reduced risk entry on the break of it.
• If tight structured 15 min continuation follows, reduced risk entry on the break of it or 15 min risk entry within it.
GBP/USD Short
Minimum entry requirements:
• 1H impulse down below area of interest.
• If tight non-structured 15 min continuation follows, 5 min risk entry within it if the continuation is structured on the 5 min chart or reduced risk entry on the break of it.
• If tight structured 15 min continuation follows, reduced risk entry on the break of it or 15 min risk entry within it.
EUR/GBP Short
Minimum entry requirements:
• If structured 3 touch 1H continuation forms, 1H risk entry within it.

Nightly $SPX / $SPY Predictions for 1.28.2024🔮
📅 Tue Jan 28
⏰ 10:00am
📊 CB Consumer Confidence: 105.9 (prev: 104.7)
💡 Global Events:
🚩 China PMI: Key manufacturing data impacting global growth.
🍵 U.K. Business Report: Updates on investments and pensions.
📊 Earnings: GM and LMT pre-market results.
💡 Market Insights:
📈 GAP ABOVE HPZ:
A further gap up would lead to it holding for a little, then chopping near the EEZ.
📊 OPEN WITHIN EEZ:
Breakout to the EEZ, make a higher push, and round out the top.
📉 GAP BELOW HCZ:
Due to the ongoing momentum, we will get a slight recovery but still drop and chop back down into the lower range.
#trading #stock #stockmarket #today #daytrading #charting #trendtao

EUR/USD Long, GBP/USD Short, GBP/NZD Short and GBP/JPY ShortEUR/USD Long
Minimum entry requirements:
• 1H impulse up above area of inflection.
• If tight non-structured 5 min continuation follows, reduced risk entry on the break of it.
• If tight structured 5 min continuation follows, reduced risk entry on the break of it or 5 min risk entry within it.
• If tight non-structured 15 min continuation follows, 5 min risk entry within it if the continuation is structured on the 5 min chart or reduced risk entry on the break of it.
• If tight structured 15 min continuation follows, reduced risk entry on the break of it or 15 min risk entry within it.
GBP/USD Short
Minimum entry requirements:
• 1H impulse down.
• If tight non-structured 15 min continuation follows, 5 min risk entry within it if the continuation is structured on the 5 min chart or reduced risk entry on the break of it.
• If tight structured 15 min continuation follows, reduced risk entry on the break of it or 15 min risk entry within it.
GBP/NZD Short
Minimum entry requirements:
• 1H impulse down below area of interest.
• If tight non-structured 5 min continuation follows, reduced risk entry on the break of it.
• If tight structured 5 min continuation follows, reduced risk entry on the break of it or 5 min risk entry within it.
• If tight non-structured 15 min continuation follows, 5 min risk entry within it if the continuation is structured on the 5 min chart or reduced risk entry on the break of it.
• If tight structured 15 min continuation follows, reduced risk entry on the break of it or 15 min risk entry within it.
GBP/JPY Short
Minimum entry requirements:
• 1H impulse down below area of interest.
• If tight non-structured 15 min continuation follows, 5 min risk entry within it if the continuation is structured on the 5 min chart or reduced risk entry on the break of it.
• If tight structured 15 min continuation follows, reduced risk entry on the break of it or 15 min risk entry within it.

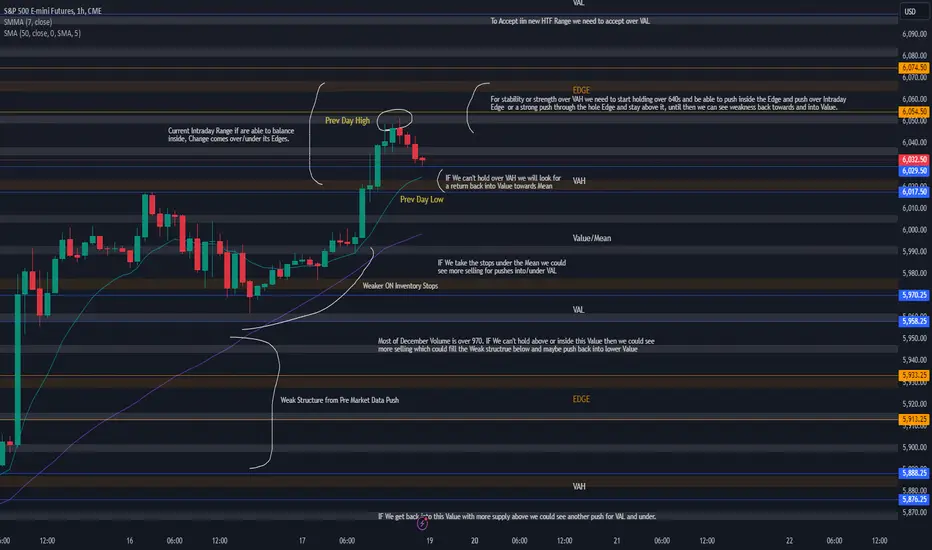
#ES_F Day Trading Prep Week 1.26 - 1.31.25Last Week :
Last week we opened over the Value of 6054 - 5933 HTF Range and were able to hold over, when we got over the Edge that brought in more buying that gave us a push into new HTF Value of 6195 - 6074 Range where we have sold off from before after contract roll and we closed Friday with a rejection from a push into VAH.
This Week :
Last week of the month, new president is in, what can we expect this week ?
Well looking at the structure we had a perfect rejection from the top on Friday which of course doesn't exactly have to be a top but if it were one it would be a very good looking one on the Daily TF if it was one.
Going into this week IF we can't get over VAH and hold over 6160 - 70 to build supply to take higher over upper Edge then we could see balancing inside the Intraday Range of current Value to build supply and digest the move we had last week that is IF we have truly accepted in this 6195 - 6074 HTF Range. IF we have not found the needed acceptance here and we start getting continuation into VAL we have Poor/Weak RTH Lows there at 6111 which we could aim for, If taken out that could give us more selling to at least fill the Gap we created into 6093 area.
From there we would watch if we absorb all the selling and can get back into above Value or if we can't and we hold under 6100 then we could see more selling to push into lower Edge and IF we happen to get inside it under 6070 then moves back towards lower VAH/Value are not out of the question as long as we can get through 6050s

Nightly SPX/SPX/SPY Predictions for 1.27.2024🔮
📅 Mon Jan 27
No major U.S. data
🌍 Global Watch: ECB signals 2025 rate cuts (25–50 bps expected).
📅 Tue Jan 28
⏰ 10:00am ET
📊 CB Consumer Confidence: 105.9 (prev: 104.7)
🌍 Global Watch: Eurozone inflation rises to 2.4% (stagflation risks).
📅 Wed Jan 29
⏰ 2:00pm ET
📊 Federal Funds Rate: 4.50% (prev: 4.50%)
📜 FOMC Statement
⏰ 2:30pm ET
🎙️ FOMC Press Conference
🌍 Global Watch: ECB downgrades 2025 GDP to 1.1% (Germany recession).
📅 Thu Jan 30
⏰ 8:30am ET
📊 Advance GDP q/q: 2.7% (prev: 3.1%)
📊 Unemployment Claims: 221K (prev: 223K)
🌍 Global Watch: ECB rate decision (25–50 bps cut expected).
📅 Fri Jan 31
⏰ 8:30am ET
📊 Core PCE Price Index m/m: 0.2% (prev: 0.1%)
📊 Employment Cost Index q/q: 0.9% (prev: 0.8%)
🌍 Global Watch: Eurozone Q4 GDP forecast: 0.3–0.4% (spillover risk).
💡 Market Insights:
📈 GAP ABOVE HPZ:
A further gap up would lead to it holding for a little, then dropping back down into the EEZ.
📊 OPEN WITHIN EEZ:
Hard to move up higher, so will slowly chop down to the Cushion levels.
📉 GAP BELOW HCZ:
Due to the ongoing momentum, we will get a slight recovery but still drop and chop back down into the lower range.
#trading #stock #stockmarket #today #daytrading #charting #trendtao

H5 Day Trade Review! Crushed $BE Trade x2🚀 H5 Day Trade Review
Check out how we absolutely nailed NYSE:BE day trades two days in a row! 👇

us100 day trade signalHello everyone i want to share my day trade signal at us 100
open short position at 21775
Stop loss 21800
Take profit 21700
Always manage your risk!!!

N3/USDT VOLUME INCREASEN3/USDT VOLUME INCREASE
There is good chance this coin can increase in the coming time new uptrend volme

Nightly $SPX / $SPY Predictions for 1.24.2024🔮
📅 Fri Jan 24
⏰ 8:30am
📊 Core PCE Price Index m/m: 0.1%
📊 Employment Cost Index q/q: 0.8%
⏰ 9:45am
📊 Chicago PMI: 36.9
💡 Market Insights:
📈 GAP ABOVE HPZ:
A further gap up would lead to it holding for a little, then dropping back down into the EEZ.
📊 OPEN WITHIN EEZ:
Trump mentioned he will try to lower the rates. Let’s see how the markets adjust to it, but definitely expecting a little more bullishness to the upside.
📉 GAP BELOW HCZ:
A large recovery will allow the markets to tag the red lines before closing slightly lower below the weekly HPZ.
#trading #stock #stockmarket #today #daytrading #swingtrading #charting #investing

Nightly $SPX / $SPY Predictions for 1.23.2024🔮
📅 Thu Jan 23
🗓️ Day 4
📍 WEF Annual Meetings
⏰ 8:30am
📊 Unemployment Claims: 221K (prev: 217K)
⏰ 11:00am
🎙️ President Trump Speaks
🛢️ Crude Oil Inventories: -0.1M (prev: -2.0M)
💡 Market Insights:
📈 GAP ABOVE HPZ:
If we gap up once more, we will break all-time highs. This will be met by a big decline to juice liquidity.
📊 OPEN WITHIN EEZ:
Only resistance left, looking for a small pop up into the weekly zone to get a drop back down into the HCZ and HEL.
📉 GAP BELOW HCZ:
We will likely get a small bounce, hold, and chop down.
#trading #stock #stockmarket #today #daytrading #swingtrading #charting #investing

Quick Trade Idea with some Mental NotesSharing my personal trading journey and emotions here with you guys. I've been working on passing this 53K challenge and have been getting stuck mentally these past few days but best believe we are working through it. I am also a big believer that we are learning deeply very fundamental information these days through our losses and mitigation of these losses.
🚨 Risk Disclaimer and Disclosure
Trading futures and other leveraged instruments involves significant risk and is not suitable for all investors. This video is for educational and entertainment purposes only and should not be considered financial advice. Any trades or strategies discussed are based on my personal analysis and approach. Results are not guaranteed, and past performance is not indicative of future results. Always consult a licensed financial advisor and do your own research before trading.
You are responsible for your own trades and financial decisions. By watching this video, you acknowledge that trading carries risk, and you should never trade with money you cannot afford to lose.

GBP/USD Short and GBP/JPY ShortGBP/USD Short
Minimum entry requirements:
• Corrective tap into area of value.
• 4H risk entry or two 1H high test rejections.
Minimum entry requirements:
• 1H impulse down below area of value.
• If tight 5 min continuation follows, reduced risk entry on the break of it.
• If tight 15 min continuation follows, 5 min risk entry within it, or reduced risk entry on the break of it.
GBP/JPY Short
Minimum entry requirements:
• Tap into area of value.
• 1H impulse down below area of value.
• If tight 5 min continuation follows, reduced risk entry on the break of it.
• If tight 15 min continuation follows, 5 min risk entry within it, or reduced risk entry on the break of it.

HD TREND BULLISH Home depot - Bullish
Key points :
Tech View :
Weekly - Uptrend and Strong Support Level
Day - Higher High Makes ( Uptrend )
Wait for Little Bit Correction .
Entry - 398 $
Stoploss - 379 $
Target - 429 $
This is Not a Recommendation . Only for Educational Purpose ..
Thank You .. Happy Trading ..

Nightly $SPX / $SPY Predictions for 1.21.2024🔮
📅 Tue Jan 21
🗓️ Day 2
📍 WEF Annual Meetings
📅 Wed Jan 22
🗓️ Day 3
📍 WEF Annual Meetings
📅 Thu Jan 23
🗓️ Day 4
📍 WEF Annual Meetings
⏰ 8:30am
📊 Unemployment Claims: 220K (prev: 217K)
⏰ 11:00am
🛢️ Crude Oil Inventories: -2.0M
📅 Fri Jan 24
🗓️ Day 5
📍 WEF Annual Meetings
⏰ 9:45am
📊 Flash Manufacturing PMI: 49.4
📊 Flash Services PMI: 56.8
⏰ 10:00am
📊 Existing Home Sales: 4.19M (prev: 4.15M)
📊 Revised UoM Consumer Sentiment: 73.2
💡 Market Insights:
📈 GAP ABOVE HPZ:
On a gap up, we will get pinned down at HPZ back into the EEZ.
📊 OPEN WITHIN EEZ:
A lot of resistance overhead. Markets should cool down after the gaps from last week. Small rally into fade downwards.
📉 GAP BELOW HCZ:
We will likely get a small bounce and hold.
#trading #stock #stockmarket #today #daytrading #swingtrading #charting #investing

GbpCad Short biasFirst trade set-up of the week. I'm looking to short from 1.76637. that's my poi. Till we clear previous week low which is Monday low 1.74561
That zone is interesting cause it is within an old week imbalance. Hence price would always be moved by Imbalance and Liquidity.
Please boost if you find this insightful 🫴

GBP/JPY Short, NZD/JPY Long, USD/CAD Short and CHF/JPY ShortGBP/JPY Short
Minimum entry requirements:
• Tap into area of value.
• 1H impulse down below area of value.
• If tight 5 min continuation follows, reduced risk entry on the break of it.
• If tight 15 min continuation follows, 5 min risk entry within it, or reduced risk entry on the break of it.
NZD/JPY Long
Minimum entry requirements:
• 1H impulse up above area of interest.
• If tight 15 min continuation follows, 5 min risk entry within it, or reduced risk entry on the break of it.
USD/CAD Short
Minimum entry requirements:
• If tight 15 min continuation forms, 5 min risk entry within it, or reduced risk entry on the break of it.
CHF/JPY Short
Minimum entry requirements:
• Corrective tap into area of value 1.
• 4H risk entry.
Minimum entry requirements:
• Tap into area of value 2.
• 1H impulse down below area of value 2.
• If tight 15 min continuation follows, 5 min risk entry within it, or reduced risk entry on the break of it.

#ES_F Day Trading Prep Week 1.20 - 1.24Market closed outside of Value after failing under 6074 - 54 HTF Edge.
We are set to open inside 6064 - 23 Intraday Range unless market gaps under/over after Mondays Holiday but if we open inside it then that tells us we are over Value and there are two thing we can do here, continue grinding/balancing inside the Intraday Range and try to push towards/into above Edge ?
Or do we find more selling over Value that would bring us back into/under VAH, if we get under VAH we would be under Daily Stops so that could trigger moves towards the Mean/VAL of the range. If we do get back inside the Value we could find support and holds around it BUT careful if we take out out and get under Value, that can bring in more weakness for lower targets where we would watch for any continuation.
IF the strength from last week stays, for us to see any bigger prices out of this HTF Range we would need to hold over VAH and have a strong push into or over the above Edge that would stay over, until then we have December supply trapped over 6050 - 74 so we may stay under this area and most of December Supply is valued over 930 - 70s and we have January month end approaching which means if more size needs to lighten the bag that could trigger some lower destinations.
VVAIFU/USDT INCREASE DAY TRADEVVAIFU/USDT NEW INCREASE DAY TRADE
The study shows that Morpho has a good chance to break in the coming time for this reason a follow.
We choose the coins not based on what we expect or think but on what the data shows as having the highest chance of increasing. And then it will still be unexpected market. There are no guarantees in markets.
