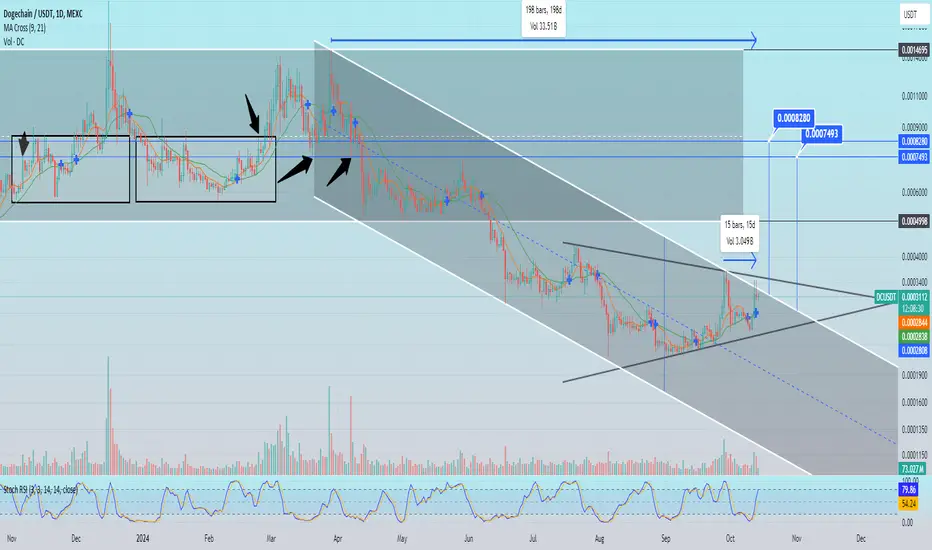
DogechainDc usdt Daily analysis
Time frame 4hours
Risk rewards ratio >3 👈👌
Here is a very good time to entrance and cache decisions big fish in short-term
Dc

DC. Descending channel.Imo this descending channel is key to determining AMEX:DC trend as a whole. You can accumulate here, you can wait for probable price exit to trade breakout point. From here there can be both the lowest values and the highest. Market is not predictable at the moment.

DC. Parabola with moon target.Bullish flag on daily candles with $0.00089 target. Medium term move will mark the beginning of impressive trend.

DC. Playbook. Having broken through the triangle, the price went up exactly to the height of the pattern. Now we are testing global descending channel, which was broken. Please note that testing and price correction occurs against the background of oversold by RSI. Considering the beginning of the bull market and the mass excitement of retail for DOGE, I want to say that this is an ultra-bullish situation and in addition to holding the asset, I would prefer to accumulate more.

DC. Before I wake.Assuming that DC is completing a bullish consolidation, it is reasonable to extrapolate the expected growth. In my opinion, the price will not reach the lower boundary of the triangle, but will systematically trade higher and test the resistance level.

DC. $0.0014 price target.The falling wedge, as one of the basic patterns for this chart, is an excellent indicator of where the price will go in the medium term. Also, I noted potential trading levels, which in turn are resistance and, in the case of a bullrun and continuation of the upward trend, will be support levels.

DC. Patterns in price action.Quite an accurate test of the descending channel after breakout. Pay attention to the moving averages and probable price action. The patterns in price action may be similar. DC is on the cusp of global growth.

DC. Parabola?If you look closely, you can see a parabola forming here, originating from $0.000215 level. Probable level of the parabola top may be equal to the height of the channel - that is, the level to which the price will reach upon breaking through descending channel. Again, the price has touched the level of June prices. This means that we have a sideways trend for 140 days and those who accumulate in it are buying the bottom.

DC. Growth potential x10 in 8 days.If we extrapolate the historical chart to the present time, we can assume that asset is capable of experiencing a similar upward movement. Given the bull market factor and ratio of assets in liquidity pools on decentralized exchanges, x10 may only be the beginning of global growth.

DC. Hold your bags. We are moving.Get ready for the uptrend to continue. From current candle high, the price has made 300% up in 56 days if you looking back. Hold your bags. Prepare for volatility. We are moving.

DC. Several patterns indicates moon.Descending global channel, which has been the main one in the trend formation for the last six months, has been broken. Now, based on several patterns, we can assume that the trend is broken and the moon will coming soon. Potential formation of a golden cross, equilateral triangle, a descending wedge - will probably throw the price above all trading levels. Get ready, accumulate more.

DC. Soon.Price tests moving average for the first time in over half a year + buying volume is at its best in 8 months. If market trend continues, the result of testing the upper line of the triangle will be pattern breakout and an upward move to $0.0008

DC. Everything new is a well-forgotten old.The global descending channel formed in April is currently under pressure. The price has been testing the resistance line for two weeks. The potential breakout looks interesting for two reasons:
1. The price target of the channel breakout with a probable time lag, which is due to the formation of an equilateral triangle, curiously coincides with reference points from more than six months ago.
2. The price target of the channel breakout with a probable time lag, which is due to the formation of an equilateral triangle, curiously coincides with the trading area from more than six months ago.
DC. Reversed Head and Shoulders.The potential formation of the "Inverted Head and Shoulders" pattern indicates a local trend change is coming. Considering all my previous ideas and considering what the chart says - a change in the global trend is coming. Structures are being built, structures in the plural, which together can create a bullish trend. And in my subjective view, the trend can be impressive.

DC. Potential Cup and Handle with 775% gain.Here it is important to initially pay attention to moving averages and fact that the price has taken hold above the long-term moving average for the first time more than half a year. The price is potentially forming a Cup and Handle pattern on a two-year downtrend. Moon soon.

DC. Bottomed out.DC through the prism of the Fibonacci grid has a minimum 389% growth potential. If CRYPTOCAP:DOGE shake out the market again then all dogs-meme assets will spike hard. RSI is oversold on the monthly and weekly charts. Bottomed out.

DC. Again and Again.RSI is in the oversold zone on a local uptrend + the price is narrowing the range, forming an equilateral triangle since July. Risk/reward looks good for forming a spot position or trading with a small leverage. Potentially, the price is able to move within triangle for several more months, which also curiously coincides with the beginning of the final growth impulse of both Bitcoin and entire market.

DC. Ascending Triangle.The time interval for the triangle formation is approx 29 days. An upward exit implies a 100% growth. If price now finds support from the long-term moving average, then the average will act as resistance in upcoming bull run of the asset. The price growth, as well as the volume growth, coincides with abnormally increased activity in Dogecoin chain. Remember that it is the Dogecoin community that is inspiration behind the creation of the smart contract blockchain for Dogecoin chain and community.

DC. Rubicō.Descending wedge after a long downward move. The breakout height is 400% up. DC price may break out of the ranges sharply as they have all been traded.

Dakota Gold (NYSE: DC) Set for a Potential BreakoutDakota Gold Corp. (NYSE: DC) is making waves in the gold exploration sector, and recent developments suggest that the stock could be on the brink of a significant breakout. The company’s exploration efforts, particularly at the Maitland Gold Project, have yielded impressive results, positioning Dakota Gold as a promising player in the industry. In this article, we'll dive into the technical and fundamental aspects of DC, highlighting why this stock deserves your attention.
Technical Overview: A Bullish Setup You Can’t Ignore
Dakota Gold Corp. (DC) is currently exhibiting strong technical indicators that point to a bullish trend. The stock has solidified its support at $2.24, creating a robust base for potential upward movement. This support level has been tested multiple times, and the stock has consistently bounced back, demonstrating resilience and investor confidence.
The next resistance level is pegged at $2.73. A break above this level could trigger a substantial rally, potentially propelling the stock to new highs. Currently trading above its 50-day Moving Average (MA), DC is showing signs of a bullish trend reversal. Historically, stocks that maintain this pattern tend to outperform in the subsequent months, and DC could be no exception.
The Relative Strength Index (RSI) for DC is at 57.55, indicating that the stock is in a comfortable range. It’s avoiding overbought territory while maintaining upward momentum, suggesting that the stock is neither overstretched nor oversold. This balance offers a promising entry point for investors looking to capitalize on the stock’s growth potential.
Further supporting the bullish outlook is the Moving Average Convergence Divergence (MACD) indicator, which currently stands at 0.0465. The MACD line crossing above the signal line is a classic indicator of bullish momentum, suggesting that DC’s price could continue to rise in the near term.
A Strong Case for Long-Term Growth
On the fundamental side, Dakota Gold Corp. has been making significant strides in its exploration efforts. Last week, the company announced a major breakthrough at the Unionville Zone of the Maitland Gold Project, where it intercepted 2.85 grams/tonne (g/t) of gold over 13.7 meters of Tertiary epithermal mineralization. This discovery is part of an ongoing drill program that has already confirmed the extension of the Unionville Zone strike to at least 2,000 meters, with the potential to extend further based on rock chip samples.
These results are particularly exciting because they indicate the presence of both Tertiary epithermal gold mineralization and the potential for deeper, higher-grade mineralization. As Dakota Gold continues to explore this area, the probability of encountering additional high-grade gold deposits increases, adding significant optionality and value to the company's portfolio.
James Berry, Vice President of Exploration at Dakota Gold, has emphasized the importance of these findings, stating, “These results continue to confirm our belief that the Tertiary epithermal system at Maitland is comprised of multiple structures across a broad area extending over several kilometers. As we continue to explore this area for deeper Homestake Mine-Style gold mineralization targets, we expect to encounter additional higher-grade Tertiary epithermal mineralization at the same time.”
Dakota Gold currently has four drills on site at its properties in the Homestake District of South Dakota. The Unionville Zone drilling is part of a broader exploration strategy that also includes testing for Homestake Mine-Style gold mineralization at the JB Gold Zone and infill and step-out drilling at the Richmond Hill Gold Project.
Market Dynamics and Growth Prospects
The broader gold market is also playing a crucial role in DC’s potential. With gold prices showing bullish momentum, driven by a weaker U.S. dollar and declining U.S. yields, the metal's role as a safe-haven asset is being reinforced. This macroeconomic backdrop creates a favorable environment for gold exploration companies like Dakota Gold.
As the company continues to expand its exploration activities in the Black Hills region, it’s well-positioned to capitalize on rising gold prices. With several high-potential targets identified for drilling, Dakota Gold is on track to increase its resource base, which could lead to substantial long-term growth.
Furthermore, Dakota Gold’s commitment to expanding its gold resources through aggressive drilling programs is a testament to its strategic vision. The ongoing projects in the Homestake District, including the Maitland and Richmond Hill properties, are expected to add significant value to the company’s portfolio.
Conclusion
Dakota Gold Corp. (NYSE: AMEX:DC )'s current technical setup suggests a bullish trend, with strong support levels and indicators pointing to potential upward movement. On the fundamental side, the company’s successful exploration efforts, particularly at the Maitland Gold Project, highlight its growth potential and strategic importance in the gold exploration sector.
As gold prices continue to rise and Dakota Gold advances its exploration programs, DC is a stock to watch. Investors looking for exposure to the gold market with strong upside potential should consider adding Dakota Gold Corp. ( AMEX:DC ) to their portfolios.

Dogechain $DC meme sznCheap lottery tickets - 200M $ market cap inevitable
Target: $0.00717682 (11x)
STOP: 0

DC. Ready for new ranges.A party price below-near-above the pattern foreshadows an imminent outcome of events. All dog asset holders need to be in position, folks. The price exit will be sharp and strong. Get ready! The targets are at least several times higher.

DC. Doge v2.The past bull cycle has shown how powerful social currents can be in crypto. DC-chain is designed to be a solution for involving smart contracts in the ecosystem. Is it so? Time will tell. At this point, if you buy DC, you either smart money or lose money. Given the risk/reward ratio, I prefer to have skin in the game.
