BTC Long-Term Outlook/Analysis + Life GoalsI've charted this since last year, maybe since May, idk.
It shows two possible directions depending on what structure breaks.
Well, it broke Market Structure towards the upside, and has been following the price path that I laid out almost to a T/tee/tea(whatever).
So yeah. It just might follow it, or it might not and just straight up dumps on the higher timeframe, but that's unlikely?
Like, what could cause a worldwide massive sell off that would plummet the BTC price?
Well, of course, if the people and organizations that hold the massive BTC wallets would just randomly sell off their holdings. That would crash BTC.
But why would they do that?
So, in the end, my point is, if you think about it...
The dollar and current worldwide economy is crashing... so where do they turn to?
Bitcoin.
Not gold, not USD, but Bitcoin.
I think gold is also a "stablecoin", something you can rely on to hold value.
I think, going forward, I would like to keep accumulating bitcoin and gold, when I have the money to accumulate.
My goal in my financial life would be, to keep accumulating cash daily(through business, work, and trading), and keep DCA'ing into Bitcoin and Gold regardless of the market.
DCA

Adobe Target $539 - After Consolidation🐂 Trade Idea: Long - ADBE
🔥 Account Risk: 2.50%
📈 Recommended Product: Stock
🔍 Entry: +/- 446.00
🐿 DCA: Yes, down to 400.00
😫 Stop-Loss: 357.00
🎯 Take-Profit #1: 539.00 (50%)
🎯 Take Profit #2: -
🎯 Trail Rest: Yes
🚨🚨🚨 Important: Don’t forget to always wait for strong confirmation once possible entry zone is reached. Trade ideas don’t work all the time no matter how good they look. Do not get a victim of FOMO, there is always another trade idea waiting. 🚨🚨🚨
If you like what you see don’t forget to leave a comment 💬 or smash that like ❤️ button!
—
Adobe participated in the AI boom and made more than 50% from its May low at around 325.00. Huge selling pressure came in around 520.00 showing stronger resistance in that area. We’ll need to see some more consolidation before considering stepping in. First buy zone would be around 446.00 from where one can DCA-in into the stock down to 400.00. We might not see the stock reaching the second buy zone, so consider start buying in multiple tranches starting in buy zone 1.
—
Disclaimer & Disclosures pursuant to §34b WpHG
The trades shown here related to stocks, cryptos, commodities, ETFs and funds are always subject to risks. All texts as well as the notes and information do not constitute investment advice or recommendations. They have been taken from publicly available sources to the best of our knowledge and belief. All information provided (all thoughts, forecasts, comments, hints, advice, stop loss, take profit, etc.) are for educational and private entertainment purposes only.
Nevertheless, no liability can be assumed for the correctness in each individual case. Should visitors to this site adopt the content provided as their own or follow any advice given, they act on their own responsibility.

Is Dash the old gem with a new trend?Dash is an old cryptocurrency that belongs to the gem generation and recently provided a hardfork on June 17. The coin's fall in value is worth nothing, which dropped from $74.4 to $25, representing a significant 66% decrease. Typically, high drops within this range often act as a pause before the next wave of potential coin gains.
I have identified certain areas in the price trend that could indicate potential liquidity points. These areas are important to keep an eye on as they may influence future price movement. It would be beneficial to closely monitor the chart and make use of a bot to make fast deals.
More than that, look at the top wallets of DASH, they are still accumulating coins.
In my view, I advise you to always keep in mind the three essential factors:
Implement a stop-loss strategy for your trades to manage risk effectively.
Pay attention to the chart structure, taking note of both Higher highs and lower lows. Always keep in mind trends.
Stay informed about the news, particularly regarding Bitcoin's behavior, as it can significantly impact the overall market.
Please show your support and subscribe to my channel. I have interesting content this Friday, where I will write about the top AI coins to trade with bots.

Do ALTS HAVE A CHANCE #BTC DOMINANCE Its A GANN STUDY…IF THE DOMINANCE enters the chart like always there optionsDCA SAFELY… A GANN Study #BTCSTARBURST

The Struggle of Consistency: Navigating DCA in Crypto InvestingHello dear @TradingView community! Today let’s focus on what is Dollar Cost Averaging ?
Determining the optimal moment to buy cryptocurrency is often a challenging task due to the high volatility of crypto assets. Prices can fluctuate unpredictably at any given time, leading traders to experience the fear of missing out (FOMO).
This fear is commonly felt when the price of a cryptocurrency, such as Bitcoin (BTC), suddenly surges or plunges. During price drops, individuals tend to panic and sell their holdings in a frantic attempt to avoid further losses. Conversely, when prices rise, panic ensues as people worry they don't possess enough coins to sell.
As evident, making decisions to buy or sell cryptocurrencies is no easy feat. However, if you seek long-term financial gains from cryptocurrencies without succumbing to the anxiety caused by every price spike, it would be wise to consider the Dollar Cost Averaging (DCA) strategy. Let's delve deeper into what DCA entails and how it functions in the realm of cryptocurrencies.
What is Dollar Cost Averaging?
Dollar cost averaging is an investment strategy where fixed amounts are regularly invested at consistent intervals, in contrast to a one-time lump sum investment. This approach involves executing transactions regardless of the asset's current price or market fluctuations. It is highly favored by investors and management funds seeking long-term profits from various assets like ETFs, commodities, cryptocurrencies, stocks, and more.
How does DCA work? To employ the DCA strategy, you first determine the amount of cryptocurrency you wish to invest. In conventional investing, one would typically invest the entire designated sum in a specific asset. However, with DCA, you invest fixed amounts of USD into Bitcoin or any other asset over a designated period. For instance, you may choose to purchase $100 worth of BTC every month for a 10 year period.
When utilizing DCA, the selection of the cryptocurrency becomes crucial. With around 22,904 cryptocurrencies available today, you must pick a coin you believe will appreciate in value and yield profitable returns. You can even choose an ETF which follows the trend (up or down) for any specific asset or basket of assets.
To comprehend how DCA operates, consider the following example:
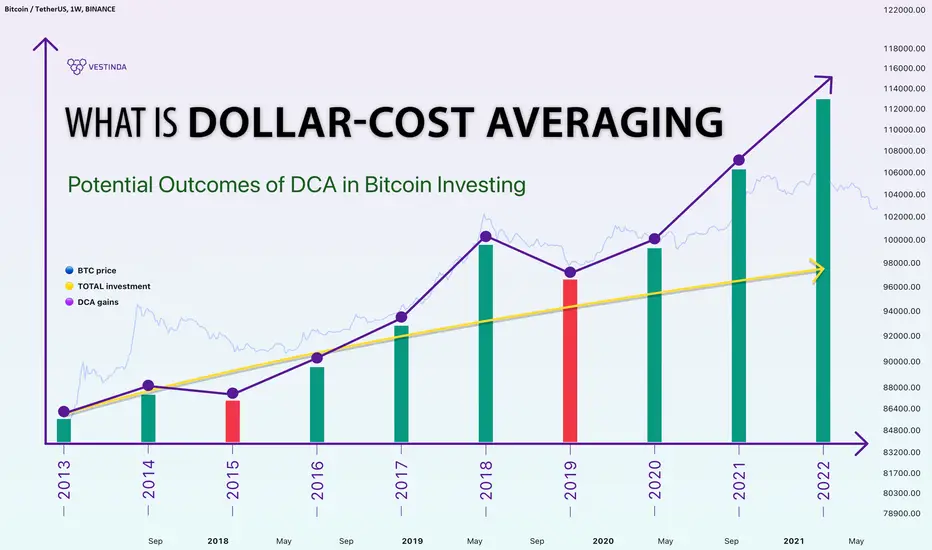
Let's assume it is June of 2014, and Katie decides to allocate $10,000 in BTC. In June of 2014, the price of Bitcoin stood at approximately $560 per coin. Instead of investing the entire sum at once, Katie opts for dollar cost averaging throughout the 9 years.
From June 2014 to May 2022, Katie spent $100 each month on BTC, disregarding market price fluctuations. After 8 years, she spends almost $9,600 and her earnings reflect the following:
The green line in the chart represents Katie’s total investment amount, while the orange line depicts the fluctuation of portfolio size value over the 9-year period. When Katie initiated his investments, both the cost of BTC and his investments were approximately $100. However, as time progressed, the price of Bitcoin underwent changes.
By May of 2022, Katie's $9,600 investment had grown to $287,518 worth of BTC, showcasing a growth rate of 2,895%. With maximum gain of $631,540 at bitcoin ATH.
Online DCA tools are also available to estimate the earnings from purchasing bitcoins over several months. For example, platforms like dcaBTC enable users to customize their DCA strategy according to their preferences, specifying the amount to purchase, investment frequency, and duration.
To successfully implement dollar-cost averaging (DCA) in Bitcoin investing, several key steps need to be followed. These steps involve setting a budget, choosing a reputable cryptocurrency exchange, establishing recurring purchases or utilizing recurring purchases and automated investment platforms (such as Binance, Coinbase, Kraken, Crypto.com or even at Vestinda), and monitoring and adjusting the strategy as necessary.
Pros and Cons of Dollar Cost Averaging
Let's commence with the pros of dollar cost averaging. By making regular and consistent purchases over time, you mitigate the risk associated with poorly timed lump sum investments. Additionally, since you make regular purchases, you alleviate the fear of missing out and impulsive decision-making prompted by price fluctuations.
Cryptocurrency exchanges and platforms charge transaction fees for every trade. While one might assume that DCA would result in higher commission fees, it is essential to remember that this is a long-term strategy. The commission costs are negligible compared to the potential profits that can be realized over several years.
Moreover, DCA does not necessitate substantial investments. This strategy involves smaller and consistent purchases, eliminating the need to determine how best to deploy a large sum in one go. Furthermore, if prices suddenly drop at the time of purchase, you can acquire the cryptocurrency at a lower price.
However, it is important to note that if the cryptocurrency's price is bullish, you may end up buying at a higher price. This is particularly relevant when dealing with BTC or any chosen cryptocurrency. Many crypto enthusiasts and investors prefer to purchase a significant amount at once, fearing a subsequent price surge in the hours, days, weeks, or months to come.
As previously mentioned, with the DCA strategy, you purchase small amounts at regular intervals, regardless of market stability.
Should you utilize the DCA Strategy?
DCA facilitates maximizing profits with relatively low risk. Although this approach is not devoid of drawbacks, it offers numerous advantages that can be leveraged to your benefit.
Hence, is DCA worth your time and money? As always, we recommend thoroughly studying all available information before making any decisions. Save this article to your browser bookmarks for easy reference in the future.
Happy trading!
3rd Pine Script Lesson: Open a command & send it to a Mizar BotWelcome back to our TradingView tutorial series! We have reached lesson number 3 where we will be learning how to open a command on TradingView and send it to a Mizar Bot.
If you're new here and missed the first two lessons, we highly recommend starting there as they provide a solid foundation for understanding the concepts we'll be covering today. In the first lesson, you will be learning how to create a Bollinger Band indicator using Pine Script:
In the second lesson, you will be guided through every step of coding the entry logic for your own Bollinger Band indicator using Pine Script:
In this brief tutorial, we'll walk you through the process of utilizing your custom indicator, Mikilap, to determine the ideal timing for sending a standard JSON command to a Mizar DCA bot. By the end of this lesson, you'll have the ability to fine-tune your trading strategies directly on Mizar using indicators from TradingView. So, sit back, grab a cup of coffee (or tea), and let's get started!
To establish a common starting point for everyone, please use the following code as a starting point. It incorporates the homework assignment from our Pine Script lesson number 2. By using this code as our foundation, we can collectively build upon it and delve into additional concepts together. So, sit back, grab a cup of coffee (or tea), and let's get started!
// This source code is subject to the terms of the Mozilla Public License 2.0 at mozilla.org
// Mizar Example Code - Lesson I - Coding an indicator
// version 1.0 - April 2023
// Intellectual property © Mizar.com
// Mizar-Killer-Long-Approach ("Mikilap")
//@version=5
// Indicator script initiation
indicator(title = "Mizar-Killer-Long-Approach", shorttitle = "Mikilap", overlay = true, max_labels_count = 300)
// Coin Pair with PREFIX
// Bitcoin / USDT on Binance as example / standard value on an 60 minutes = 1 hour timeframe
string symbol_full = input.symbol(defval = "BINANCE:BTCUSDT", title = "Select Pair:", group = "General")
string time_frame = input.string(defval = "60", title = "Timeframe:", tooltip = "Value in minutes, so 1 hour = 60", group = "General")
int length = input.int(defval = 21, title = "BB Length:", group = "Bollinger Band Setting")
src = input(defval = close, title="BB Source:", group = "Bollinger Band Setting")
float mult = input.float(defval = 2.0, title="BB Standard-Deviation:", group = "Bollinger Band Setting")
float lower_dev = input.float(defval = 0.1, title = "BB Lower Deviation in %:", group = "Bollinger Band Setting") / 100
int length_rsi = input.int(defval = 12, title = "RSI Length:", group = "RSI Setting")
src_rsi = input(defval = low, title="RSI Source;", group = "RSI Setting")
int rsi_min = input.int(defval = 25, title = "", inline = "RSI band", group = "RSI Setting")
int rsi_max = input.int(defval = 45, title = " < min RSI max > ", inline = "RSI band", group = "RSI Setting")
// Defintion of a Pine Script individual function to handle the Request and avoid Repainting Errors
Function_Mikilap(simple string coinpair, simple string tf_to_use) =>
int function_result = 0
bool barstate_info = barstate.isconfirmed
open_R, high_R, low_R, close_R = request.security(coinpair, tf_to_use, )
// Bollinger part of MIKILAP
src_cp = switch src
open => open_R
high => high_R
low => low_R
=> close_R
lower_band_cp = ta.sma(src_cp, length) - (mult * ta.stdev(src_cp, length))
lower_band_cp_devup = lower_band_cp + lower_band_cp * lower_dev
lower_band_cp_devdown = lower_band_cp - lower_band_cp * lower_dev
bool bb_entry = close_R < lower_band_cp_devup and close_R > lower_band_cp_devdown and barstate_info
// RSI part of MIKILAP
src_sb = switch src_rsi
open => open_R
high => high_R
low => low_R
=> close_R
rsi_val = ta.rsi(src_sb, length_rsi)
bool rsi_entry = rsi_min < rsi_val and rsi_max > rsi_val and barstate_info
// Check if all criteria are met
if bb_entry and rsi_entry
function_result += 1
if function_result == 1 and ticker.standard(syminfo.tickerid) == coinpair
label LE_arrow = label.new(x = bar_index, y = low_R, text = " 🢁 LE", yloc = yloc.belowbar, color = color.rgb(255,255,255,25),
style = label.style_none, textcolor = color.white, tooltip = str.tostring(open_R))
function_result
// Calling the Mikilap function to start the calculation
int indi_value = Function_Mikilap(symbol_full, time_frame)
color bg_color = indi_value ? color.rgb(180,180,180,75) : color.rgb(25, 25, 25, 100)
bgcolor(bg_color)
// Output on the chart
// plotting a band around the lower bandwith of a Bollinger Band for the active CoinPair on the chart
lower_bb = ta.sma(src, length) - (mult * ta.stdev(src, length))
lower_bb_devup = lower_bb + lower_bb * lower_dev
lower_bb_devdown = lower_bb - lower_bb * lower_dev
upper = plot(lower_bb_devup, "BB Dev UP", color=#faffaf)
lower = plot(lower_bb_devdown, "BB Dev DOWN", color=#faffaf)
fill(upper, lower, title = "BB Dev Background", color=color.rgb(245, 245, 80, 80))
Open a command to send to a Mizar Bot.
Let‘s continue coding
Our target: Use our own indicator: Mikilap, to define the timing to send a standard JSON command to a Mizar DCA bot.
(1) define the JSON command in a string, with variables for
- API key
- BOT id
- BASE asset (coin to trade)
(2) send the JSON command at the beginning of a new bar
(3) setup the TradingView alert to transport our JSON command via
Webhook/API to the Mizar DCA bot
Below you can see the code, which defines the individual strings to prepare the JSON command. In the following, we will explain line by line, what each individual string and command is used for.
// Defintion of a Pine Script individual function to handle the Request and avoid Repainting Errors
Function_Mikilap(simple string coinpair, simple string tf_to_use) =>
int function_result = 0
bool barstate_info = barstate.isconfirmed
open_R, high_R, low_R, close_R = request.security(coinpair, tf_to_use, )
//Text-strings for alerts via API / Webhook
string api_key = "top secret" // API key from MIZAR account
string symbol_prefix = str.replace(symbol_full, "BINANCE:", "", 0)
string symbol_name = str.replace(symbol_prefix, "USDT", "", 0)
string bot_id = "0000" // BOT id from MIZAR DCA bot
// String with JSON command as defined in format from MIZAR.COM
// BOT id, API key and the BASE asset are taken from separate variables
DCA bot identifier:
string api_key = "top secret"
string bot_id = "0000"
These both strings contain the info about your account (BOT owner) and the unique id of your bot, which should receive the JSON command.
BASE asset:
string symbol_prefix = str.replace(symbol_full, "BINANCE:", "", 0)
string symbol_name = str.replace(symbol_prefix, "USDT", "", 0)
The shortcut of the base asset will be taken out of the complete string for the coin pair by cutting out the CEX identifier and the quote asset.
JSON command for opening a position:
Entry_message = '{ "bot_id": "' + bot_id + '", "action": "' + "open-position" + '", "base_asset": "' + symbol_name + '", "quote_asset": "' + "USDT" + '", "api_key": "' + api_key + '" }'
If you want to have more info about all possible JSON commands for a DCA bot, please look into Mizar‘s docs: docs.mizar.com
As the JSON syntax requires quotation marks (“) as part of the command, we define the string for the entry message with single quotations ('). So please ensure to open and close these quotations before or after each operator (=, +, …).
Current status:
- We have the entry logic and show every possible entry on the chart => label.
- We have the JSON command ready in a combined string (Entry_message) including the BOT identifier (API key and BOT id) as well as the coin pair to buy.
What is missing?
- To send this message at the opening of a new bar as soon as the entry logic is true. As we know these moments already, because we are placing a label on the chart, we can use this condition for the label to send the message as well.
alert(): built-in function
- We recommend checking the syntax and parameters for alert() in the Pine Script Reference Manual. As we want to send only one opening command, we are using the alert.freq_once_per_bar. To prepare for more complex Pine Scripts, we have placed the alert() in a separate local scope of an if condition, which is not really needed in this script as of now.
if bb_entry and rsi_entry
function_result += 1
if function_result == 1
alert(Entry_message, alert.freq_once_per_bar)
if function_result == 1 and ticker.standard(syminfo.tickerid) == coinpair
label LE_arrow = label.new(x = bar_index, y = low_R, text = " 🢁 LE", yloc = yloc.belowbar, color = color.rgb(255,255,255,25),
style = label.style_none, textcolor = color.white, tooltip = str.tostring(open_R))
IMPORTANT REMARK:
Do not use this indicator for real trades! This example is for educational purposes only!
Configuration of the TradingView alert: on the top right of the chart screen, you will find the clock, which represents the alert section
a) click on the clock to open the alert section
b) click on the „+“ to create a new alert
c) set the condition to our indicator Mikilap and the menu will change its format (configuration of the TradingView alert)
For our script nothing else is to do (you may change the expiration date and alert name), except to add the Webhook address in the Notification tab.
Webhook URL: api.mizar.com
Congratulations on finishing the third lesson on TradingView - we hope you found it informative and engaging! You are now able to code a well-working easy Pine Script indicator, which will send signals and opening commands to your Mizar DCA bot.
We're committed to providing you with valuable insights and practical knowledge throughout this tutorial series. So, we'd love to hear from you! Please leave a comment below with your suggestions on what you'd like us to focus on in the next lesson.
Thanks for joining us on this learning journey, and we're excited to continue exploring TradingView with you!

MRVL DCA - Rectangle PatternCompany: Marvell Technology Group Ltd.
Ticker: MRVL
Exchange: NASDAQ
Sector: Technology
Introduction:
Greetings, fellow traders and investors! Today, we're diving into the daily scale chart of Marvell Technology Group Ltd. (MRVL), particularly observing a potential rectangle pattern that has formed after a clear downtrend.
Rectangle Pattern:
The rectangle pattern typically represents a period of consolidation, where price moves within a range between parallel support and resistance levels. It can be a bullish or bearish signal, with the trend direction determined by the eventual breakout.
Analysis:
Marvell Technology's stock has been consolidating in a rectangle pattern for about 225 days, with the price currently above the 200 EMA. The upper boundary of this rectangle is at $49.30, while the lower boundary is at $35.67. Both these boundaries have seen two touch points each.
Our focus now is on observing if the price can breach the upper boundary. As of now, Marvell Technology remains on our watchlist, showcasing potential for future movement.
Should a breakout occur above the upper boundary, we could be looking at a price target of $67.87. This implies a potential price increase of roughly 27.5%.
Conclusion:
Marvell Technology's daily chart points towards a consolidation phase, characterized by a potential rectangle pattern. A valid breakout above the rectangle's upper boundary could set off a bullish trend, offering a promising long position opportunity.
As always, please conduct your own due diligence and consider risk management strategies before making investment decisions.
If you found this analysis insightful, don't hesitate to like, share, and follow for more market updates. Happy trading!
Best regards,
Karim Subhieh


Bitcoin Buy Zone Floor you might not have another ChanceThere have been 4 Bitcoin Buy Zones since it's inception. We are currently in the 4th.
If you bought Bitcoin in the zone at an average cost you would ahead in your investment until the next zone and beyond.
The First Bitcoin BuyZone was way back in Oct 2014 with an average Buy point of $273. That Floor was never touch again
The Second Bitcoin BuyZone was on Nov 2018 with an average Buy point of $4288. That Floor was never touch again until the next BuyZone and only hit one time in that zone
The Third Bitcoin Buy Zone was on March 2020 with an average Buy point of $8409. That Floor was never touch again.
The Forth Bitcoin BuyZone hi on May 9th 2022 and we are establishing the next Floor.
Do you think this is just coincidence? Or do you have faith that we are establishing the next Bitcoin Floor.
Let me know in the comments below
~S

Bitcoin Buy Zone just triggered today 5/9/2022To all my friends,
I created this technique back in 2017. In May 2021 a year ago I published another article "Waiting for the next Bitcoin Buy Zone". Well today 5/9/2022 the Bitcoin Buy Zone just triggered.
You might want to scoop up some Bitcoin for the next few month and add it to your already Dollar Cost Average Strategy. Just Saying
Previous Buy Zones
Oct 2014 - Oct 2015: ($167- $230)
Nov 2018 - May 2019: ($3119 - $7195)
Mar 2020 - July 2020: ($4942 - $10261)
~S

Sony Group Corporation DCA - Inverted head and shoulders + C&HCompany: Sony Group Corporation
Ticker: 6758
Exchange: TSE
Sector: Electronics
Introduction:
Hello and thank you for taking the time to read my post. Today, we analyze the daily chart of Sony Group Corporation, focusing on an interesting combination of two price patterns, an inverted head and shoulders and a cup and handle pattern. This combination provides additional confirmation for classical chart analysts and offers a compelling trading opportunity.
Price Patterns:
Inverted Head and Shoulders: This pattern has been forming for 384 days and features a clear horizontal resistance line at ¥12,380. This serves as our reference point for the pattern.
Cup and Handle: The right shoulder of the inverted head and shoulders pattern contains a 126-day old cup and handle pattern, which provides further confirmation and a second possible price pattern. The same horizontal resistance line at ¥12,380 serves as the reference point for this pattern.
Bullish Environment:
The price has been above the 200 EMA for some time, indicating a bullish environment.
Price Targets:
Inverted Head and Shoulders: The price target for this pattern is ¥15,520, representing a potential price increase of 25%.
Cup and Handle: The price target for this pattern is ¥14,725, representing a potential price increase of 19%.
Trade Opportunity:
A breakout has occurred, making this trade actionable without further observation.
Conclusion:
The Sony Group Corporation daily chart analysis highlights the combination of an inverted head and shoulders pattern and a cup and handle pattern. This provides a compelling trade opportunity with clear price targets. As always, it's essential to consider risk management and proper position sizing when trading based on chart patterns.
Please note that this analysis is not financial advice. Always do your own due diligence when investing or trading.
If you found this analysis helpful, please like, share, and follow for more updates. Happy trading!
Best regards,
Karim Subhieh

Why You Need To Use Dollar Cost Averaging (DCA) For FuturesHey Guys,
Lots of my students ask about the Nasdaq so here is how to trade it.
It's important to note that Futures markets rise in value up and down over time. Getting a pin point price constantly is not what you need to do.
Relax. Just be a Trader.
Buy when the price is low and spread yourself out..
When it comes up, Sell and spread yourself out.
This naturally covers risk and allows you to accumulate a good deal.
After all, that's what Traders want.
My thoughts On Long/Short Areas also mentioned.

XDB CAPITULATION! Getting closer to the bottomXDB has been getting rekt recently. There is a lot of fud surrounding the project, however, fundamentally it is still stronger than ever. This is typical of the capitulation phase. I have seen this countless times before, and I am 100% convinced that it's going to moon like crazy after this is over. I have already started DCA'ing here at 0.0014, but the chart does not look like it has found a bottom yet. I'm expecting the ultimate bottom to be in the 0.0006 - 0.0008 range. Anything under 0.001 is an EXTREMELY good buying opportunity. I will follow up with a zoomed out 1d chart to show you how big of a bullrun I'm actually expecting after capitulation. It is close to 100x if you buy it at the exact bottom.

1-D BTC Chart - DCA StrategyOne day chart of Bitcoin, DCA, for long term.
STRAT:
Buy-In options:
+ On top of every single "orange box".
+ 0.5 in "GANN".
+ Purple Headlines "Buy-Ins".

AUDIO : THE DCA CYCLE COIN THAT ARE ABLE TO RUN $2 USDwe made since today a new study on the DCA coins that have a cycle with the possibility to increase the coming time for the year 2023.
We found out that AUDIO has a high chance to increase to targets of $0,66 and in a better trend way to a high target of $2 USD.
This coin shows a pattern of increase depending on the study, further it shows a DCA trend that could bring this coin into new breakouts.
We will follow this coin and see how far it can go.
For the short term, AUDIO is at a point where it can break out to $0,31 into short term.
This update is a view for 2023
The market can go up and down, but it's about the general view, and that is that this coin has a high chance of breakout in the coming time.
a real cycle coin comes always with a strong increase back also when it breakdown with the main market.

NAKAMOTO GAMES risk reward looking goodNAKAMOTO GAMES - the chart tell me a lot of upside here. 64 X to all time high. NAKAMOTO GAMES going up up up sense December and the botton could be in. NAKAMOTO is a gaming project with a lot of twitter followers (that could spread the message "buy buy" in a bull run)... we will probably hear a lot about NAKAMOTO next bull run. I think it could be a good time to buy next pull back and hold long term. This is not a financial advice. Gaming project could be very risky, do your own research. Be aware of the Small Market Cap, 8.1 million dollar....it can move fast.

LINK LONG (last spot trade 2022)SPOT (DCA) trade into LINK for long time hold.
2022 - What a Ugly crypto year! Chainlink (LINK) have now been ranging for quite a while. At the moment LINK are at the bottom on the "Daily-channel" -Stoch RSI oversold. Of course BTC can move to 10K-13K and LINK will follow that fall. But if you believe that we are close to the BTC-botton - the timing for DCA into LINK looking really good.

Some simple DCA idea. Maybe a bit better than the average one ?Hello, everyone. This is my first idea, so please pardon me if anything goes wrong.
With the bear knocking at the door a while ago, it seems that everything goes down. So maybe we should embrace the investor side ... The boring but rewarding path.
On bear markets, everyone accumulates. The DCA it seems a viable option, as they say : "Time in the market beats timing the market".
We could DCA by volume profile, Fibonacci retracements, or several other techniques. But why going so "complex" when we can make everything simple ?
On Crypto, it's tested that we will see at least 6 consecutive "30% drops" after the latest "30% drop", if not even more.
Influenced on this idea by our regretted mathematician, Mr. Fibo ... And applying it to the charts, I just have a new indicator with an embedded strategy inside.
In order to do everything right , I am asking the community to give me feedback. And if there is a real demand for my creation, I will respond accordingly :)
The questions will be :
1. Do you think this strategy will bring you profits ? If so, do you want to try my indicator for easier backtesting ?
2. How useful do you think it will be a trading automation website, to be launched in 2023 ? Dedicated to Risk/Reward ratio trades, but also containing this idea ?
I am humbly awaiting your response, so ... Let's help each other !
Best regards,
Ionuț

DCA $SOL A great opportunity for DCAing on Solana !
Remember, “the time to buy is when there's blood in the streets.”

BTC, PYR, LINK, VET time to DCA?!Market can still capitulate and altcoins will in that case drop 40-50% or so. But lets assume that the market will recover fast. If the short time downside is 40-50% and the longtime upside is multiples...I don't think "waiting for the perfect entry" is the best choice. Don't wait to long to DCA into your favourite altcoins that you believe will survive the bear market. If the market suddenly turn bullish, you will quickly lose that big X-factor, upside (multiples to all time high) that the market offers you right now. Here are three of my favourite coins to DCA into - VET/PYR/LINK.

Don't surrender Render - RNDR With a little bullish momentum in the market, we will see RNDR quickly wake up again!? If you don't believe in the "big capitulation leg down" - RNDR should be on your shopping list. I think it's a BIG chance we see RNDR 100%, before Bitcoin break 30K :). Use the horizontal support and trend line to find a great entry. Disclaimer - RNDR is extremely volatile and sometimes unpredictable - crazy wicks :)

BTC and ETH - Capitulation or Accumulation?The sentiment is so Bearish - is this the end of Crypto, really? Is it possible that BTC surprise "everybody" again...as usual? Anyhow, BTC and ETH looks similar, chart wise. I see two possible scenarios play out the common hours/days. Total Capitulation or horisontel Accumulation. BTC < 14K is a buy for me, ETH < 1K is also a buy for me.

Request VETBroke and retested the previous crucial support.
Highly unlikely to return back above.
But, if that happens, look at the white for shorts.
The green is a nice area for DCA if you know how to do it effectively.
* My macro view is coming!
