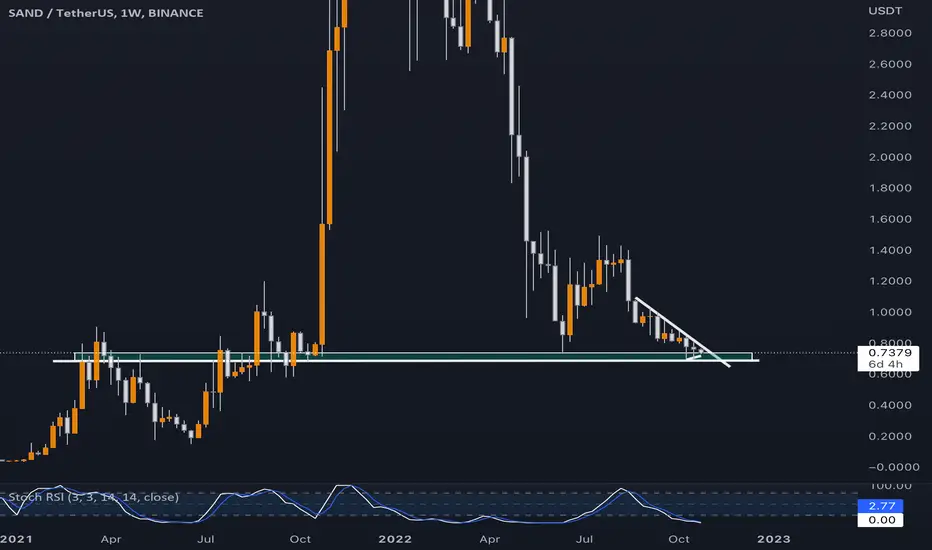
SAND long - 11 x from all time highOn weekly basis - RSI "screams" oversold . It's look like the right time to DCA - no financial advice :) . I'm not sure we will see much cheaper SAND than now. This "trade" is only about fundamentals and long time hold. 0.70-0.72 it's a great buy for me.
DCA
SMART DCA WITH TRAILINGHere is a spot trading strategy like smart DCA.
This strategy has noo stop loss, its only buying more and taking pofit with trailing.

LRC Flattening LRC is currently flattening at the bottom of a massive descending triangle. Breakout to .4 seems possible, but if we reject this range we could drop to the low .20s. DCAing a large position in this one, as I think we will see $2+ next bull run.

DCA for beginnersI made a visual explanation investing mid/long-term with DCA and of how effective DCA is and how to do it based on a weekly chart, no matter how much money you got, you can adapt to your capital
Understand that this is an example amongst many other and you are not obligated to follow this strategy, it's just to guide if you're new to DCA. It's not a financial advice.
also, it's important to understand the market cycles, and know when it's a bullrun, a bear market and an accumulation & expansion phase

COTI LONG - WEEKLY CLOSE OUTSIDE WEDGE I'm waiting for the moment when the big reversal to the upside coming. COTI has shown strength the last two weeks and are now about to break weekly trend. We could see a good DCA opportunity here if COTI close outside the wedge. On the other hand, a weekly close inside the wedge could mean that COTI drop to the floor of the wedge again.

BTC/USDHi all,
Hash Rate leads Difficulty in identifying Bitcoin Miner Capitulation.
Hash Ribbons is close to a buy signal and is it would be wise to pay attention.
Usually this indicator has a high probability of success if we analyze the history of buy signals and price action after that.
Since it is a lagging indicator, I frequently take DCA into account before BUY signals.
What do you think about this strategy?

BTCUSD Potential Bottom, Longterm Monthly Outlook & DCA StratJudging by the Volume, I am quite confident a potential bottom might be in.
Unfortunately, i do expect a painfully boring and long consolidation phase after this.
During these months / years, i will try to DCA as much as possible.
good luck!

Best DCA Strategy for Bitcoin and Other AltcoinsPink shows Strategy 1 that many people follow for DCA which is to buy on the first of each month.
Light green shows Strategy 2, which I find very reliable and is much more profitable in the long term.
In stochastic RSI settings, just change Lower Band to 10 instead of 20.
Now every time there is a crossover in Stochastic RSI below 10, you buy.

VeChain/USDT. Testing the 0.5 Fibonacci.Current Market Cap 1.69 Billion
Since it dumped to 0.00157 during the March 20 sell-off, VeChain rocketed up over %17,000 to a high of 27.9 cents!
Shortly after, the "Incredible Sell" prints, these signals should not be ignored on higher TF's.
Price has since corrected over 92% and finds itself @ the 0.5 Fib level (2 cents) This area is also previous resistance now being tested as support.
We also have a non confirmed conditional buy signal.
Should the 0.5 level not hold up, long term bulls should look for buys in the golden pocket (1 cent) This area is a support/demand zone / previous minor resistance.
The POC compliments the 0.786, (half a cent) long term bulls should reload again.
Biggest Volume Profile appears between 0.3 - 1 cent.
RSI is forming a nice falling wedge, a breakout + HH could initiate a rally. Stochastic is oversold.
Selling Volume has slowly declined over time.
Timing the tops/bottoms isn't important nor does it work. DCAing into your favourite projects that you believe in is best.
About..
VeChain is an enterprise blockchain platform that aims to provide a full view of an organization by disintermediating information from data silos.
VeChain also plans to become a leading platform for initial coin offerings (ICOs) and for conducting transactions between Internet of Things (IoT) connected devices.
VeChain makes use of two tokens: VeChain token (VET) as a value layer and VeChain Thor Energy (VTHO) as a smart contract layer.
Speculative Setup, DYOR. Allow 3-18+ Months For all Crypto Ideas.
Credit to @without_worries for allowing use of indicators.


Hello Dolphins.Guys here is a possible scenario for BTC in the upcoming week, BTC going to retest the 200MA weekly and continue it's way down to the 12/14 k region.

ETC buy zone is hereThis idea is crafted with a bullish mid term mindset, trading spot / 2x leverage with DCA implementation.
I am entirely aware if BTC breaks below 40k, it is likely that alts will be unpredictable. I am not considering this scenario in this idea.
ETC has been consolidating for about 210 days from its 183 ATH in may 2021.
My idea is that these levels marked 1, and 2 on the chart are a good place to accumulate based off BTC showing strength pushing 51k today.
Indicator wise, we have been reaching rock bottom RSI levels and deep momentum waves marked as blue boxes, both today and September 2020 have levels this deep.
You can see this was a relatively safe buy zone as ETC rose 3600% in the coming 200 days.
I have also marked an ABC structure coupled with a FIB from the top of the A wave and bottom of the B wave.
This would give an approximate secure profit level at somewhere around 170-260 USD.
It's entirely possible to retouch level 2 at around $17 if we saw BTC drop to 42k before pushing further upwards.

Bitcoin BuyZone Added RangesHi to all my HODLers,
Anyone that has followed me knows I've been publishing when is good time to DCA into #Bitcoin #BTC. This 4th BuyZone is not over anytime soon.
I was wondering what was the range for each buyzone. Basically what was the range between the low and high in the BuyZone.
Here are the results:
1st BuyZone range was 198%
2nd BuyZone range was 105%
3rd BuyZone range was 170%
Currently we are in the 4th BuyZone. Currently we are only at a 70% range. we have another 30-100% that can be added to this range if history is any indication?
I will be watching for many months to come. Speaking of time. Here is how long each BuyZone lasted:
1st BuyZone lasted 390 days
2nd BuyZone lasted 178 days
3rd BuyZone lasted 137 days
4th BuyZone currently is 38 days
We still have anywhere from 100 to 352 days to go. Hopefully the former :-).
Stay strong my friends
~S

BTC is in buying zoneReferring to Fibonacci Retracement for the previous cycles on log-scale, we see: BTC price often corrects to 0.618 - the golden dividing point of the uptrend.
In MSAP model: this is a good time to start DCA BTC for the next cycle ~ 2024-2026.

ETH Most likely scenario, 3 Very possible and accurate TargetsThis is in my opinion a very likely scenario of happening with about 30% chance of hitting target 3: i would say 50% of target 2. and 20% chance of we have hit bottom at target 1, and that accumulation phase could have started from here. Of courses these % chances are just my estimations, Even tho it may look like we been capitulated, knowing our past Capitulation candles and Recovery, and volume we haven't seen that yet. "Not a Financial Advice" But slowing DCA at these levels down to target 3 it's probably the most safe way of trading. hope i can help those who can get liquidated but don't know how low ti can go. i have adjusted my Liquidation Prices based on my analysis and others that i see online. remember that at the end of the day rule most important in trading is not to loose money !Protect your assets always.

When to DCA into Bitcoin?I've been critical of people DCAing blindly into Bitcoin during the initial drop. The reason is because I don't think one needs to use super fancy Technical Analysis to find the obvious level price wanted to go (the prior 2017 All Time High). Price often likes to find these levels and respect them (at least for a time). At that point... you can buy more Bitcoin at 20k with your Dollars.
Personally I am not buying yet. My thesis has remained the same from November 2021 that Bitcoin will retrace off the All Time High from 17k - 10k through 2023. Several data points about major liquidation points have become known to me during this bear cycle that confirm that thesis. Many investors I talk to remain confident and solvent. Unfortunately, it is the nature of market cycles that only broad pessimism marks a bottom.

STEP FInance Below Yearly VWAPJust got an alert that this coin is moving!
Clearly in downtrend, but someone pumped it yesterday and hit the VWAP.
Ideal to open a small position and DCA it until it pumps again to VWAP line!
Take care!

Disregard The Noise. XRP Will Eventually Pump. Bulls Load Up.First things first, I'm not the biggest fan of this centralised thing called XRP.
I don't like the propagandists on YouTube spreading rubbish like "XRP TO 10K, 25K ,50K, 100K" ", The Great Reset " etc..
But feelings don't matter here, and as my mentor repeatedly says - "Emotions man, A Money Killer"
Since it hit 10 cents during the March 20 sell-off, price then rallied 1800% to $1.96, the "Great Sell" then printed and price has since corrected 85% to 29 cents.
XRP never rallied again like the rest of the market, nor did it go on to make a new high like the rest of the top 10 coins, mainly due to the whole SEC saga, which I'm sure everyone is aware of by now.
Price currently hovers in the Fibonacci Golden Pocket, big Volume Profile can be found between there and the 0.786 fib level (19 cents)
A conditional "Incredible Buy" prints along with 5 bullish oscillators. Stochastic Oversold.
Long term Bulls should now be dollar cost averaging into their positions.
Buys from 17 - 19 cents would be excellent.
Can price drop further? Absolutely, I don't try timing tops or bottoms. Market sentiment is extremely bearish.
The financial system is unfathomably complex, and no one, the Fed included, can prepare for every possible scenario as it embarks on its most ambitious Quantitative Tightening program to date.
How will this affect cryptocurrency? Only time well tell!
XRP has a strong supporter base and I believe over time, Ripple will continue to nab customers from the 10,000 financial institutions that Swift has on the payroll.
Good Luck!
Speculative Setup, DYOR. Allow 3-18 Months For all Crypto Ideas.
Credit to @without_worries for allowing use of indicators.

No Bearish Volume WEEKLYJust to check again, after this month's CPI report, I looked at the Weekly chart & there's STILL no Bearish Volume. Whales are accumulating HODLing & REMOVING coins from exchanges. If you DCA NOW might be your chance to get your stack however you do so, whether through a shopping app, exchange or P2P. Not FA, but if you ever want a whole Bitcoin now is your chance. Should you wait for lower? Perhaps if we've blasted through 28K support below 2020 levels we may see lower. Will you DCA at 20K? 15K? Or will you flee back to the safety of dinosaur dollars?

#BTC daily outlookWe are given 3 scenarios in the Daily chart and all of them include a rebound of some sort obviously , but what is interesting is the levels we can get with them.
1st scenario - Rebound on the top of the last known demand zone, dating back to DEC 2020.
2nd scenario - Entering a range in that demand zone and finally leaving on the upside.
3rd scenario - Ranging in the last demand zone then leaving on the downside towards the 20k level. Not really a good thing, as many institutionals might cut off or be forced to cut off part of their investments, causing further selloffs . This is also a place where a lot of stop losses are found, so more sell pressure.
Fun fact - El Salvador has an average entry price of around $43k.
Fundamentals
- US CPI stayed high despite expectations of a slight drop, causing a selloff in the stock market and of course crypto.
- Investors are wary on how the FED will tackle the still increasing inflation
- US inflation hasn't yet peaked
- EU - Ukraine tensions still present
- Markets in ASIA are down aswel , people getting out of the latest lockdown.
Key note: This isn't a time to panic, this it the time where you take your pen and paper and note your DCA entries.

No Bearish VolumeShort & simple. No, I'm not your bitcoin support group leader. Yes you could be buying at these levels & even at 20K but that's none of my business. What I noticed since looking at the Monthly BTC Chart is that there is no bearish volume to cause real fear. Again, I've been doing this since BTC $800 so BTC 10K doesn't bother me either. Make your own choice but adoption happens during Bitcoin "Bear" markets & we've seen adoption from a few countries around the world. Zoom out & have a nice Memorial Day Weekend.

whales manipulating bitcoin to the down side being sneakywhales manipulating bitcoin to the down side being sneaky
Heres how they are doing it:
They are buying bitcoin, etheum, etc in very small increments so trades are not noticed and retail can capitalized on it by selling into spikes.
Then they keep acculating until they see retail coming in to buy when fomo comes in
As soon as the algos determine they have enough retail suckers trapped the dump all there buys all in one shot causing retail to panic sell at a loss causing prices to plummet.
Then they buy the dip and slowly accumulate and start all over again all while maintaing lower prices as they go to not allow long term holders to regain there losses. if retail tries to catch up they will eventually run out of money or sell at a loss.
Brilliant.
What to do? Dont short term long trade. Its a waste of money and time since retail dont have market manupulation money like whales have. Only thing to do is buy on dips by dca and hold until bull cycle returns in 3-4 years. And hope fed starts printing money before then to keep cycle going. Lets see what happens.

UAA, bullish retest falling wedge. Under Armor, a stock I have been watching closely.
Multi-year falling wedge breakout and retest. Volume is screaming capitulation coming into 07 high of $9.28.
RSI on the macro TF'S are oversold so I am very interested.
Trading at a lower P/E ratio than peers in the sports brand sector.
10 SMA tracking sideways indicates a sideways moving market and we are certainly at the lows of the range ($7.15-$27.5) so slowly nibbling into weakness is the way I'm playing.
Initial targets of the 10 SMA lining up with the eq of the range at $17.30.
I'm not really a big harmonic kinda guy but we have a bullish shark in play, SL-$5.97 TP1-$16.41 TP2- 26.19
