DCR/USDT Breaks 3-Year Downtrend – Macro Reversal in Motion📍 Macro Overview:
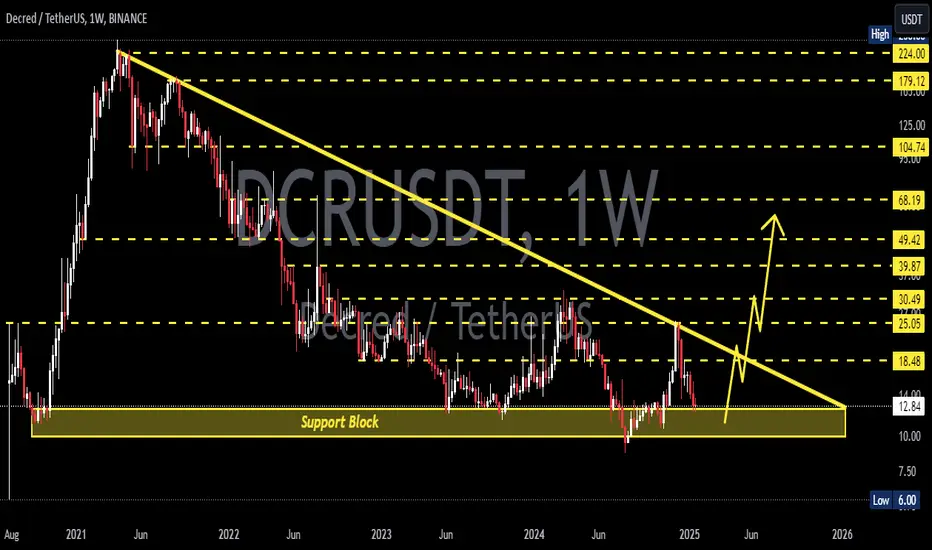
After being trapped in a multi-year downtrend since early 2021, Decred (DCR) has now shown signs of a major breakout from the long-term descending trendline. This moment could mark a pivotal shift from accumulation to expansion, offering a strong bullish macro setup.
🧠 Technical Pattern & Structure Analysis:
🔸 Dominant Pattern:
A long-standing descending triangle has formed, with a solid demand zone between $11.00 - $13.00, tested multiple times over the past 2 years.
While traditionally a bearish pattern, breaking to the upside here signals a reversal structure and the start of bullish momentum.
🔸 Breakout Confirmation:
Price has now clearly broken above the long-term downtrend line originating from the 2021 top.
This breakout implies a macro trend shift, opening the door for a series of higher highs and higher lows.
🔸 Strong Accumulation Zone:
The yellow zone ($11–$13) has proven to be a high-conviction demand area, likely indicating institutional accumulation.
✅ Bullish Scenario (High Probability):
If the breakout holds and volume confirms:
📌 Key Upside Targets:
1. $24.71 → First major resistance
2. $28.44 → Psychological level and historical S/R flip
3. $34.00 → Local top from recent past
4. $39.46 → Strong horizontal resistance
5. $67.89 → 2022 resistance and bullish confirmation level
6. $104.40 → Mid-term parabolic extension target
📈 Likely structure: Breakout → Retest → Multi-wave rally upward.
> Strategy: Ideal for Buy on Retest or Swing Long setups.
❌ Bearish Scenario (Low Probability – Risk Management):
If the breakout fails and price dips back below $13:
Expect potential pullback to $11.00 - $10.00 support
Worst-case bearish continuation could revisit $6.00 (macro support)
Would signal a false breakout and continuation of the bearish trend
> Risk Strategy: Watch the volume – weak volume could imply a fakeout.
🔍 Supporting Technical Signals:
📊 Volume: Strong volume confirmation is essential for breakout validity
📈 Indicators Supporting Bullish Bias:
Weekly RSI hovering at neutral-bullish zones
Potential for a weekly EMA crossover (golden cross)
OBV shows signs of increasing accumulation pressure
🧭 Conclusion & Strategy Insight:
This chart is signaling a high-conviction macro opportunity.
Breaking out from a 3-year downtrend is a rare technical event that has historically led to exponential moves. The key is confirmation through volume and healthy consolidation above the breakout line.
> "The longer the base, the stronger the breakout."
#DCR #Decred #AltcoinBreakout #MacroReversal #CryptoChartAnalysis #BullishSetup #CryptoTechnicalAnalysis #TrendReversal #AltcoinSeason
Dcrusdtlong

DCRUSDT 1WDCR ~ 1W Analysis
#DCR Buy gradually from here with a short -term target of at least 20%+. This is a very good support to start buying again.

DCRUSDT 1WDCR ~ 1W Analysis
#DCR In Time Frame 1W re -test this support block. Buy from here if you still have a Conviction on this coin with a minimum target of 20%+
DCRUSDT Trends Analysis: Setting Your Strategy for Success - ...◳◱ On the $DCR/ CRYPTOCAP:USDT chart, the Bband Breakout pattern suggests an upcoming trend shift. Traders might observe resistance around 18.12 | 19.17 | 21.65 and support near 15.64 | 14.21 | 11.73. Entering trades at 18.47 could be strategic, aiming for the next resistance level.
◰◲ General info :
▣ Name: Decred
▣ Rank: 284
▣ Exchanges: Binance, Kucoin, Huobipro, Gateio, Mexc, Hitbtc
▣ Category/Sector: Payments - Currencies
▣ Overview: Decred is a hybrid proof-of-work proof-of-stake (PoW/PoS) cryptocurrency with a strong focus on community input, open governance, and sustainable funding for development. It utilizes its hybrid consensus and on-chain governance systems to ensure that a small group cannot dominate the flow of transactions or make changes to Decred without the input of the community. The project funds its own development from a decentralized treasury.
◰◲ Technical Metrics :
▣ Mrkt Price: 18.47 ₮
▣ 24HVol: 5,431,632.004 ₮
▣ 24H Chng: 8.903%
▣ 7-Days Chng: 14.79%
▣ 1-Month Chng: 56.86%
▣ 3-Months Chng: 66.55%
◲◰ Pivot Points - Levels :
◥ Resistance: 18.12 | 19.17 | 21.65
◢ Support: 15.64 | 14.21 | 11.73
◱◳ Indicators recommendation :
▣ Oscillators: NEUTRAL
▣ Moving Averages: STRONG_BUY
◰◲ Technical Indicators Summary : BUY
◲◰ Sharpe Ratios :
▣ Last 30D: 4.91
▣ Last 90D: 2.88
▣ Last 1-Y: 0.52
▣ Last 3-Y: -0.13
◲◰ Volatility :
▣ Last 30D: 0.89
▣ Last 90D: 0.68
▣ Last 1-Y: 0.85
▣ Last 3-Y: 1.03
◳◰ Market Sentiment Index :
▣ News sentiment score is N/A
▣ Twitter sentiment score is N/A
▣ Reddit sentiment score is N/A
▣ In-depth DCRUSDT technical analysis on Tradingview TA page
▣ What do you think of this analysis? Share your insights and let's discuss in the comments below. Your like, follow and support would be greatly appreciated!
◲ Disclaimer
Please note that the information and publications provided are for informational purposes only and should not be construed as financial, investment, trading, or any other type of advice or recommendation. We encourage you to conduct your own research and consult with a qualified professional before making any financial decisions. The use of the information provided is solely at your own risk.
▣ Welcome to the home of charting big: TradingView
Benefit from a ton of financial analysis features, instruments and data. Have a look around, and if you do choose to go with an upgraded plan, you'll get up to $30.
Discover it here - affiliate link -
