The 2-day chart tells a different story about Bitcoin...Drama in Bitcoin land! But could it be not so bad after all? Perhaps.
Disclaimer: I am not an expert, this is not investment advice, it is just an idea. No I am not a perma bull, I actually thought at first we will crash super hard. This chart made me doubt this.
I decided to have a look at the 2-day chart to see if I would pick up some other signals there... I think I did.
If you look at the 200 EMA you see that it has actually been quite a solid support line. So perhaps, going lower than this will not happen. Also, I see a potential double bottom forming. I do think the right bottom is likely to have an inverted head and shoulders in it. We will have to see how it will go today, but if the candle of the last two days will keep its long shadow, there is a good chance it will go up for now.
Furthermore, the Stoch RSI is in the oversold area, which could also indicate that we should be seeing higher prices. It could also be forming a double bottom for itself there too.
Regarding the death cross on the 1-day chart, it does not have to be as bad as some people make it seem. The death cross is usually actually a very late indicator that we are in a downtrend - well duh! We noticed that. When looking at past examples the death cross (and goldcross as well) on other charts were often exaggerated as having a huge impact. Seeing it in the context of Bitcoin I think it might be not that significant as most expect. When going back to previous death crosses on the Bitcoin chart I found 2, but the period did not last longer than 1 month, and the second one was about 2 weeks before turning into a golden cross again. Next to that, as we all know, there were some really good reasons why the crash occurred at the time (cough Mt. Gox).
Nevertheless, whilst I like the scenario I am seeing on the 2 day chart - the shorter term movements should still be taken into consideration. This is of course all just an idea - and there still needs to be some movement before a double bottom structure is confirmed and more likely. If this scenario does play out, I do expect another downtrend starting from 11300 downwards.
What do you think? Likes, comments, feedback is welcome - still learning :).
Deathcross

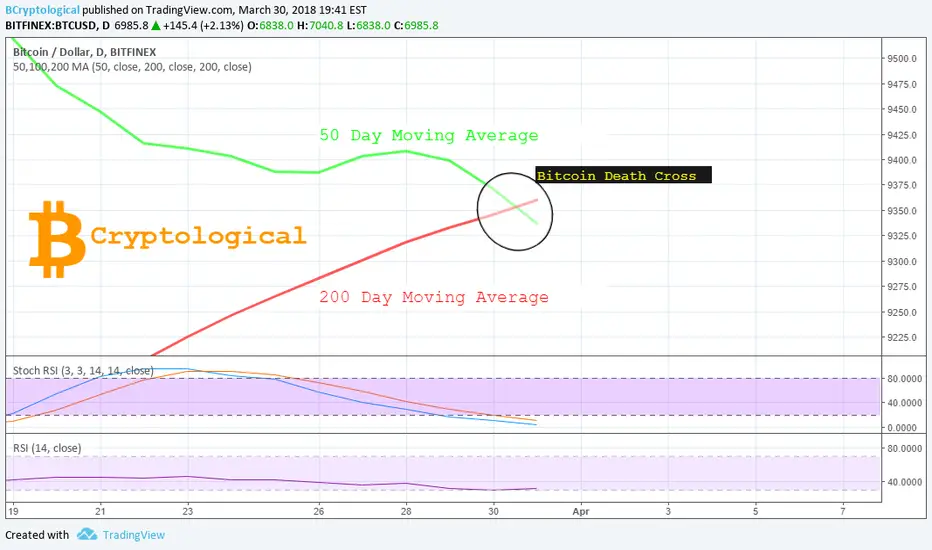
Bitcoin Death Cross ConfirmedAs I predicted yesterday, the BTCUSD 50 day Moving Average has now crossed over and below the 200 day Moving Average, creating what is known as a death cross . This is the clearest possible indicator that we are just at the start of an extended bear market for Bitcoin and on our way down to 6000USD, possibly as far as 3200USD.
Hit the thumbs up if you found this informative, I will keep you updated as the market develops! And if you disagree, please tell me why in the comments below - all feedback welcome. Thank you!!
This analysis is for educational purposes only and not a recommendation to buy or sell. Always do your own research before trading.
DEATH CROSS CONFIRMED!!! MA 50 and MA 200 Crossed again after 2 years! A bear year will come???
Lets wait and see whats gonna happen...

Incoming Bitcoin DeathcrossIt's been on the cards for the past week, but the rapid selling on BTCUSD of the past 48 hours has finally brought us within touching distance of the 50 day Moving Average falling below the value of the 200 day Moving Average... otherwise known as a death cross and one of the strongest possible indicators that we are moving into an extended bear market - making the drop to 3200USD that many predict increasingly likely. Worth noting: the higher the trading volume, the more significant a death cross is with regards to a negative outlook.
Expect the Bitcoin death cross to occur within the next 24 to 48 hours.
An alternative point of view is that the value of BTCUSD had to drop by around 75% to get the 50 day MA so close to the 200 day MA and hence the bears may have run out of steam to push it much lower. It is not unheard of for a rally to follow a death cross, so both scenarios must be considered.
If the death cross comes to pass, we can expect the 200 day Moving Average to become the new resistance at around 9350USD - which tallies with my previous article, whereby the long term support has now become the future resistance at approximately the same value. If the death cross really cannot be avoided in the coming hours, we will have double resistance to Bitcoin moving back above 9000USD in the coming month, or at least until we emerge from the bear market... hopefully to a golden cross and return to a more bullish outlook.
Please hit the thumbs up if you found this informative, I will keep you updated as the market develops! Thank you!!
This analysis is for educational purposes only and not a recommendation to buy or sell. Always do your own research before trading.

BITCOIN IS NEARING THE 2ND 'DEATH CROSS' ON THE CHARTS!This is what that means.
Bitcoin has fallen below $8,000 this month. The charts are showing something that has investors wondering if it is time to panic.
Bitcoin's chart shows price has experienced the first 'death cross' where the 50 sma crosses below the 100 sma. Now the 50 sma is approaching the 200 sma and it appears that the 50 sma may cross below the 200 sma also creating the second 'death cross'. This is used to illustrate when the 50 sma moves below the 200 sma – technicians often look at this pattern as a bearish sign of what's to come.
And in bitcoin's case, the 50 sma has already taken out the 100 sma, with the shorter-term trend line inching lower.
"When we are talking about bitcoin, I think it's important to remember that we don't have much history to go off of to identify long term trends," Jim Iuorio of TJM Institutional Services wrote to CNBC on Wednesday. "That being said, any time the 50-day crosses the 200-day, it should flash a warning…and when you couple that with the fact that bitcoin has been trending steadily lower since the launch of futures, I think that it is a major negative," he added.
But not everyone believes that a death cross marks more pain ahead for bitcoin. "Fast Money" trader Brian Kelly points out that he sees an uptrend in the chart of bitcoin that has been in play since August, and thinks that the same uptrend could actually be just as indicative of where bitcoin is headed.
"Bitcoin, just like the spot FX markets, follows technicals closely, therefore these support levels gain more importance," he wrote to CNBC. "If these levels hold, then it will confirm the uptrend from August is still valid."
The last time the death cross pattern occurred for bitcoin was in September 2015. After the death cross, bitcoin rallied close to $500 by early November that year from around $230.
Bitcoin has plunged about 38 percent year to date, but would still need to fall another 88 percent to erase all of the 2017 gains.
Quotes taken from Annie Pei article from Futures Now CNBC


Looks like a tough ride ahead for BITCOIN !! Brace yourselves!!Hello fellow crypto traders!! Let me get right into it!
Bitcoin prices has been dropping since it's all time high top. Coincidentally (or not), the all time high date was the day that CME futures started. From then, we have so far dropped from 20k down to 6k and bounced. But that bounce had retraced quite a bit and it seems that BTC is heading further down from here. The 50 days moving average is going to cross over the 200 days moving average in the next few days and that usually signals a bearish outlook for the medium term. CCI index also shows consistent strength in the selling and not looking to ease any soon. Then, we also have the large head and shoulders formation confirmation where BTC had pierced thru the neckline. We shall see if it can return back up above the neckline and save itself or simply resigned to it and the neckline becoming a resistance.
Based on an educated guess, I and seeing BTC heading towards the $1000-$2000 levels before the bear market is concluded.
This chart is only for educational purpose and all opinions are expressly my own.
Good luck!

Bitcoin Key Resistance & Support Levels And Possible Path AheadWhen the trading is choppy, it is wise to know the key levels and what could happen. Being informed and ready will help you not to panic and also make you understand what is happening in the market.
Bitcoin has lots of resistance around 20 EMA on Daily Chart. So in the coming days it will move toward that level and if rejected it will come down to the Support 1 which is 300 EMA on the daily chart. It will again move up to test the 20 EMA and it will fail and make a triple top which is a bearish reversal and it will fall to 1200 EMA.
Also monitor the RSI on daily charts as we have resistance around 47 - 50. It will also make a triple top on the daily RSI.
So here is my Prediction:
1. Moves up to 20 EMA and gets rejected
2. Support at 300 EMA
3. Move up again to 20 EMA and gets rejected. (it will also make a triple top bearish reversal pattern here)
4. Goes down to 300 EMA support and also the death cross will happen around this time.
5. Then on panic selling, it falls to 1200 EMA.
If it is able to clear the 20 EMA, then you can go long for the 50 EMA level which is around 9400 and it will be rejected there for sure as per the present market conditions. Go long only after getting enough confirmation. There could be false breakouts.
But due to the fear of an impending death cross, it is not likely that the bulls will be able to do much.
If the 300 EMA support levels are broken on the daily chart, then it will be fall to the 1200 EMA (3800 - 4000) which is the best place to stock up on Bitcoins. From the 1200 EMA fall it will move up to the mean of 300 EMA and will start the life all over again for the next Superstock Rally which will take 2-3 years :)

Eth to 331Last time Etheruem had a death cross on the 12hr Eth dropped 51%
Elliot wave predictions are showing $331.00
331.00 is 55% drop from death cross
I am expecting a bull trap bounce at the 490-510 area and then bear continuation to complete Elliot wave move.

Back at 61 Fibo with good volume - are we going to hold?I just updated the death cross projection and there may be a possibility to avoid it.
How it stands now.... it looks like we're going to cross on the 1st.
I am bullish on Bitcoin long term but this 61 mark Fibonacci level must hold so I can remain bullish.
If it goes lower than 7900, we're going deep down and if the Death Cross is complete, we might have BTC at super offer :)
Hit the like button if you feel the same and liked my idea.
Cheers

Death Cross - 30 March 2018I think that the death cross will happen somewhere on the 30th of March.
If that's the case, we might see radical price drop.
See the 50 and 20 MA dotted lines.

Scenario PlayoutYellow Line - Golden Pyramid (requires lots of volume.)
Red Line - Death-Cross
White Line - Trade Channel
Blue Line - My Prediction

Where Are We GoingIn my chart, I mapped out BTC past fluctuations to find; constant growth represented by the single blue line, growth ceiling and floor represented by the two green lines, trade pattern represented by the yellow line bouncing inside the growth area, resistance lines represented by the red, and possible future scenarios.
There are multiple scenarios that BTC could follow.
The most likely scenario to happen Is the Death-Cross. I don't see the market falling bellow 5000 in theses times.
Next in line would be the sideways trade pattern, represented by the dashed yellow line, which leads to a breakout back to a nominal BTC market.
The least likely would be the Golden Pyramid. It will require lots of volume, but the breakout would be very substantial and profitable, leading to the nominal market.
Bitcoin is highly manipulated. I do not see such volume for the Golden Pyramid coming in before April 01, which is most likely the beginning date for the death-cross.
Prices will most likely form between the first two scenarios dipping in and out of the trade channel between 9300 and 5000 until breakout.
Anything could happen for better or for worse. I am in no way a financial advisor, I am merely an observer with close to no skin in the game, so proceed at your own risk.
~NotTheTaco~

BTCUSD - We need a bounce, DC coming, 80%+ selloff - Gox?Please do not get me wrong, I am a BTC perma-bull, but in a correction, you must don your bear suit.
Gox saw an 86% sell-off, do we see the same?
And guess what, we survived Gox, we'll survive this correction too. Learn how to build a position, either way.

Death Cross Imenent Facebook has been hit pretty hard due to the data leak FUD. Users are questioning weather Facebook deserves their service after their data was leaked. Facebook has not seen this much volume since 2014, and I believe a one to two month correction is imminent. in the past, Facebook has been known to wedge in price after a correction and bounce back to all time highs. A wedge forming at its current price lever would be an ideal bullish scenario. The Facebook FUD seeming temporary also adds to this prediction. If there is no wedge, I believe a death cross is imminent. If we get the death cross, I believe a correction is imminent and Facebook will be down in price for one to two months.


BTC next 48hBTC had some unhealthy growth without normal retracment so H&S pattern is expected to play out, that would mean relative stable price during next 10 hours. Also there is death cross coming (number 1.) in next 12 hours, so I expect some bears to short there, also everybody are careful by recent pump & dumps. Number 2. fall would be caused by incoming death cross on yearly lvl, so its a kind of a big deal, so that is why I am expecting retracment to at least 7700, from there we will see! Also MACD doesn't look to promising on longer run, completion of H&S pattern would push it into bad place. RSI is overbought on daily lvls but oversold on 2 weekly, this is making things confusing as always :D, trade carefully & keep it simple

Bearish breakdown of bullflag confirmed. Stoploss triggered.As we can see the 4hr confirmation candle has now closed below the bullflag as well giving us an official confirmation of a bearish breakdown with a projected pricedrop target at the bottom of the dotted red line. That line is currently under the 4hr buy/sell line(50SMA) which means we could potentially fall back under the buy/sell on the 4 hr. I would hope not but considering we also just confirmed a bear flag breakdown on the 1 hour chart that projects the exact same price drop target I think it's a given we will hit that target and potentially see more downside after that. However by the time the price action makes it that far down the buy sell line may have potentially dipped down to that range as well...we could also have a situation where the candle that hits the drop target does so with it's wick but it's body still closes above or on the 50MA...hoping the 4hr 50MA provides the strong support we need to bounce back and I'm putting a limit buy back right above it...but I will also be placing a stop loss just a pip or 2 below the dotted red line incase we see more downside and the 50ma does not maintain support....We would have to dip all the way under the lower 7000s to give the bears back full control based on the lower low lower high principle so I definitely anticipate a big rebound before then considering how close we are to the start of Q2 of the year (which I still anticipate will be bullish). We must too consider the bigger picture unfolding on the 1 day chart....it's important to note that during this recent bull run we never made it above the 1day charts buy/sell line(50MA) not even close...but more alarming is that the 50ma and the 200 ma on the 1day chart seem like they are set to collide with eachother in the next few days but judging by the way each one is sloping it appears the 50MA might cross down below the 200MA on the 1day triggering the dreaded death cross pattern, which will mean the path of least resistance will then be to more downside...the best bet is to set smart stop losses and keep a close eye on the potential 1day chart deathcross as well as whether or not the 4hr charts 50MA will act as the strong support we need it to. If not then this is still a great opportunity to short and accumulate more btc duuring the downtrend. Of course, this is only advice I'm giving myself and nto financial advice for anyone else. Thanks for reading!

Bitcoin EUR Death Cross MA cross happenedHi everyone,
Moving Average Analysis
We see that on the daily chart, the 50 day moving average has crossed the 200 day moving average today. The day is not closed yet, but so far we see the crossing.
This is called the Death Cross, and is NOT something we see often in the history of Bitcoin. Generally facing a Death Cross, we are heading for a down trend or a push down in the market/price.
The Bulls have the last days put up a huge fight to try to avoid it I think, by closing above the 200 day MA. They were strongly rejected by resistance and we can see that the 200 day EMA is pushing it down on the 4 hour chart, keeping the market in check for what's to come.
I don't think that this is bad thing that is happening right now at all. We continue trading and adjust our trading strategy according to market and signals we are getting, and it is not at all the Death of Bitcoin. It just confirms that Bitcoin is not done correcting yet, and paving way for the 3 major impulse wave up towards EUR 40.000. It just wants to hit the proper bottom.
I have an idea already posted on the Eagle View Perspective.
Not investment advice! As a trader you are responsible for your own trades ;)
Happy Trading! May blessings follow you wherever you go.

Daily Death Cross Bitcoin BTC/USD 17th March 2018 [BTFD]We get a Death cross on the daily (finally on coinbase chart)
some other charts this has come up already!
nail in the coffin for bitcoin? (i doubt it, btc is harder than a honey badger)
the whales who didnt buy in last feb are fomoing at the bit, so i feel we wont go lower than $4k MAX but never say never with bitcoin, for sure will double bottom here and bounce very hard, so ready for this too....remember.....big money wants a cheap buy in for sure!
looking in closer timeframes we see bitcoin respecting the gann fan's, most likely drop into the purple areas towards the red and the early feb18 low
so shorting the king until those bottom fibs and then looking for a few epic longs on the swing
trading Bitcoin is simple price action folks, does not get simpler than this!
trade well cookies and BTFD (techincally speaking)!!


Big ShortI believe Bitcoin is about to take quite a dip. A double top has formed and price is now fighting it's way back up into strong supply zones which will ultimately force it lower. The 50sma is nearing the 200sma, which will soon form a Death-cross. Unfortunately there is no real demand below and I believe price will fall to around 6000.

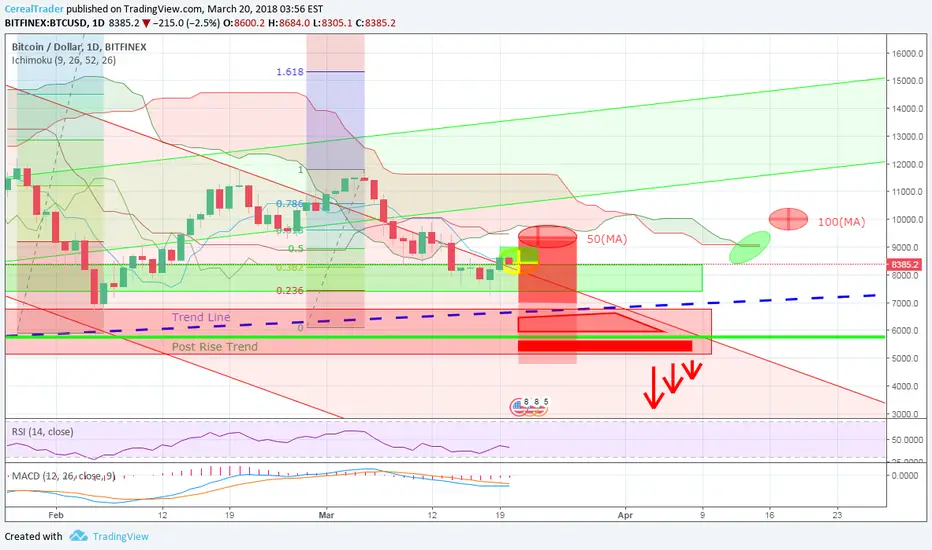
Bitcoin - Support Zones/Future DirectionSupport analysis of both, the previous parabolic move as well as the current slow decline, show areas of support aligning along with impending doom. Currently holding 0.382 Fibonacci, the area below is vulnerable up until the Trend line . At this point an expected rise from the Golden cross approaching within hours (200MA crossing below the 50MA, indicating short term trend upwards) on the 1hr chart along with the longer Weekly chart indicating doom with both the 50(MA) as well as the 100(MA) impending Death Cross (50MA crossing below the 200MA, indicating large waterfall drop, or couple days of trending downwards)
The necessity that these cross-overs must occur before uptrend can be established is nothing new although the alignment/strength of both the 50(MA) and the 100(MA) cross-over within close proximity, along the 1hr Golden Cross reversing within this time period to another Death cross, could be a triple threat add pressure to trend downwards.
Ichimoku cloud squeezing price range under $10,000 and seems it would take rally similar to last to enable support from this indicator, with volume stagnate, only rising in bursts, realistically 2 times lower then needed, this is currently not possible.
RSI currently holding 40, small room with the golden cross approaching before being oversold. Would expect large rise in RSI and price to rebound after/during cross leading along trend line .
MACD would need to see some price action to cross-over into positive rise, this could be possible if the Golden Cross plays out, could push price higher during this short few day period although the divergence appears to be slowing.
Taking a monetary view of the market, USDT trading was very slowly being replaced with real USD, volume non-existent, FUD, the only "support" channel seems to be along the trend line . this would increase pressure on this support in such a weak and reactive market and only a sharp incline in price would allow Investors back in (Investors don't buy dips, they buy on the rise).
Underlining the whole situation is trader's don't believe in the underlying technology (if anything only bitcoin -2.58% ), announcements are being held back until dust settles and constant FUD right at critical support levels. Although the technology hasn't changed from last year, the market has. It seems all indicators are at lowish levels in which a market with "legs" would jump on, but carnivorous nature of this risk built market would ensure lows are low and highs are high.
Short term trade, wait for the indicators to mature and align with others, a rise should be expected within the Golden Cross up until the Death Cross comes into play (50MA expected 23rd March), Alt coin funds will be indicator of reversal, flowing heavily into tether (USDT) and BTC at this stage. One indicator that I don't have access to is if large enough funds have a Fake-out planned...and can pull it off...and hit stop losses. A correction would still occur, long term hold your ground, the market will survive.
BTC -2.62% is seeing some tough times , so I should write this:
***Education Purposes only***