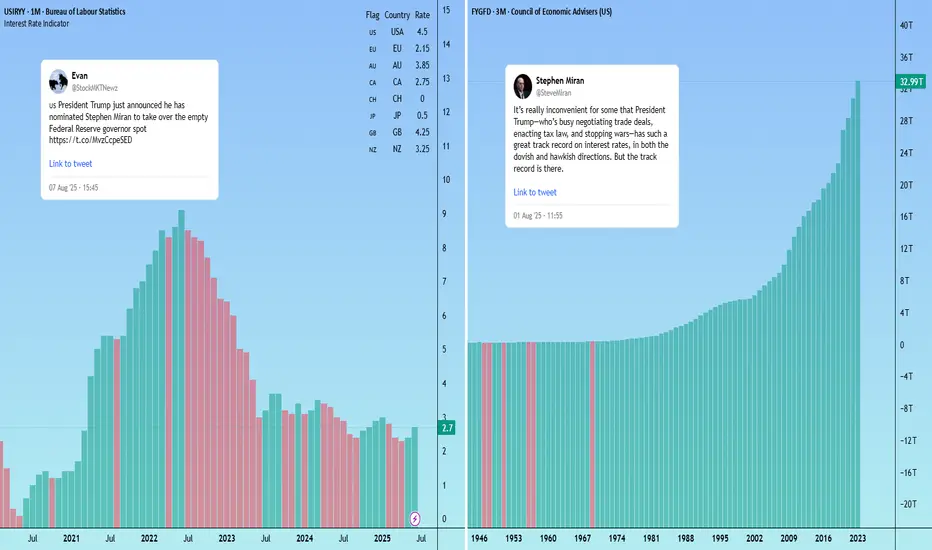
Trump’s Fed pick signals potential softer dollar US President Trump has named CEA Chair Stephen Miran as the temporary replacement for Fed Board member Adriana Kugler, serving until at least January 31, 2026.
As expected, Miran is closely aligned with Trump’s policy views, including support for tariffs and scepticism over the Federal Reserve’s independence.
Notably, Miran is a critic of the U.S. dollar’s current strength and is the author of the “Mar-A-Lago Accord” — a proposal to deliberately weaken the dollar to address the U.S. current account deficit.
The White House is also searching for a new Fed chair. If markets believe the next chair will prioritise Trump’s agenda over an independent monetary policy (a safe assumption at this stage) investors may demand higher yields on U.S. debt to hedge inflation risk. That could add volatility to US pairs.
Debt
Workforce participation is declining, government debt is risingWorkforce participation is declining, government debt is rising. Are we seeing the makings of major military conflicts?
This chart shows two key economic indicators for the U.S. from 2001 to 2025:
- U.S. labor force participation rate: the percentage of the working-age population that is either employed or actively looking for work.
- U.S. government debt as a % of GDP: the ratio of total federal debt to the country’s gross domestic product (GDP), but the scale is flipped - meaning higher debt appears lower on the graph, and vice versa.
What does “government debt as a % of GDP” mean?
This ratio shows how much the government owes relative to the size of the entire economy. If the ratio grows, it means debt is rising faster than the economy. The debt-to-GDP ratio surged sharply after the 2008 crisis and again during the COVID-19 pandemic. By 2024, it reached around 124% and is expected to keep rising. Since the chart uses an inverted scale, the red line drops lower as debt increases.
This graph clearly illustrates an inverse relationship between labor force participation and government debt as a share of GDP:
As workforce participation declines → government debt grows. This pattern is especially visible during major economic shocks like the 2008 crisis and the 2020 pandemic.
Why does this happen?
- Economic downturns: when fewer people are working or job-hunting, economic growth slows, tax revenues fall, and the government tends to borrow more to support the economy and social programs.
- Demographic shifts: as the population ages (e.g, baby boomers retiring), fewer people remain in the labor force. This slows down growth and increases the strain on government programs, which also drives up debt.
- Government policy: during times of crisis, the state often increases spending - and thus borrowing- to support the economy, pushing the debt-to-GDP ratio higher.

Tim's Fundamental View LayoutHere is the way that I view any stock for an initial analysis to get an idea of what the market is valuing and viewing the company.
I first look at the free cash flow, so that is directly under the price chart. Free cash flow is the life-blood of the company and can be used to pay dividends and to reinvest in the company to grow the top line or to buy back stock.
Next I look at the PSR or Price-To-Sales-Ratio. This ratio is paramount for me since the top line shows up first for companies and is the starting point for analysis. Companies with low or no sales growth get priced very differently from companies with high growth. Start with sales growth in your analysis. There are many great books on the topic written by Kenneth L. Fisher, the creator of the tool.
Next "Avg Basic Shares Outstanding" to see if the company is constantly diluting investors and raising capital or hiding expenses by giving out stock options each year. Old companies in slow growth industries tend to buy back stock and growth companies grow shares outstanding and is a strong headwind for investors.
Next is "Long Term Debt"... which is another extremely important variable to look at with any company. In the long run, debt is the cheapest capital since you can pay it off cheaply but it can also drag down a company when the future is uncertain and unpredictable. Companies with predictable sales and growth often load up on debt which enhances returns for equity owners, but increases the risk long term. Jet Blue NASDAQ:JBLU is case in point for this as in 2000 before the pandemic it had a $5 billion market cap with $1 billion in debt and now it has over $8 billion in debt and the market cap is down to $1.5 billion. It is very difficult to get out from under such a heavy debt load. Debt can be "death" for any company if overused.
Next is "Revenue" graphed annually. Essential to see if inflation impacts sales growth or if it can't keep up with inflation. The last 5 years was between 20%-50% inflation depending on the industry so if a company doesn't have higher revenues by at least 20% since 2019, then this reveals a weakness in their pricing power which is a very competitive market with likely declining or low margins.
Last is "Market Cap". It is always good to know the market capitalization of any stock that you own. It is the foundation for understanding if any investor would ever want to buy the whole company and what would it cost to buy it and what are the "returns" from owning the whole company.
I hope you can copy this layout for your own so you too can have a one-page view of the history of a company to help you get your mind around its valuation and potential along with understanding the risks all in one, easy picture.

A Broader Market Review...As we have all seen within the last month or so, the U.S. equity markets have been getting the worst ass whooping since 2020. And as much as we'd like to forget that absolute disaster, it does bring to thought the idea of buying general market funds (such as AMEX:SPY , NASDAQ:QQQ , or AMEX:DIA ) to gain a nice entry into the next bull market, whenever that may be. However, not everything is all smooth sailing. The unfortunate part of this market downturn is that no amount of technical astrology fortune-telling analysis could have predicted the market's reaction to the tariffs being levied on foreign nations. So we need to put our big-boy pants on and look at the market as if it isn't some automatic wealth generating pattern that points north-east all day long.
Let's start with the tariffs. Firstly, we know there has been a 90 day pause on all conforming countries most notably leaving out China. It's not like that's anything special, just almost all our crap is made there. Unfortunately, we are observing what may be the greatest economic error of our lifetimes.
For those who are lost, foreign governments DO NOT pay for the tariffs in the way we are told. The U.S. Government levies the tariffs on the exporter (Chinese companies in this case), who then pass it on to the buyer of the goods (think Walmart, Target, Apple, etc.), who then pass those charges onto YOU... Enjoy!
So with an attempt at a full blown trade war, which the U.S. cannot win nor even has the industrial strength or infrastructure to compete, we can expect the markets to completely do a Bald Eagle courtship nosedive into new lows as observed a few weeks ago. But what will the Creature from Jekyll Island think of this?
Well miraculously, Fed chairman Jerome Powell claimed that the Fed will NOT allow the tariffs to exacerbate inflation into new highs. Get that, the Federal Reserve will not allow economic movements that raise prices on an importing nation ( that's the United States by the way), to raise prices anymore. While he's at it, how about we just get no inflation ever since it's just that simple?
And as if that wasn't enough, Donald Trump called for Jerome Powell to lower rates for some reason, saying that Powell was too late on his economic movement at the Fed. As it turns out, our plan for strengthening the economy is to.... weaken the dollar? Not sure why that's the case but at least we will be able to borrow more money at a cheaper price, as if the United States doesn't already have a debt problem. The Fed lowering rates would of course open the possibility of getting yet another wave of quantitative easing which will most likely be observed further down the road. Another round of QE, along with rate cuts, will of course send the equity markets to new highs on top of a weaker dollar.
Speaking of a weaker dollar, we should lastly talk about the TVC:DXY which measures the comparative strength of the U.S. Dollar to other currencies. As it turns out in this scenario, the dollar is getting weaker and weaker every day, meaning that people are running from U.S. Debt like it's the plague. If we were going to get a weaker dollar, at least could we have a higher market to offset our inevitable losses? I guess not...
Here is the TVC:DXY 1D looking back into late 2024.
Lastly for what to expect out of the market. If the trade situation will all the tariffs and this neo-cold war cool down, we might see some tariff pauses or lowering which will of course fire the market into new highs. However, if the situation doesn't cool, our debt yields rise, the market is going to go south faster than a Canadian in December. On a positive note, macroeconomic events move slowly, so it should be clear when a turnaround is coming...

Gold Skyrockets Like It's 2011: Are We There Yet?Gold has been on a powerful run since breaking above the 2100 resistance level in March 2024. After just one year of relentless gains and a return of over 60%, it has become one of the top-performing assets. But the big question now is: how far can this rally go? To the moon?
It's difficult to predict how far prices can climb during these kinds of parabolic moves. In 2011, the final green monthly bar alone rose 17% from open to high. These FOMO-fueled surges often lead to euphoric tops followed by painful bear markets. So, are we there yet?
Since Richard Nixon ended the dollar's gold backing and introduced the modern fiat system, gold's status as a safe haven has become even more prominent. Whenever there are heightened risks, whether geopolitical, fiscal, or related to the fiat money system, investors tend to flock to gold. The 2011 rally was a clear example of this. After the 2008 financial crisis and the quantitative easing that followed, gold became the go-to asset for both preserving value and speculative opportunity.
A similar pattern has unfolded following the COVID-19 shock. The Federal Reserve returned to aggressive quantitative easing, while both the Trump and Biden administrations increased fiscal spending, including direct payments to households. This surge in money supply and concerns about fiat stability, along with rising government debt, helped trigger another major gold rally. With the added risk of a trade war, the rally has accelerated further, pushing gold beyond 3300 and creating a situation that closely mirrors 2011.
Looking at the money supply-to-gold ratio and the US federal debt-to-gold ratio, gold now appears to be testing trendline levels. Its recent surge has made metrics like M2 and federal debt seem relatively smaller, which may be a sign that the rally is approaching exhaustion.
Still, history shows that final euphoric moves can stretch even higher before a true top is formed. Rather than trying to predict the peak, it's often better to wait for signs of price stabilization. Gold typically offers a second opportunity, often forming two peaks with the second lower than the first, before entering a bear phase.
In 1980, gold fell more than 60% within two years. After the 2011 top, it declined nearly 40%. Even if the retreat expected to be milder this time, gold could still offer a 20% or greater downside opportunity once the top is in.
Smart money has already started to take profits gradually. Net managed money positions in the COT report have decreased by 40% since January, as we discussed in our earlier post:

Repaying the Italian debt in 40 years. The method.
Hello, I am Trader Andrea Russo and today I want to talk to you about an ambitious, innovative and potentially revolutionary idea for the management of the Italian public debt. A strategy that, in theory, could heal the enormous accumulated debt and bring Italy to a stronger and more stable financial position. Let's find out together how it could work.
The basic idea
Italy, with a public debt that amounts to about 2,900 billion euros, pays 70 billion euros in interest annually to its creditors. However, imagine an alternative scenario in which those 70 billion, instead of being paid for the payment of interest, are invested in index funds with an estimated average annual return of 10%. Furthermore, the profits generated would be reinvested annually. It is a solution that is based on the power of compound interest.
From the second year, Italy would also have the 70 billion euros available annually no longer tied to the payment of interest. These funds could be used in strategic ways to support economic recovery.
Agreements with creditors
To make this proposal feasible, Italy would have to negotiate an agreement with creditors. The agreement would include a temporary suspension of interest payments, with the promise that the State will repay the entire debt within 40 years, also guaranteeing a compensatory interest of 10% as a "disturbance".
This implies that creditors must accept a long-term vision, trusting in the profitability of investments and the ability of the Italian State to honor the final commitment.
Simulation: how it could work
If the 70 billion were invested from the first year in index funds with an average annual return of 10%, the capital would grow exponentially thanks to compound interest. Over 40 years, the investment would accumulate over 3,241 billion euros, a sum sufficient to repay the public debt of 2,900 billion and to provide a surplus to satisfy the extra interest promised to creditors.
Meanwhile, from the second year, Italy would have at its disposal the 70 billion annually previously earmarked for interest payments. Over 40 years, this figure would represent a total of 2,800 billion euros, which could be used to:
Strengthen strategic infrastructure in the transport, energy and digital sectors.
Reduce the tax burden and encourage economic growth.
Improve social services, such as healthcare, welfare and education.
Further reduce the residual debt, strengthening the country's financial stability.
Conclusion
With this strategy, Italy would not only repay its public debt, but would also start an unprecedented phase of economic recovery. The combination of compound interest and the reallocation of freed funds represents an innovative vision to solve one of the main economic challenges of our time.
However, the implementation of such an ambitious plan would require financial discipline, political stability and careful management of investments. Furthermore, it would be essential to negotiate a transparent and advantageous agreement with creditors, ensuring trust and credibility in international markets.
Whether this is a utopia or a real opportunity will depend on the ability to imagine and adopt bold solutions for the good of the country.

Is iRobot's Bankruptcy the End or a New Start?iRobot, the renowned maker of the Roomba robotic vacuum cleaners, now finds itself in a precarious financial situation marked by significant debt and dwindling liquidity. Once a symbol of innovation, the company has been battling mounting losses and a challenging cash crunch, raising serious concerns about its ability to continue as a going concern.
The collapse of a high-profile acquisition deal with Amazon—derailed by European antitrust authorities—has compounded iRobot’s woes. The termination of this deal led to a dramatic plunge in share value and market capitalization and intensified investor skepticism, leaving the company with a heavier debt load and forcing it to consider strategic alternatives such as refinancing or selling assets.
Facing regulatory pressures, shifting market dynamics, and the human cost of necessary layoffs, iRobot’s future now hangs in the balance. This unfolding crisis invites investors and industry observers to reflect deeply on broader questions: Could a strategic overhaul pave the way for recovery, or does this signal the end of an era for the iconic brand?

U.S. FIRMS SWAP DOLLARS FOR EURO to lower funding costsU.S. FIRMS SWAP DOLLARS FOR EURO to lower funding costs—SMART MOVE?
(1/9)
Good afternoon, Tradingview! U.S. companies are flipping dollar debt into euros—slashing borrowing costs 📈🔥. Cross-currency swaps are the hot ticket amid rate gaps. Let’s break it down! 🚀
(2/9) – SWAP SURGE
• Trend: Dollar bonds morph into euros 💥
• Why: Eurozone rates lag U.S. by ~200 points 📊
• Volume: $266B in Jan ‘25 swaps, up 7% YoY
Lower rates, big savings—companies pounce!
(3/9) – THE TRIGGER
• Fed: Holds steady—U.S. rates stay high 🌍
• ECB: Eases up—eurozone softens 🚗
• Trump Tariffs: Stir inflation fears—volatility spikes 🌟
Dollar strength pushes firms to euro deals!
(4/9) – HOW IT WORKS
• Swap: Trade dollar debt for euro payments 📈
• Gain: Cheaper interest, currency hedge
• Impact: Millions saved, euro cash flows shine
It’s a financial jujitsu move—clever stuff! 🌍
(5/9) – RISKS IN PLAY
• Euro Flip: Stronger euro could zap savings ⚠️
• FX Losses: Hedging costs climb if dollar dips 🏛️
• Uncertainty: Fed vs. ECB—rate dance wobbles 📉
Smart bet, but not risk-free!
(6/9) – WHY NOW?
• Rate Gap: U.S. high, eurozone low—carry’s juicy 🌟
• Trump Effect: Tariffs fuel dollar power 🔍
• Global Ops: U.S. firms shield Europe earnings 🚦
Timing’s ripe—swaps are the shield!
(7/9) – MARKET VIBE
• Early ‘25: Swap restructures cash in 🌍
• Savings: redirected to debt, flexibility 📈
• Trend Watch: Grows if rate split holds
Companies adapt—financial acrobatics in action!
(8/9) – Dollar-to-euro swaps—what’s your take?
1️⃣ Bullish—Cost cuts win big.
2️⃣ Neutral—Works now, risks later.
3️⃣ Bearish—Euro rebound kills it.
Vote below! 🗳️👇
(9/9) – FINAL TAKEAWAY
U.S. firms swap dollars for euros—saving millions as rates diverge 🌍🪙. Tariffs and Fed fuel the play, but euro risks lurk. Genius or gamble?

US FEDERAL WORKERS and COMING DECLINEThe chart Posted is that of Government worker Has PEAKED ! As you can see under Elliot Wave We have reached the point That Governments thru out the United States has FIVE LEGS up ! and to which the jobs created over the last fours has been where most jobs have been. It is my view that this has come to an end ! and that we are going to see a true sea change . Timing is for a decline to start NOW !This should also slow down the rate of Debt and inflationary forces ! . I stand by my work and the data the US Unemployment levels have bottomed and a upturn that started last year will see it increase to a level in the mid 5 to 5.5 % .and that the recession started last year mid summer early spring . If cycles based on the data we should see the peak in unemployment in Oct 2026 and the low in the Liquidity cycle and recession low . Best of trades WAVETIMER

FEDERAL DEBT priced in the DOW JONES is too HIGH!Those dollars that the US government owes must be inflated away!
As paying back 33 Trillion dollars is not feasible in today's version of dollars.
So they must be paid in even more worthless dollar currency units.
If the US government stops spending they will send the US economy into a recession.
They must continue to pump money into the economy and the stock market.
The con job that inflation is under control is a lie.. and we will continue to see higher prices the rest of the decade albeit at a slower rate.
BUT even 2% annual inflation compounded will erode purchasing power quickly as we have seen in the past. And I have charted before.
I believe we will continue to see the stock market ramp up the next two quarters before taking a summer break.
The underlying hidden to most, inflation trend, will continue to inflate revenues and earnings for most stocks going forward.
The bottom line is that Inflation is a FRAUD perpetuated on the people by the Government.
They print and spend the money first, and then the workers get it after beingTAXED and after prices have gone up.
Then they TAX you on the gain in asset prices! :)
So if u can invest in assets that are in wrapped up Tax free vehicles --- seek those out.
#Crypto can be a way to supercharge your returns for periods of time,
but come with inherent, built in volatility ---
most people walk away with, what could have been stories -- rather than life changing returns

Tesla Valuation back to 2010 IPO$TSLA has had wild swings in valuation from under 2 times sales and over 20 times sales in the past few years. Granted, you have to know the future to know what the sales are, but in 2019 it was insanely cheap just as the Model Y was just starting to sell. The MODEL Y is why Tesla has done so well in my opinion. It has dominated and is still growing insanely fast and taking out the competition. The car is amazing. From the first moment I drove it using Turo out in the snow in Montana in 2020 I knew it was a world-car and it was in the largest segment which is Crossover SUV. After the Model Y started dominating, the valuation of Tesla then got up to over 20 times sales, which is beyond insane.
Markets provide you with opportunities to buy when things are cheap, but there are uncertainties. Then the market provides you with opportunities to sell when things are expensive, but the momentum and price gains are so strong that it is tempting to hold on. The best thing you can do is learn how to act in both situations. Also, it is OK to watch a stock go higher AFTER you sell. Let go of the need to think you are the smartest person in the market. The person buying from you deserves the right "to be right" for awhile too.
So where does $TSLA stand now? In the middle between expensive and cheap. If Tesla goes lower, it gets cheaper and as sales growth continues it will drive the PSR down near 5-4 within 12 months. Will Tesla see 2 times sales again? I doubt it because at 2 times sales before it had a lot of debt ($10B and there were survival concerns at that time along with a VERY LOW investment grade rating in the junk-status category.) Now the opposite is true. Tesla has billions in cash and enough capital to buy back stock and still meet their capital spending for many years.
To step back and view the situation from a rational perspective, you have to look at the extremely high valuation that Tesla reached in the bubble of 2020-2021-2022. Step back and look at the long term valuation and trends.
Stay tuned.
Tim
9:20AM-9:37AM Thursday, November 10, 2022
184.24 last $TSLA

AXP, THE PLATINUM CARD ISN'T ACTUALLY PLATINUMTrends and price targets marked.
Things are overextended
Potential to bounce back and catch more upside even with the overextension.
Guideline is more for backtracking, but it could potentially look something like this.
Follow trends and price targets rather than guideline, it is more to get an idea of what things could look like.
247 or so looks like a top to me especially with the trend formation
I would suggest watching a break on the lowest green support trend
and I would also suggest watching a rejection on the rejection trend.
Should we break out of rejection trend, probably 360.
Drop will be steep, but the most natural path would be the 247 drop to 80.
I would say, if you're looking to enter, wait and be patient. If there is more upside, you're not missing much. If downside is coming, there are still trend support lines that can see bounces in price, meaning, you'll likely be able to find a better entry that allows for less risk.

5 ways to win with Gold and Silver in 2024Potential Narratives:
1. The Fed truly pauses and starts to ease, creating easier money conditions, money printing
2. Election year may be bullish for assets, metals have lagged
3. De-dollarizing theme globally is favorable for metals
4. More global conflicts potentially could cause more US debt, which favors metals
5. Weakness in the economy can cause metals to outperform even on the downside
We love our stories and narratives. Emotionally it helps us understand the "why" something is happening. Metals have underperformed stocks, bonds, and real estate for years now. It wouldn't take but a few breakouts to get a trend started in metals. Gold is already at all time highs. Silver has more work to do. With more debt on the horizon and the world unhappy with each other, the case for precious metals as a store of value makes more and more sense.
In the past, bullish runs in metals lasted for 8-14 years. If we say the current trend is a bull run, and we say it started in 2020, then we still have many years to see the cycle play out. maybe til at least 2028?
Please feel free to add your comments and opinions below. cheers!

Bearish movementEnglish
Right now, we are having very bad news for the crypto market, special with the Binance issue with the US regulators and Binance`s CEO had to abandon his position, it looks like agood moment to get the open liquidity which was open after those big bullish movements. There`s a debt in the 78% fibo extension which I believe is going to be taken after some days or weeks around the price 32$ per Solana and after that, we are going to have an amazing bullish movement.
However, we need to be careful because in any moment we could hear any news about the Bitcoin ETF which is going to make the market very very bullish, so... Be careful with the next movements in the price and the news.
*THIS IT NOT INVESTMENT RECOMMENDATION OR SOMETHING LIKE THAT, THIS IS ONLY FOR ANALYSIS AND EDUCATION PURPOSE*
Español
En este momento, estamos con pèsimas noticias en el mercado cripto, en especial con ese tema de Binance contra los reguladores de EU,los cuales provocaron que el CEO de Binance renunciara el día de hoy, y parece un buen momento para tomr la liquidez abierta que quedo cuando comenzó ese pequeño bull run. Hay una deuda en el 78% de la extensión del Fibo cercano al precio de los 32$ por Solana, el cual considero debería ir a tomar en los próximos días o semanas, después de eso, espero movimientos súper fuertes al alza.
Sin embargo, necesitamos ser cautelosos porque en cualquier momento podríamos recibir noticias sobre el ETF de Bitcoin y eso podría generar subidas astronómicas en el mercado.
*ESTO NO ES RECOMENDACIÓN DE INVERSIÓN NI NADA QUE SE LE PAREZCA, ESTO ES SOLO PARA ANÁLISIS Y EDUCACIÓN*

Possible XAUUSD movementEnglish
I´m going to make an analysis on a monthly timeframe looking for our market structure, we have all the HH and HL with at least 50% of our fibo retrament.
We take a look at the fibo retracement to see where could I take profits when the price breaks the last H and we found two interesting zones (-10% and -27%),
that is a rare way to use the fibo retracement, but it really works.
Then, I checked if the price let any debt to look after it and I found one in the 100% price of our fibo extension, the price is going to be there (close to the price 1406)
in some time (weeks, years or even decades), when? We have to take a look at it then. In that price we could star buying.
On a weekly time frame there is a kind of bearish structure, not too clear, but on a daily and 4hrs time frame look better, it is making LL and LH and
if nothing happen in the conflict in the middle east, could look for prices right down.
*THIS IT NOT INVESTMENT RECOMMENDATION OR SOMETHING LIKE THAT, THIS IS ONLY FOR ANALYSIS AND EDUCATION PURPOSE*
Español
Voy a analizar el mercado en temporalidad mensual para identificar nuestra estructura de mercado, tenemos altos más altos y bajos más altos con al menos un 50% de
retroceso de Fibonacci.
Echamos un vistazo a nuestro retroceso de Fibonacci para identificar donde podríamos tomar profits cuando el precio rompa ese último máximo y encontramos dos zonas interesantes
(-10% y -27%), esa es una rara manera de usar el retroceso de Fibonacci, pero realmente funciona.
Luego, verifiqué si el precio dejo alguna deuda para tener en cuenta y encontré una en el 100% del precio en la extensión del fibonacci, el precio llegará allí (cerca del precio 1406)
in algún momento, (semanas, años o incluso decadas), ¿cuándo? Tenemos que ver con el tiempo, pero en ese precio podemos comenzar a comprar.
En temporalidad semanal hay un tipo de estructura bajista, no tan clara, pero en diario y 4Hrs se ve mucho mejor, está dando bajs más bajos y altos más bajos y si nada
sucede en el conflicto en medio oriente, podríamos buscar precios abajo.
*ESTO NO ES RECOMENDACIÓN DE INVERSIÓN NI NADA QUE SE LE PAREZCA, ESTO ES SOLO PARA ANÁLISIS Y EDUCACIÓN*

Delinquency Rates on Credit Card Loans Not seen since June 2012Credit Card Defaults Last rose 1994, 2006, slowly in 2016 and now a rapid incline of delinquency rate of 2.77%. I do foresee this trend to continue to the upside. The momentum of higher rates has contributed to the pressures. The rise may not be linear but the upside certainty appears to reach 3.25-3.5%. We'll keep monitoring

Possible movement US30English
First of all, I looked at the market structure, we have a pretty clear bullish structure, the first HH and HL were OK in its structure without any debt.
Then, looking at the next HH and HL, we noticed that the price didn`t cover at least the 50% of our Fibo, so we still have a nice zone to keep an eye on it
for future bullish movements.
I used the fibo expansion to see if we have any debt in the first movement from the last HL and I noticed a debt in the 78% of it, a nice zone for a
possible bullish movement in the future after a financial crash or something really strong like a recesion. All of this on a daily time frame.
Looking at the other structure from the last HL, I noticed a bearish structure, but in the last days the price broke the last H, so we could expect for possible
higher prices, but it would be good for the price to have a retracement before to do it and possible, give us another HH and HL.
We have to be carefull because we now are on a zone where the markets doesn`t give us HH or LL or anything like that, we need to wait for the price to break
that structure for further movements.
*THIS IT NOT INVESTMENT RECOMMENDATION OR SOMETHING LIKE THAT, THIS IS ONLY FOR ANALYSIS AND EDUCATION PURPOSE*
Español
Primero que todo, mirè la estructura de mercado, tenemos una estructura alcista muy clara, en el primer alto màs alto y bajo más alto su estructura notiene ninguna deuda.
Luego, mirando el próximo altomás alto y bao más alto, notamos que el precio o fue hasta el 50% del Fibo, por lo que tenemos una zona interesante a ver en el futuro para futuros movimientos al alza.
Usé la expansión de Fibo para ver si tenemos alguna deuda en su primer movimiento desde su último bajo más alto y noté una deuda en el 78% del mismo, una buena zona para posibles futuras compras,
esperando una futura recesión o algún crash financiero. Todo esto en temporalidad diaria.
Mirando la esturctura desde el último bajo más alto, notamos una estructura bajista, pero en los últimos días el precio rompió el último alto, por lo que podemos esperar precios más altos,
pero sería bueno para el precio tener un retroces antes de hacerlo y posteriormente darnos otro alto más alto y bajo más alto.
Tenemos que ser cuidadosos porque ahora estamos en una zona donde el mercado no me ha dado ni altos más altos o bajos más bajos, tenemos que esperar a que el precio rompa su estructura para ver futuros movimientos.
*ESTO NO ES RECOMENDACIÓN DE INVERSIÓN NI NADA QUE SE LE PAREZCA, ESTO ES SOLO PARA ANÁLISIS Y EDUCACIÓN*

Possible GBPUSD movementsEnglish
First of all, I looked at the market structure, we have a very clear bearish structure since the 70´s and I looked at the last fractal to see the possible movements and debts the price may cover in his path.
I saw the last movements during (The LL and LH) that last bearish movement that the price didn´t get at least the 50% Fibo´s, it happened with the two bearish movements.
I took a look as well at the possible debts and I used the Fibo extension and noticed a debt in the level 1 (100), so we still have a zone to cover right down (A possible LL).
So, we have two possible movements and two debts that we need to pay attention, one in the 1.86648 price to look for bearish movement and another one waiting for the price to go down and get the debt in the 1 (100) zone of our Fibo extension in the price 0.95397.
Let´s see what the market does to "refresh" my analysis.
*THIS IT NOT INVEStMENT RECOMMENDATION OR SOMETHING LIKE THAT, THIS IS ONLY FOR ANALYSIS AND EDUCATION PURPOSE*
Español
Primero que todo, miramos la estructura de mercado, tenemos una estructura claramente bajista desde los 70s y me enfoqué en su último fractal bajista para identificar posibles movimientos y deudas del precio en su camino.
Vi los últimos movimientos (alto más bajo y bajos más bajos) en su último movimiento a la baja e identifiqué que el precio no cubrió en ninguno de sus retrocesos al menos el 50% del Fibo, por lo que tenemos vacios donde el precio tiene que subir en algún momento.
También vi lo que serían posibles deudas en la zona baja e identifiué una deuda en la zona del 1 (100), justo por debajo del último precio a la baja, por lo que tenemos un posible bajo más bajo que cubrir.
Por lo tanto, tenemos dos posibles movimientos y dos deudas a las que debemos prestarle atención, uno en el precio 1.86648 para buscar posibles ventas y otra esperando un nuevo movimiento a la baja hasta el precio 0.95397 buscando posibles compras.
Ya veremos qué hace el mercado para actualizar nuestro análisis.
*ESTO NO ES RECOMENDACIÓN DE INVERSIÓN NI NADA QUE SE LE PAREZCA, ESTO ES SOLO PARA ANÁLISIS Y EDUCACIÓN*

Bonds are compelling as collateralEver since 2008, the world shifted more to the world of collateral and distrust, after the world of unsecured collapsed.
Treasuries are dollars are in the future. As long as uncertainty remains high (or increases) there will be a place for government loans. Treasuries yielding near 5% on most maturities is "good enough" when compared to the historical 7% ish from equities.
Technically speaking, treasuries may be forming a short term bottom.
Tactically speaking, the gap between treasuries and stocks is very wide.
Fundamentally speaking, there may not be enough reward to justify most large cap equities current yield when compared to the healthy yield in treasuries.
Risk speaking, the biggest risk in holding treasuries is the loss in opportunity and the risk of more dollar devaluation/consumer inflation loss of purchasing power.
In summary, Treasuries are worth a shot and they are likely de-risked at current levels.
I will be considering bullish option spreads.

US Govt Real Debt is Down Last 3 YearsThe "real value of the US Gov't Debt" is a different way of looking at our situation through rose-colored glasses, but it is a fair analysis.
If we "adjust the debt level for inflation" as measured by the CPI Index (All Urban Consumers Index) from the beginning of the series back in 1966, you will have a line that is grinding SIDEWAYS since October 2020 at a reading of $105.9 Billion. The latest number was the July reading at $105.1 Billion which is a slight decline.
All of this sounds like "hocus-pocus" but it is a fact that inflation makes it easier for the Gov't to pay off its debt in the new "cheaper valued" dollars. The dollar is the same, only there are far more of them floating around in the system so each of them is worth less.
If we analyze how the US debt has increased relative to other countries' debt, we could also see how we are doing. The financial market's are open for analysts to find discrepancies between the value of various currencies and over time, the market adjusts for the amount of currency being created in an economy.
We can look at the TVC:DXY or US Dollar Index to see how the US economy has fared versus its trading partners. The Dollar Index is weighted for the amount of trading between the various currencies.
I can follow up on that analysis in the next chart.
For now, we can at least see an optimistic chart about the actual "REAL" amount of debt that the US Gov't (which is US, the taxpayers) has over the last 3 years. Covid spending and lockdown payments to keep the economy afloat certainly launched us up into the stratosphere FIRST but since 2020 that debt has been in a sideways pattern.

🟩 Margin Debt with brokers points upWhen we look at the first chart the Margin Debt with brokers (aka how much the brokers are deploying margin) - we see a positive relationship with the times when brokers are on margin (aka buying a lot) and the market going up.
When we analyse the Rate of Change of this stat for the last 15months we can see that currently we are getting to a state of bearishness close to the 2008 and 2002 periods. This of course is a contrarian indicator and could point to a move higher.
This is a long term assessment, but it is a good point to include in your analysis.
However remember we NEVER have confirmed of the NET NEW HIGHS - hence this market has still not confirmed Bull Status, at best we have Bull-transition. So be very cautious of the market.

Unleashing the Potential of Defensive Market Sectors for a 10x RIn these unpredictable times, it is crucial to strategize and safeguard our investments against market volatility. While some may shy away from uncertainty, smart traders like yourself recognize the immense opportunities that lie within. By focusing on defensive market sectors, we can position ourselves for success, even in the face of adversity.
So, what are these hidden gems, you ask? Let me enlighten you! Our thorough analysis and expert insights have highlighted three subdued ETF sectors that hold tremendous potential for exponential growth. By going long on these stocks, you can seize the opportunity to maximize your returns and secure a bright future for your portfolio.

Global debt hits record $307 trillion, debt ratios climb -IIFGlobal debt reached a record high of $307 trillion in the second quarter, despite higher interest rates limiting bank lending. The United States and Japan were the main drivers of this increase, according to the Institute of International Finance (IIF). The IIF's report revealed that global debt in dollar terms rose by $10 trillion in the first half of 2023 and by $100 trillion over the past decade.
This surge in debt has pushed the global debt-to-GDP ratio to 336% for the second consecutive quarter. The report attributes this rise to a slowdown in economic growth and price increases, resulting in nominal GDP expanding at a slower pace than debt levels. Emre Tiftik, Director of Sustainability Research at the IIF, noted that the debt-to-GDP ratio is once again increasing after declining for seven consecutive quarters, mostly due to easing inflationary pressures. The IIF expects the debt-to-output ratio to surpass 337% by the end of the year, as wage and price pressures continue to moderate.
Experts and policymakers have been warning about the growing levels of debt, which can lead countries, corporations, and households to tighten their belts and reduce spending and investments, ultimately impacting economic growth and living standards.
More than 80% of the recent increase in debt came from developed countries, with the United States, Japan, Britain, and France experiencing the largest increases. Among emerging markets, China, India, and Brazil saw the highest rises in debt. This is a notable shift, as emerging markets are exhibiting a better trend compared to developed markets for the first time in a while, according to Todd Martinez, co-head of the Americas sovereign team at Fitch Ratings.
The report also highlighted that household debt-to-GDP in emerging markets is still higher than pre-COVID-19 levels, primarily driven by China, Korea, and Thailand. However, mature markets have seen the lowest household debt-to-GDP ratio in two decades during the first half of this year. Tiftik mentioned that consumer debt burdens appear manageable, and if inflationary pressures persist, the health of household balance sheets, particularly in the United States, will provide some protection against further interest rate hikes by the Federal Reserve.
While markets currently do not anticipate a near-term rate hike by the U.S. Federal Reserve, the target rate is expected to remain between 5.25% and 5.5% until at least May of next year. This sustained high rate in the U.S. could put pressure on emerging markets as investors prioritize the less risky developed world for investment.
