DCL Blogger - your source of all Decentraland knowledge :)Firstly - none of the information posted by me should be treated as financial advice - it can only be taken as an observation of an individual who tries to understand market mechanics for a good few years now. On a daily basis, I work in the engineering sector which requires a high level of specialization - trading is not my primary, but only an additional source of income. I'm a swing trader who does not use leverage - I only follow trends with significant amounts of support. It is no mystery that I trade rarely, limiting my exposure and risk... it is my way, it works for ME. Every trader has a different approach, beliefs, strategies, habits and other characteristics, so don't ever believe anyone that tells you, that they're way is better than your own - they're lying.
How it should be approached (my opinion) :
IMPORTANT: If you look at other trader's analysis for confirmation of your view - you are already doing it wrong. You should only look at others in order to educate yourself - remember to always take your own conclusions instead of blindly following others. At the end of the day - it's your money...
Now down to business :
Every analysis should always start from looking at the bigger picture - Long time frame charts, so this is what I'm going to look at first. Since 17 of june 2019 we are in consolidation. According to Investopedia :
Consolidation is a technical analysis term referring to security prices oscillating within a corridor and is generally interpreted as market indecisiveness. Said another way, consolidation is used in technical analysis to describe the movement of a stock's price within a well-defined pattern of trading levels. Consolidation is generally regarded as a period of indecision, which ends when the price of the asset moves above or below the prices in the trading pattern.
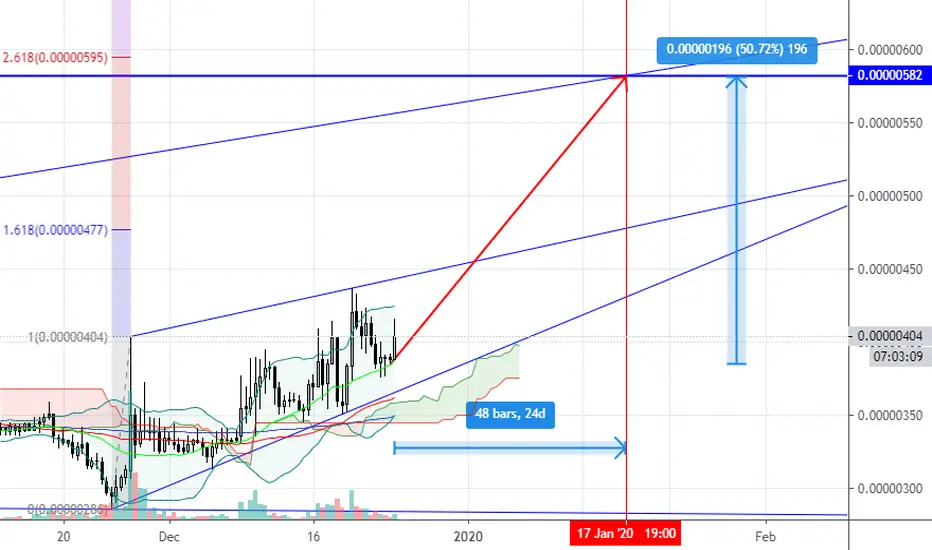
Let's start with the risk: We are currently at the highest price point since September 2019. That's definitely a good place to sell - if MANA was bought any time between now and then.
We cannot say yet if we are going much higher since price oscillates around 500 satoshis - previous highs wasn't broken yet. What we need to see in order to increase our assumption of the probability of a significant upward move is a daily candle to break and close above these levels - and that's not all. I never go into a trade if there is no confirmation of a breakout. What I mean by confirmation in this case: If let's say (today) daily candle (or any other day) closes around 580 satoshis and next day or a few days later drops back down to around 500 sats, while closing above this level (as you can see confirmation sometimes takes few days in my style of trading) I would consider this trade as one with pretty high probability of profit and would go in with appropriate position size in order to limit my risk and exposure. This way I can sleep at night :) and maintain a profitable trading account.
Another important aspect of trading is appropriate placement of a stop loss. Showman says they cut losses short and let winners win BIG. The truth is that tight stop losses often eliminate you from a game - in here all is about patience and discipline.
Some people would laugh if I would say my SL would be around 350 sats area, but the reality is that also I see here possible ascending triangle (in red) formation where suggested entry would be close enough to my stop loss anyways (as of today and if we don't break above resistance which for now is holding strong).
If it comes to long term targets - I marked them with green lines. You can scroll and zoom to see long term targets. For now, we are still in consolidation - regardless of recent bullish sentiment.
Hope this helps :)
Adam.
Decentraland

MANA gaining strength for the next rally +50% profit opportunityHey guys welcome for a fresh crypto update
--------------------------------------------------------
A request from all of you to please like and follow our Hard work to keep encouraging us, there's no fee for likes and followings :)
--------------------------------------------------------
so here MANA Decentraland looks good for a buying opportunity under 575 sat expecting another rally towards 850-900 sat zone
--------------------------------------------------------
as wave 2 looks already completed at FIB5 and next wave will take previous highs, however 470 sat will the best stop incase things goes wrong
--------------------------------------------------------
Take entry under 575 sat
Target +850 sat
SL 470 sat
--------------------------------------------------------
Thanks for reading...
--------------------------------------------------------
this is Husain Zabir, signing out
Thankyou...


MANABTC: Public Launch and Likely PumpBought a little, first target 790 satoshi. Stop is wide but I'm watching the trade closely.
Decentraland, the first ever blockchain-based virtual world, is going live to the public, on 20.02.2020. So, this news can be a catalyst for further growth or protection from falling. 'Buy the rumor'
Information is just for educational purposes, never financial advice. Always do your own research.


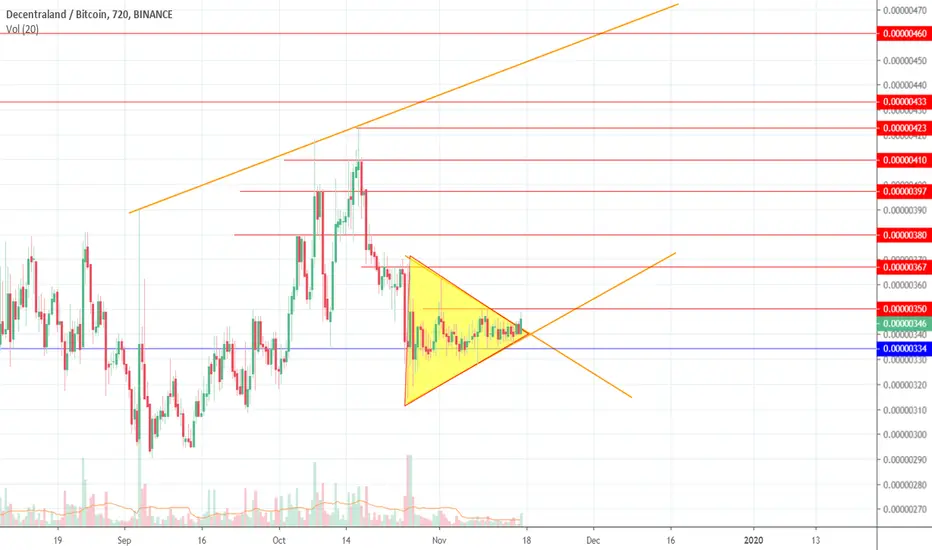
MANA A breakthrough of the 50% accumulation channel occurs. There is a breakthrough of the accumulation channel. It is important that the price fixes above the channel resistance. If this happens, it will mean that the side trend is changing to an uptrend.
ENTRANCE + Stop Loss
Entrance now or on a rollback after a breakthrough of the channel resistance
Stop Loss under the channel resistance line.
TARGET.
The first target to the first resistance is + 50%. Next, how will the price of resistance react. All levels on the chart.
If after a breakthrough the price rolls back and consolidates below the resistance of the channel , thereby forming a false breakdown - trading in the accumulation channel.
Wait for a new good entry point:
1) from the bottom of the channel after confirmation of support.
2) the entrance to a new breakthrough of channel resistance.

mana in symetrical trianglelooks like mana is in a symetrical triangle which imo would break out in the upside direction. target around 570 sats is the target. but with the public launch on 20 februari i believe more gains in the coming weeks are yet to come.

Decentraland Tries Again | Chart Fully MappedMANABTC challenged Decembers 2019 high yesterday... Today's candle is leaning towards the bulls... Let's see what we have here.
Looking at Decentraland (MANABTC), we have some mixed signals but the bulls are surely in control.
For the last bullish wave, prices retraced all the way to 0.618 Fib. retracement support, notice that this is higher than 0.786 that we are usually seeing, circled in purple on this chart.
A shorter retrace is a positive/green signal.
MA200 was conquered and tested as support and the RSI is very strong.
A 35%+ move is easy on this setup if 0.00000517 is broken. I am bullish on this pair overall.
Thanks a lot for reading.
Namaste.

MANABTC LONGYup... The whole market is gonna roar tomorrow. Happy days are ahead for those beautiful retards that remained vigilant the last three years without having learned a damn thing about the market. I have a feeling they will hodl all the way to the top and then bottom again... lol Dummies never learn but there is gonna be alot of money to be made off their backs.
God Speed,
Mr. Lucifer.

MANA/BTC Local uptrend The price is above the horizontal channelMANA / BTC Local uptrend. The price is above the horizontal channel of accumulation.
Mana, after breaking through the resistance of the accumulation channel, the price rolled back and is now near the important zone. At the moment, the price is in a local uptrend.
Perhaps the price will continue to move in the local upward channel.
Keep a close eye on the local trend line (red line).
If the price breaks this uptrend line and consolidates below it, there is a high probability that they will return back to the horizontal accumulation channel.
Former trading idea. MANA A breakthrough of the 50% accumulation channel occurs. Pivot points.
ENTRANCE
Input options from support for a horizontal channel or from a line of a local uptrend. But on condition that they are confirmed.
Stop loss
Under key levels during your entry.
Stop Loss under the support line in the area of 0.00000400 channel. Or under an upward local trend line if the entry is higher.
TARGET.
The first target to the first resistance is + 50%. Further, how the price of resistance will react. All levels on the chart.
If the price consolidates below the support of the channel and below the local uptrend (breaks it) , then it is more likely that the price will return back to the horizontal channel of accumulation.
With this development, wait for a new good entry point:
1) from the bottom of the channel after confirmation of support.
2) the entrance to a new breakthrough of channel resistance.

I Need Mana!Catchy title hey? MANABTC has formed a bullish W following a bearish descending triangle. Testing the success rates on formations that are less common but still present, for example the bullish W.

Decentraland (Dec 24) - 50% in 24 Days#MANA/BTC (Binance)
Entry Zone: 390 - 400
Take Profits: 420 - 450 - 480 - 500 - 550 -600
Stop Loss: 340
Decentraland Jumps 41% After Hitting New All-Time LowDecentraland (MANABTC) is now printing some really strong bullish action and telling us that more is on the way.
Right now we have huge volume and EMA50 being challenged.
If MANABTC can conquer EMA50 on this first jump, it is very likely to go so much higher in the short-term.
Looking at the long-term chart, the weekly timeframe, we can notice the following signals for MANABTC
Inverted hammer candlestick at the bottom of a trend.
Increasing volume.
Challenging EMA10.
Bullish altcoins market.
Huge profits potential.
Here is the chart:
Thanks a lot for reading.
Remember to hit LIKE to send us some LOVE!
Namaste.


Today`s ALT!!! MANABTCBINANCE:MANABTC
Exchange : Binance
Coin: MANABTC
Buy Zone: 0.0000035 ~ 0.0000034
Target Point: 0.00000365/ 0.0000038/ 0.00000395/ 0.0000041/ 0.0000042/ 0.000043
S/L: 0.0000033
Risk: HIGH
Term: Middle - Short
You should be careful in buying MANABTC because of Bitcoin
It`s trying to break Symmetrical Triangle
The Chart and RSI are similar
It`s time to be pumping !!!
=====================================================================
Today`s ALT is that information is raised regardless of the Coin market situation
So sometimes there`s a high risk trading
Investment is your responsibility.
I'm just providing about coin`s information
=====================================================================
MANA / BTC Formed figure Bowl (Saucer) First target + 110%Perhaps a Bowl figure will be formed (Saucer, Rounded Bottom). Target of the figure + 110% Price at historical minimum. 4 months in lateral movement. Price begins to rise slowly. It seems that we are at the beginning of the 3rd phase of the formation of the "Bowl" figure.
The first Sales Goals are the “Bowls” resistance level zone. 600-670 satosh.
Further on the situation, how the price will fix. Other target levels are the levels of the previous horizontal channel that existed for more than a year. 900, 1200, 1500, 1800 satosh.
Stop Loss - the level of support of the "Bowl". (red level) - about 300 satoshi
___________________________________
I will describe this figure a bit:
The Saucer shape, or as it is often called the Chalice, the Rounded bottom is a long-term figure that predicts long-term growth that looks like a concave arc. The figure is found on large timeframes. In most cases, on weeks, but on instruments that quickly go through their cycle (cryptocurrency), they can occur on a daily timeframe.
The rounded bottom is quite rare, but very reliable bullish pattern. Typically, a pattern is formed at the end of a long-term “bearish trend” and usually gives a signal of a market reversal.
It should be noted that the ideal symmetry of the figure is not a prerequisite. The main thing is the presence of its key components: the descent of the price, the bottom, the rise in price and the breaking of resistance.
Ideally, the formation of the “Saucer” pattern usually occurs in a narrow price range, in a calm market with the least volatility, when a trend reversal occurs smoothly, without strong price spikes. If, however, price spikes occur, then very soon the price will return to its usual range. The figure signals the long-term nature of the formation of a trend movement. The longer the figure forms in time, the stronger the signal is considered. The most reliable are the figures formed on weekly charts for at least several months. The older the time frame, the more reliable the signal. The rounded bottom is a long-term figure, and can stretch on the chart for a long period.
_____________________________
Stages of the formation of the figure.
The Saucer figure consists of the following steps:
1) The descent of the price is the first phase of the figure . Price decline trend with a gradual slowdown. In the classical case, it should be a smooth arc, but in practice its shape can be flat or contain, on the contrary, correction minima and maxima. The main condition in this case is the gradually decelerating pace of price reduction.
2) The bottom is the lowest point of prices . It is the geometric center of the figure. It should be located on a gentle bottom (smooth bottom, without peaks). Although sometimes such a formation as the "Thorn" down or closed squeezes comes across at the bottom. The main thing is that these local formations do not violate the overall picture of the figure and movement in the global. If the lower point of the price forms the so-called platform on the chart, then the trading volumes gradually decrease, and at the moment of the price jump up sharply increase. Another surge in prices may be a signal to buy if the maximum of current prices is higher than the previous maximum.
3) Ascent of the price - after the minimum follows the ascent, which should ideally be symmetrical to the descent, and should last as long as the first phase (the descent of the price). There is a tendency to increase prices with a gradual acceleration.
4) The intersection of the resistance formed by the upper boundary of the whole figure (passes through the maximum point of the figure at the beginning of the period of its formation) is an additional confirmation of the rounded bottom and the final phase of the formation of the figure. After breaking through and fixing the price, the resistance level turns into ur
_______________________________
Setting sales targets when working with a figure.
At the expense of selling goals, there is no exact opinion among traders. You need to understand that this is a long-playing figure and has a pronounced bullish character. In most cases, phase 3 (price rise) ends with phase 4 breaking through resistance and fixing the price above it. Thus fully confirming this figure of technical analysis . But you need to understand that this does not always happen! There are exceptions.
It is also important if the price is being traded in your favor, and according to the plan you should already fix the profit, then it is advisable to stay in position while you get additional profit instead of the planned one.
There should be a strategy and plan. At the same time, your strategy and plan should be plastic from market situations.
I trade such formations like that. As a rule, I enter the 2nd phase on the “Day”, but then when the trading volume starts to increase (the beginning of the 3rd phase is the ascent). It is very important not to "stay at the bottom" for a long time. Time is money.
I leave the position in 2 stages according to the situation:
a) I sell a large part of the position at about 70% just before the resistance (before the start of phase 4).
b) if the price failed to break through or gain a foothold, I will sell the remaining 30% of the market.
c) if the price was able to break through the resistance and consolidate. Resistance has become support. I buy back at the pullback prices the same 70% that I sold in advance before the resistance. Very often the price differs by a couple%. The confirmed new support gives great potential for further growth. It is very important that there is not a big gap between the sale and the purchase. If the price after confirmation of support has gone high - I trade the remaining 30% of the position.

Sick WicksHey folks,
I like mana but I never liked the price action. It always seemed like it wanted to rally but never could. The wicks are pretty hard to miss when looking at this coin. That being said, With the weekly rsi crossing back above 20, riding the 9ma, and the macd lines have crossed and have expanded, maybe this is the start of the rally that could.
Or maybe we’ll dump down to 115 sats. mfi is a bit high.
Cheers

Today`s ALT!!! MANABTCBINANCE:MANABTC
Exchange : Binance
Coin: MANABTC
Buy Zone: 0.0000037~0.0000036
Target Point: 0.00000378 / 0.00000395/ 0.00000408/ 0.00000422/ 0.00000432/ 0.00000458
S/L: 0.0000035
Risk: HIGH
Term: Middle - Short
It`s moving in Huge Rising Wedge
All chatts less than 1 day have Hidden Bullish Divergence
I thinke it`ll touch upside of Huge Rising Wedge and break it
=====================================================================
Today`s ALT is that information is raised regardless of the Coin market situation
So sometimes there`s a high risk trading
Investment is your responsibility.
I'm just providing about coin`s information
=====================================================================

Mana/ETH watching for long potential. MANA/ETH (Decentraland/Ethereum) Binanace
Candles : Daily
R : 4.17
Length of Wedge : 129 Days
Watching for true breakout of the wedge for a long.
Note new indicator at bottom : Crypto Performance vs Index (just started checking this out, take a look) -->

Decentraland Next Target | Short-Term Uptrend FormingDecentraland (MANABTC) is starting to form an uptrend in the chart term. In the chart above you can see the next target (0.00000411).
Above the green line, prices can easily move up/higher.
Below the green line prices can easily move down/lower.
The magenta lines are for resistance/targets.
The blue dashed lines are for support.
The orange triangle is the neutral/consolidation zone before the breakout.
This is a bullish chart setup.
MANABTC is very likely to move next.
Thanks a lot for the support.
Namaste.

Decentraland (MANA) - Rounding Bottom ?Do I really need a description for this? Self explanatory.
These are a few of the requirements for a rounding bottom:
Prior established downtrend
A clear level of resistance
Rounding price action
High time frame
Equal length between decline and incline

Decentraland (Sept 26) #MANA $MANA #BTC $BTCWhat to know :
- My Red Arrow indicates the expected target and expected time
- All Free Signals are hidden the trade info
- Only 50% signals are Free
