Decentraland/Bitcoin (July 29) #MANA $MANA #BTC $BTCMANA is not good now. I think it will drop to 360-365 zone. At this zone, we will take risk
Decentralandbtc

Decentraland/Bitcoin (June 20) #MANA $MANA #BTC $BTC#BUY #WAIT
Current Price : 632
Buyzone : Close to 600 as possible
Sellzone : 660-750-800
Holdzone : 1115-1240
Stoploss : Under 600
Buyback : 540-550


Daily Bullish Signal $MANA #MANA #MANABTC #BTC $BTC (01-04)RED ARROW indicates the EXPECTED Time and Targets
Level Stoploss point up to maximize profit and reduce risk
I'm working all the time, even in Bearish Market

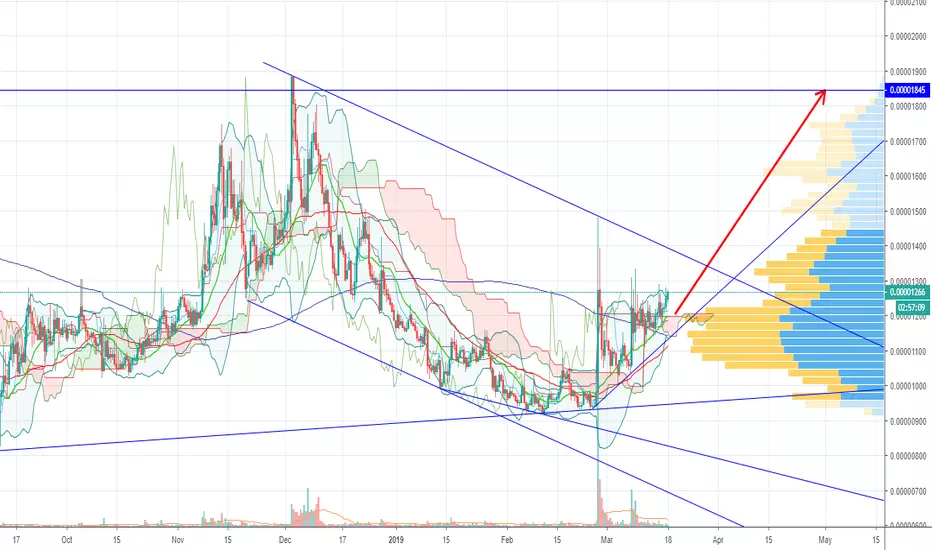
Daily Bullish Signal $MANA #MANA #MANABTC (18 March)RED ARROW indicates the EXPECTED Time and Targets
Level Stoploss point up to maximize profit and reduce risk
I'm working all the time, even in Bearish Market
LONG MANA What does the Higher time Frame Analysis Show Us?
Bullish
The RSI Stochastic appears to be crossing over shortly to the bearish side, that does not seem to be deterring based on Market Sentiment and accumulation.
Moving Averages for the 15/90/55 appear to be all crossing over at once, when this happens it usually brings about unprecedented volatility to the upside.
Volume has been consecutively on the buy-side favour.
Volume has been decreasing since the 6th of this month based on fundamental news that Colliers International, the Property Consultancy Group were partnering with MANA.
Accumulation has been active especially as individuals brought the dip.
MACD crossed over several days ago and does not appear to be running out of steam
Bearish
The RSI Stochastic appears to be crossing over shortly to the bearish side, that does not seem to be deterring based on Market Sentiment and accumulation.
Has increased by close to 14% over the past several days, this could see a fall - this is HIGHLY UNLIKELY according to Nouvive Intelligence.
Where will MANA go over the week?
Nouvive sees an entry point at 1435 to fill a gap there - however that is highly unlikely, it appears that based on favourable price action, momentum and market sentiment it will be breaking above the current resistance of 1491. That collated with Bitcoin soon to be breaking out of its downtrend and finding its temporary bottom will carry the price of MANA up.
Nouvive sees a trade from current market levels to 1435 with a stop loss just above 1400 and a take profit at 1745.

MANA continues its uptrend Q4 ANOTHER LEND SALEOur group bought at previous breakout, considering that, you will need MANA to participate in another LEND auction, this shouldnt be the end of the run, I would wait for small correction or break resistance with volume.

MANA AnalysisLooks like a nice support on the 1.616 fibonacci line and also the 234 moving average, it is now near the end of the full wave cycle so i believe an uptrend is likely as we approach the end of the year. MANA has historically performed better than a lot of alt coins while having a lot of volatility which is great if you prefer stormy seas!
Disclaimers, not intended to be financial advise, not an expert.
I am holding a little mana at the moment but only after seeing the chart.
Biffy

Daily Bullish Signal #MANA #MANABTC (04-11)#MANA (MANA/BTC)
Buy : 1140
Flash Sell : 1170
Short Sell : 1200
Long Sell : 1300-1400-1500-1600
Stop : 1100
Follow me for more signals daily

Daily Bullish Signal #MANA #MANABTC (14-09)#MANA (MANA/BTC)
Buy : 1030
Flash Sell : 1100
Short Sell : 1200
Long Sell : 1300-1400
Stop : 890
Follow me for more signals
PM me if you need help or need know to trade

Daily Analysis: Long PositionHello dear
The chart is in a bullish channel.
Now the price is at the bottom of the channel.
The record shows that when prices hit the bottom of the channel, the price rises.
The Williams Oscillator is building the floor.
The Money Flow Oscillator shows the capital's return.
It is recommended that you make a purchase at the bottom of the shopping channel if there is a price collision.
Good Luck

MANABTC weekly zoomed 1D ...back on the wave!Decentraland is back on the level that will attract more investors.
A new ATH should come and 3127sat is a very easy target.
Breaking the ascending triangle is very likely that market will pass that target and keep a new level over the next week. But in case of Pump&Dump still remain a good trade opportunity.
Have a nice gain!

Decentraland Growth PotentialI don't really think VR has a positive potential over Mixed Reality, but that is a whole different story. Given the currency price of 11 cents plus the fact that MANA is partnered with Aragon, I see some inevitable growth potential. While they entered the market with hugely negative correlations, this price seems like a dip given the potential of higher demands. If they grow at the same rate of the rest of their partners from current price, you are talking about at least a 440% positive growth potential with medium risk.

DecentraLand MANA ForecastSpotted an Elliot Wave on 2 hour chart. ABC patter is present. MANA seems ready for another go.
From my end this is a blind prediction and it may not reflect what I've draw due to many factors.
However I am hopeful of the outcome. Also provides an opportunity for swing trading. Take into consideration candlestick patterns and support/resistance positions. Furthermore plot trend-lines, include Stochastic Oscillator & RSI and it should be fairly easy from that point.
I combined Elliot waves, fibonnaci and harmonics pattern to arrive to a conclusion. I did not clutter the chart and decided to plot the Elliot Wave only for simplicity.
Like I said this might be a long shot however everything is possible. This EXACT pattern occured between 16th - 14th December 2017. History has a habit of repeating itself!
This is not an investment advice, always do your own research.

MOON GETTING ALL TIME HIGHS! (+400% PROFIT!)Moon is a great ICO that allows you to do many cool things in a VR world like go shopping buy a house and etc. It's been settings going up a lot lately and now it built up a falling wedge in a continuation pattern and now has a potential of +400%! BUY IT BEFORE IT'S TOO LATE.

MANA/BTCThis seems to have started a new Elliot Wave sub set.
Looking to buy the retracement - between 0.786 and 0.883 fib levels.
It may also retest the 1h cloud
Also Stoch RSI looks good.
This is a binance signal.

