Euro will rise a little and then start to fall to support lineHello traders, I want share with you my opinion about Euro. After a prolonged consolidation period, a strong upward trend was initiated from the buyer zone around 1.1285, propelling the EUR significantly higher. This initial impulsive move has since transitioned into a more complex and mature phase, taking the shape of a large upward wedge formation, a pattern which often signals underlying exhaustion in the prevailing trend. Currently, the pair is operating within this defined market zone, characterized by a clear ascending support line and a corresponding resistance line. The price action inside the wedge has become corrective, with the most recent upward correction originating from the support area near 1.1575. The working hypothesis is centered on a short-term bearish scenario, which anticipates that this current rally will fail as it approaches the upper boundary of the wedge. A rejection from this resistance would confirm that selling pressure is increasing and that the bullish momentum is waning. This would likely trigger a significant downward rotation within the structure, with the immediate objective being a retest of the main ascending support line. For this reason, the TP is strategically and logically placed at the 1.1665 level, as this point lies directly on the trend line and serves as the most critical test for the existing uptrend's viability. Please share this idea with your friends and click Boost 🚀
Disclaimer: As part of ThinkMarkets’ Influencer Program, I am sponsored to share and publish their charts in my analysis.
Decline

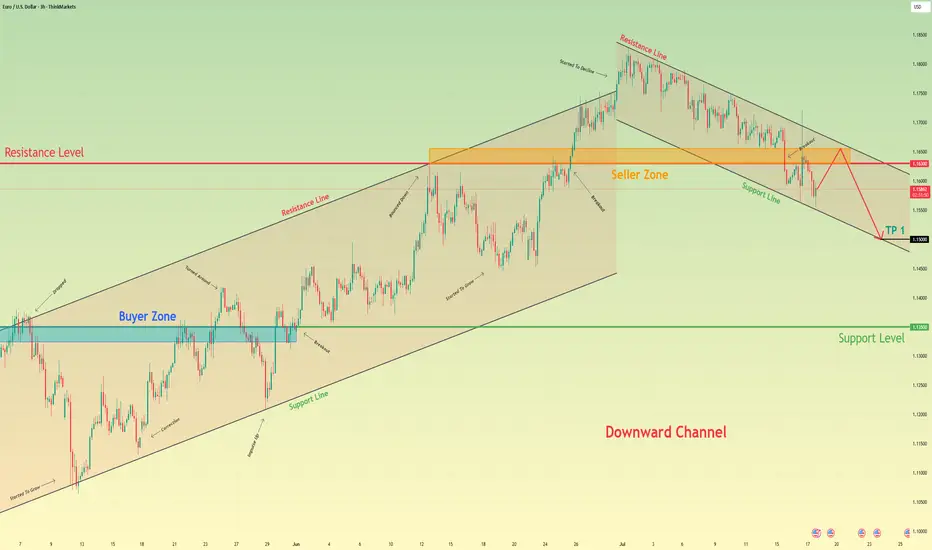
Euro may reach seller zone and then continue to fall in channelHello traders, I want share with you my opinion about Euro. The price pair has recently shifted its market structure, establishing a clear downward channel after breaking its previous uptrend. Before this breakdown, the price was consistently trading within an Upward Channel, repeatedly finding support in the buyer zone (1.1325–1.1350) and reversing upward. The bullish momentum eventually faded when the price failed to break the major horizontal resistance level at 1.1630. This failure triggered a strong bearish impulse, leading to a decisive breakout below the channel's support line and confirming a trend reversal. Currently, the price is making a corrective move up inside the newly formed downward channel, which appears to be a classic retest of the broken structure from below. I expect this upward move to stall as it approaches the heavy confluence of resistance formed by the channel's upper Resistance Line and the horizontal seller zone at 1.1630–1.1655. After testing this area, I anticipate a rejection and the beginning of a new bearish leg down. That's why I've set my TP at the 1.1500 level — it aligns perfectly with the support line of the current downward channel, making it a logical target for sellers. Please share this idea with your friends and click Boost 🚀
Disclaimer: As part of ThinkMarkets’ Influencer Program, I am sponsored to share and publish their charts in my analysis.
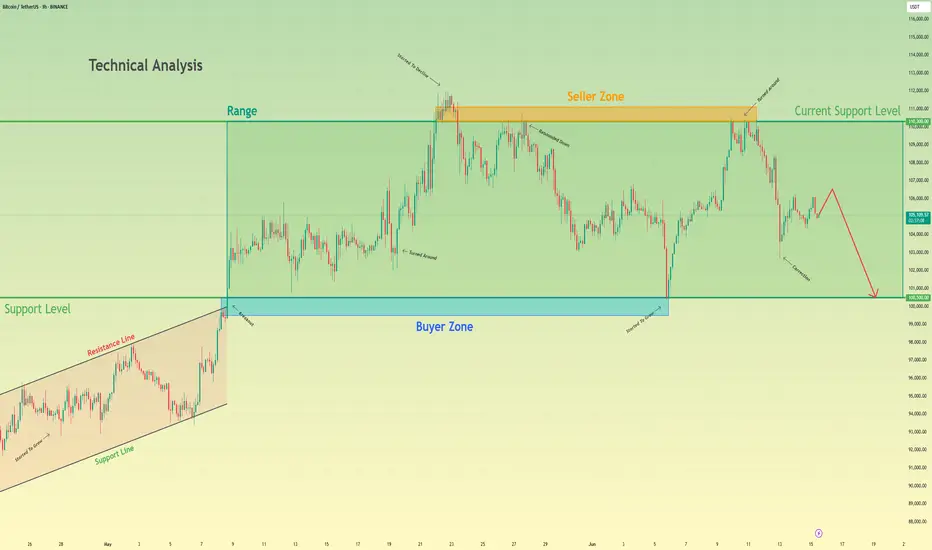
Bitcoin will make a small upward move and then continue to fallHello traders, I want share with you my opinion about Bitcoin. Earlier, the price was confidently growing inside an Upward Wedge, showing a series of higher highs and higher lows. This rising structure was supported by consistent momentum until BTC reached the seller zone between 110300 and 111100, where the growth slowed down and started to fade. From there, the price rejected this resistance and shifted into a Range, bounded by 100500 and 110300. BTC has been fluctuating inside this horizontal structure for some time, unable to break above the seller zone or below the buyer support. Now BTC is showing signs of weakness, forming a minor correction and struggling to reclaim previous highs. Given this structure and rejection from the seller zone, I expect BTC to make a small upward move and then start a decline toward the support level at 100500, which also coincides with the bottom of the range and acts as a strong psychological level. For this reason, I set my TP at 100500 points. Please share this idea with your friends and click Boost 🚀
Bitcoin will continue to fall to support level in channelHello traders, I want share with you my opinion about Bitcoin. This chart shows how the price rebounded from the support line and started to grow. In a short time, it rose to the support level, which coincided with the buyer zone, and it even soon broke this level. Next, the price rose a little and then continued to move up, but later corrected the support line. After this, BTC rebounded and rose to the seller zone, breaking the 108800 resistance level. Then it rose a little more and turned around, and started to decline inside the downward channel. In the channel, price soon broke the 108800 level and continued to fall next. Later, Bitcoin broke the support line and fell almost to the support line of the channel, after which it turned around and made an upward movement. After this movement, Bitcoin dropped to the 100300 support level, after which it turned around and, in a short time, rose to almost the resistance line of the channel. Price didn't reach this line, turned around, and continued to fall in the channel. In my mind, Bitcoin can continue to move down top support level inside the downward channel. That's why my TP is 100300 level. Please share this idea with your friends and click Boost 🚀

Bitcoin may break support level and continue to fall in channelHello traders, I want share with you my opinion about Bitcoin. Previously, price was moving inside a horizontal range, consolidating between resistance and the buyer zone near 103500 - 102900. The market lacked clear direction, and price repeatedly rebounded within this structure, failing to build strong momentum either way. Eventually, BTC exited the range and began forming a downward channel. This shift introduced a clear bearish bias, with each high being lower than the previous one. Price action started respecting the descending resistance and support lines, confirming the structure. Sellers consistently stepped in from the seller zone near 109000 - 109500, pushing the price downward with each retest. Currently, BTC is hovering around the support level at 103500 points, showing short-term weakness. The latest reaction from this area didn’t generate significant bullish follow-through. In my view, BTC is likely to break through this support and continue falling inside the channel. That’s why I’ve placed my TP at 100600 points, which matches the support line of the channel and offers a logical downside target. Please share this idea with your friends and click Boost 🚀

Euro may break support level and fall to support line of channelHello traders, I want share with you my opinion about Euro. In this chart, we can see how the price after another rejection from the resistance boundary of the descending channel, the Euro began to show renewed bearish pressure. The price attempted to gain ground above the buyer zone, but the breakout lacked follow-through and quickly reversed. This false breakout scenario often acts as a trigger for a deeper drop, especially when it occurs near the mid-range of a well-defined channel. The market remains inside a structured downward channel, with lower highs and lower lows still intact. At this point, the price is approaching the upper section of the buyer zone again. If sellers regain control and push the market lower, a breakdown below 1.1135 could open the way for another leg to the downside. I expect EUR will continue declining toward the support line of the channel. That’s why my current TP 1 is set at 1.100, which aligns with the lower boundary of the structure and marks a potential short-term target for bearish continuation. Please share this idea with your friends and click Boost 🚀

Bitcoin can drop from wedge to 100K pointsHello traders, I want share with you my opinion about Bitcoin. After consolidating for an extended period within a triangle pattern, the price eventually broke out with strong bullish momentum. The move was supported by a solid rebound from the buyer zone and a clean breakout above the 92800 - 94200 support area. This breakout initiated a steep climb, forming a new upward wedge structure, defined by narrowing trend lines and rising local highs. Currently, the price is trading near the resistance boundary of the wedge, around the 104000 - 105000 zone. This zone has already triggered one rejection and is showing signs of weakening bullish strength. Given the rising wedge geometry and the fading impulse strength, the risk of a correction is increasing. The current structure typically leads to a pullback, especially after such a steep rise. I expect that BTC may rise to the resistance line of the wedge and then drop below the support line, thereby exiting from this pattern. That's why I set my TP 1 at the 100K points. Please share this idea with your friends and click Boost 🚀

Euro will rise a little more and then make correction to 1.0950Hello traders, I want share with you my opinion about Euro. Earlier, the price started to grow from the lower region near 1.0730, where it bounced off the buyer zone between 1.0690–1.0730 points and entered a strong upward movement. This impulse helped Euro break through previous resistances and approach the upper boundary of the support area, which lies between 1.0950–1.0990 points. After reaching a local high, the price formed a pennant pattern, consolidating within narrowing trend lines while respecting both the support and resistance structure. During this phase, the pair remained stable, building pressure before making the next move. Recently, EUR made a strong breakout to the upside, exiting the pennant and continuing its bullish rally. The price surged rapidly and now trades above the current support level at 1.0950, reaching fresh highs in this local trend. I expect the price to reverse soon from the current overbought region and begin a decline toward the support area, which now acts as a potential pullback zone. My target for this corrective movement is the 1.0950 level, which aligns perfectly with the current support level and the upper boundary of the support zone. Please share this idea with your friends and click Boost 🚀

A big decline on BAN/USDT upcomingWhile every single indicator shows that BAN/USDT shows strong buy , our team diagree. Let's find out why..
Ban in the past 24hrs had a big pump of 120% , clear sign of manipulation..
Buyers started coming in and the coin will liquidate all of them..
A drop of 33% is expected from this coin..
Lets see if we are right on this one..

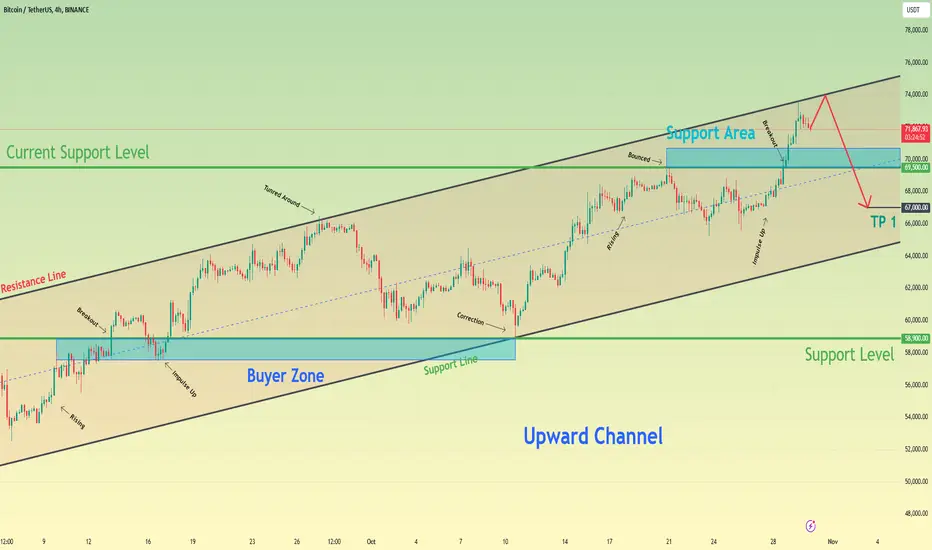
Bitcoin can reach resistance line of channel and start to fallHello traders, I want share with you my opinion about Bitcoin. Observing the chart, we can see how the price some days ago entered an upward channel, where at once it made little correction and then rose to a support level, which coincided with the buyer zone. Then BTC broke this level, after which made a correction to the buyer zone, and then BTC made an impulse up to the resistance line of the upward channel. After this movement, the price turned around from this line and then started to decline to the 58900 support level, which coincided with the support line of the channel. Later BTC rebounded and continued to move up inside the upward channel and some time later reached the current support level, which coincided with the support area. Price rebounded from this level and made a correction below, after which made an upward impulse to the resistance line of the channel, thereby breaking the 69500 level. But a not long time ago it started to decline, therefore I think that BTC can grow to the resistance line and then drop below a current support level, breaking it and continuing to decline. For this case, I set my TP at 67000 points. Please share this idea with your friends and click Boost 🚀
Euro can reach resistance zone and then continue to fallHello traders, I want share with you my opinion about Euro. By observing the chart, we can see that the price some days ago tried to grow, but failed, turned around, and started to decline inside the downward channel. Inside the channel, the price firstly declined to the seller zone, after which tried to grow to the resistance line of the channel, and when it reached this line, the price continued to fall. Soon, EUR broke the 1.0910 level, made a retest, and later continued to fall. Some time later, the price fell to 1.0815 current resistance level, which coincided with the resistance area and at once bounced up, but soon turned around and continued to decline in the channel. Price fell to the resistance area, some time traded inside, and then broke the 1.0815 level. After this movement, the Euro dropped to the support line of the channel, but a few moments ago, it turned around and started to move up. At the moment, I think that the price can reach the resistance zone and then continue to decline inside the downward channel. For this reason, I set my TP at 1.0735 points. Please share this idea with your friends and click Boost 🚀

Bitcoin will break support level and continue to fall to 61800Hello traders, I want share with you my opinion about Bitcoin. By observing the chart, we can see that the price some days reached the support level, which coincided with the buyer zone, but at once rebounded and declined a little below. After this movement, the price started to grow inside an upward channel, where it soon reached the 59000 level and broke it. Next, the price made a correction to the buyer zone and then continued to move up to the channel's resistance line, which coincided with the current support level and then turned around. BTC corrected the 59000 level, after which it rebounded and in a short time rose back to the 66300 level and some time traded near. Soon, the price broke this level and rose almost to the channel's resistance line, but recently it turned around and dropped to the support level, which continues to trade very close. In my opinion, the price can make a small move up and then continue to decline to support line of the upward channel, breaking the support level. That's why I set my TP at 61800 points. Please share this idea with your friends and click Boost 🚀

Euro can reach resistance line of channel and then continue fallHello traders, I want share with you my opinion about Euro. Observing the chart, we can see that the price some days ago entered to downward channel, where it at once rebounded from the resistance line and started to decline. In a short time price reached the 1.1030 level and some time traded inside the seller zone, after which broke this level. Next, the price fell to the support line of the channel and then tried to grow, but later failed and fell to the current resistance level, which is located inside the resistance area. Euro some time traded near this area and later continued to decline, thereby breaking the 1.0900 level. Then the price some time traded below this level and not long time ago continued to move down. Now EUR fell more and continues to decline inside the downward channel, so, I think that the price can rise to the resistance line of the channel and then rebound. After this, the price can continue to decline to support line of the channel, for this case, I set my TP at 1.0750 points, which coincides with this line. Please share this idea with your friends and click Boost 🚀

Euro can break support level and continue to declineHello traders, I want share with you my opinion about Euro. Observing the chart, we can see that the price some days ago entered to pennant, where it at once made an upward impulse from the support line to the support level, which coincided with the support area. Then it rose higher than the 1.0930 level, but soon fell back to the support area, where some time traded and then finally broke the 1.0930 level. Next, EUR continued to move up to the resistance level, which coincided with the seller zone, and even broke it and reached the resistance line of the pennant. But after this, the price turned around and in a short time declined to support line of this pattern, breaking the 1.1105 level again. Later, EUR quickly rose back to the resistance line, but soon turned around and made an impulse down to the 1.0930 support level, thereby exiting from the pennant and breaking the resistance level one more time. Also recently, the price rebounded from the support level and started to grow. For this case, I think that the EUR can rise a little more and then break the support level and continue to decline. That's why I set my TP at 1.0850 points. Please share this idea with your friends and click Boost 🚀

Euro can reach resistance level and then start to declineHello traders, I want share with you my opinion about Euro. Observing the chart, we can see that the price declined to 1.0775 points, after which turned around and made a strong impulse up to the 1.1000 support level, which coincided with the support zone. Then the price rebounded from this level and made a small correction movement, and then continued to move up next. Soon, the price broke the 1.1000 level and made a retest, after which rose to the resistance level, which coincided with the seller zone. Next, EUR turned around and started to decline to support the level inside a triangle. And when it reached this level, which coincided with the support line of the triangle, the price turned around and rebounded. A short time later Euro reached the 1.1200 resistance level and some time traded near this level and even tried to break it, but failed and dropped below. So, in my opinion, the price can reach the resistance level again and then start to decline to support line of the triangle. After the price reaches this line, it can break it, thereby exiting from the triangle pattern and continuing to move down. For this case, I set my TP at 1.1060 points. Please share this idea with your friends and click Boost 🚀

Euro can start to decline from resistance line of wedgeHello traders, I want share with you my opinion about Euro. Observing the chart, we can see that the price entered to upward wedge, where it at once turned around from the support line and rebounded up to the 1.1000 support level, which coincided with the support area. After this movement, the EUR made a correction movement and then bounced up higher than the 1.1000 level, breaking it, but soon turned around and declined below. Then price started to grow and later reached the current support level, which coincided with one more support area. Soon, EUR broke this level and reached the resistance line of the wedge, but then it at once turned around and declined to the 1.1000 support level, breaking the 1.1140 level again. Also, the price reached the support line of the wedge again and after this, it turned around and bounced up to the 1.1140 level. This level price broke a not long time ago and at the moment it trades near the support area. In my opinion, the Euro can reach the resistance line of the wedge and then start to decline to the support line, breaking the support level. For this reason, I set my TP at 1.1065 points, which coincides with the support line of an upward wedge. Please share this idea with your friends and click Boost 🚀

Bitcoin can continue to decline inside range to 54800 pointsHello traders, I want share with you my opinion about Bitcoin. By observing the chart, we can see that the price some days ago entered to triangle, where it at once started to decline from the resistance line and soon fell below the 61200 level, breaking it. Then the price dropped more and broke the 53300 level, reaching the support line of the triangle, after which it turned around and started to grow. In a short time price rose to a resistance level, which coincided with the seller zone, breaking the 53300 level one more time. BTC some time traded near the resistance level and then fell to the support line of the triangle and then quickly rose to the resistance line of this pattern, breaking the resistance level. But then the price made impulse down, thereby exiting from the triangle pattern and breaking the 61200 level too. Also, BTC started to trades inside the range, where it declined to support level, which coincided with the buyer zone and at once rebounded up. A not long time ago price reached a resistance level and soon rolled down, and now it declining. So, for this case, I think that the price can rise to the resistance level and then continue to fall to almost the support level. That's why I set my TP at 54800 points. Please share this idea with your friends and click Boost 🚀

Euro can reach resistance level and then rebound down to 1.1080Hello traders, I want share with you my opinion about Euro. Looking at the chart, we can see how the price entered to downward wedge, where it at once rebounded from the resistance line, which is located in the seller zone, and started to decline. In a short time price fell to the support line of the wedge, and then tried to grow, but failed and continued to decline to the buyer zone. In the buyer zone, EUR reached the support line of the wedge and at once rebounded up, thereby exiting from the wedge and breaking also 1.1035 level. Then price continued to grow until it reached the 1.1135 resistance level, which it even tried to break but failed and made correction to the support level, and even lower. Later EUR entered to another wedge, where it fell firstly to the support line and then started to grow. In an upward wedge, the Euro rose almost to a resistance level, thereby breaking the 1.1035 level. At the moment, I think that the price reach a resistance level and then rebound down, thereby exiting from the wedge. Also then, the Euro will continue to decline, therefore I set my TP at 1.1080 points. Please share this idea with your friends and click Boost 🚀

Gold will make downward movement to support levelHello traders, I want share with you my opinion about Gold. Looking at the chart, we can see how the price trades in the range, where it long time trading near the current support level, which coincided with the support area and top part of the range. After this, the price turned around and made a small movement up, after which rose back to the support area and soon started to decline to the bottom part of the range. When Gold fell to this part, it broke the 2485 level and declined a little below, thereby exiting from the range. Then the price started to an upward channel, where it broke the 2485 level one more time and in a short time rose to the resistance line of the channel and then made a correction to the support line. Next price continued to move up inside the channel and soon reached the 2525 level, after which made small correction to the support line of the channel. After this, Gold made a strong upward impulse, thereby breaking the 2525 level, and later exited from the channel. At the moment, the price continues to move up, so, in my opinion, Gold can make a downward movement to the support level. For this case, I set two TP, first at the 2550 points, and second at the 2525 level. Please share this idea with your friends and click Boost 🚀

DXYDXY is trading under the declining trendline . The price is reacting well the support and resistance of falling trendline.
Currently the price is getting support from descending channel and now seems like the bulls are getting ready for some strong upside movement.
If the bulls sustain to upside the optimum target could be 104.3 followed by 104.6
What you guys think of this idea?

AUDCADAUDCAD was trading in symmetrical triangle pattern. The price was reacting well the support and resistance of triangle.
Currently the price has given the breakout of triangle and now retesting the broken level where it is also forming a local support zone and seems like the price may go for another leg higher.
If the breakout sustain to upside the optimum target could be 0.8900
What you guys think of this idea?

MKRUSDTMKRUSDT was trading under declining trendline and recently it seems like the sellers are bit exhausted then bulls took the charge and break through declining trendline.
Currently the price has given the breakout from falling trendline and now forming a local support around 1400 region.
Will the bulls take charge again continue for leg higher?

#NYSE Advance Decline showing market strenthAdvance decline has made a new swing high confirming the rally in the SPX and supporting strength for further gains in week ahead. Have very little reason to be bearish SPX at this point in time when market breadth is supportive
