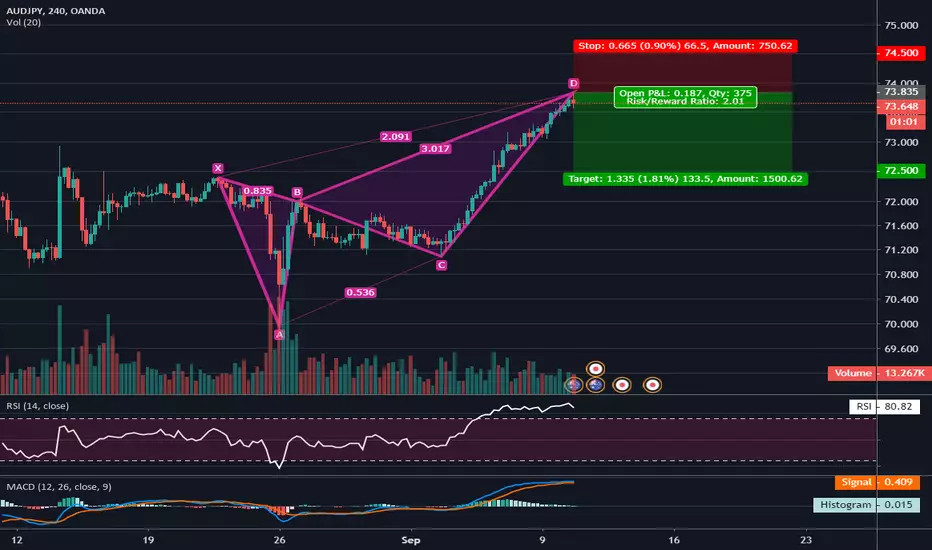
Bullish deep crab developingHere is a bullish crap developing
Hvis mønsteret går over 200% XA retracement vil prisen højst sandsynligt presse sig højere inden faldet
TP1 197.84
TP2 163.32
SL: 323
Deep Crab

Trade Ideas Position: GBPAUD CrabA bearish deep crab pattern type2 setup for a countertrend trade. This round, even better it returns with a double top setup with RSI Divergence. How good is that right?
I will need a further confirmation before I engage this trade. A setup like this will take months to complete.

Trade Ideas Position: GBPAUD CrabA deep crab pattern on the 4-hourly chart suggest a potential countertrend trading opportunity on a type2 setup.
What's better it came in with an RSI Divergence on a double top setup.
I'm waiting for further confirmation to engage this trade.

another Deep Crab The projected developing Deep Crab completed almost at the exact price forecasted.
Intra-day this pattern looks interesting. Clusters at 1456 and 1463 indicate these as ideal targets.
Make sure you give the chart a like and dont forget to leave a comment
Good luck to all trading gold
God bless

Devloping bullish deep crabThis pattern is developing and will complete around 1451.5
Once complete price is expected to rally up
Dont forget to give the chart a like and comment below with your thoughts regarding the analysis
God bless and good luck to all trading gold


USDCHF updateThe Bearish Deep Crab failed and turned into a Bearish Bat on a higher dimension.
Potentially still some more upside before the initial swing down.
Dont forget to like the chart and thank you for reading the short analysis!
God bless

SPX Deep Crab - The Difference Point B MakesI was re-watching Scott Carney's video on the Deep Crab when I noticed something. The software he uses pinpoints the precise B point, as opposed to the peak. So I thought I would look at both.
The left side is if you were to project the B point off of the XA - 0.886 @ 3004.51 and the right is simply from the swing high. There are three distinctions I noticed.
First: 1.272 AB = CD is the minimum requirement for triggering the Deep Crab
Left side: 1.272 AB = CD was triggered today @ 3087.94
Right side: 1.272 AB = CD is yet to be triggered @ 3110.17
Second: The 2.0 BC target
Left side: The 2.0 BC target @ 3153.26, which is beautifully inline with the primary XA 1.618 @ 3155.12
Right side: The BC target is all the way above the primary XA 1.618 @ 3188.04
Third: The 1.618 AB = CD
Left side: Right below the XA 1.618 @ 3151.05
Right side: Below the right side's 2.0 BC target @ 3188.04
**The 1.618 @ AB=CD is not significant/required for the Deep Crab at all, however just look at the left chart... it's fib porn.
Really curious to watch this unfold. The Deep crab is a volatile structure, so I'm going to use a combination of both the left and ride side's ratios. So if we breach the primary zone on the left, I will be utilizing the AB=CD and 2.0 BC zone.
Also, anyone have any particular oscillators they like using with harmonics? I usually just use divergences on the MACD Histogram, RSI, CCI, etc. I would use OBV, HOWEVER TradingView can't provide volume for the most important index chart in the world.
I spent a lot of time on this one, so if you have any feedback please comment below and if you'd like to see more leave me a like. I will probably do the NDX next, because I know there is a Deep Crab on there.


Trade Ideas Educator: NZDJPY CrabA bullish deep crab setup on the 1-hourly chart on NZDJPY has a deeper entry of the 4-hourly 5-0pattern.
I will be observing how the market react at 5-0 pattern completion to decide if to engage the deep crab pattern and may even extend the target deeper.

EURUSD Harmonic Deep Crab daily chartsAwaiting confirmation for this one.
Scouting this on the lower timeframes have led to several short positions.
Still potentially looking to go long around 23.6% CD retracement
God bless

Trade Ideas Position: CADJPY CrabA deep crab pattern as a sideways countertrend trade has engaged. Overall movement of CADJPY seems a bit whipsawy but it is still a side way setup. RSI has extremem overbought and is well resisted on higher timeframe.

Trade Ideas Position: CADJPY CrabA bearish deep crab setup for a trend trading opportunity on the daily timeframe.
Having this countertrend setup on the 4-hourly timeframe does stage a great trend trading opportunity for the higher timeframe.


CAD/JPY - Harmonic Pattern (Deep Crab) - Long positionA complete Harmonic Pattern (Deep Crab) is confirmed so I think it is the perfect time for a long position as shown.

Gold Weekly Deep crab H4 gartleyHi there, It has been a long time did not post anything lol.
Recently Oil and Gold has been in large daily swing play as the market mood swtiching risk- on and off enviroment because of trade war tension plus potential global recession. Due to the fact all central banks around the world start cutting rates, investors starting get panic which jumped into safe heaven bets(JPY,CHF,GOLD etc.)
Oil(Daily Bullish butterfly) consider as risky asset with a large correlation with CAD(The only major central bank did not cut the rate), that is the 1st clue of a potential strong CAD among majors from the price action after news has been released, see details in CAD/JPY and USD/CAD.
From my observation lately that USD/JPY have a strong negative correlation with Gold, there is a Weekly bullish Bat 2.618 pattern from U/J after a long consolidation at the bottom.
Once the Risk-on mood started, All safe heaven assets will drop but i think it just a temporary retracement, super long term view on Gold still bullish. But have to take this shorting opportunity tho :)
MON-WED looking for Long the H4 pullback on GOLD, Sell-off starting the end of week.


Trade Ideas Educator: AUDCAD CrabA bullish deep crab setup within the buy zone, the latest candle that you have seen on my LIVE data did not close below the low of the low price that touches Point D, hence it is still considered to be a long at the buy zone.
With the above definition, the market still is a trend trading opportunity. Yes, you hear me right, trend trading.

Trade Ideas Position: AUDCAD CrabIs not just a crab pattern but a deep crab pattern with a type2 bullish bat within the buy zone.
A great consideration for a trading opportunity but I will leave that decision to you.
Happy Friday.

