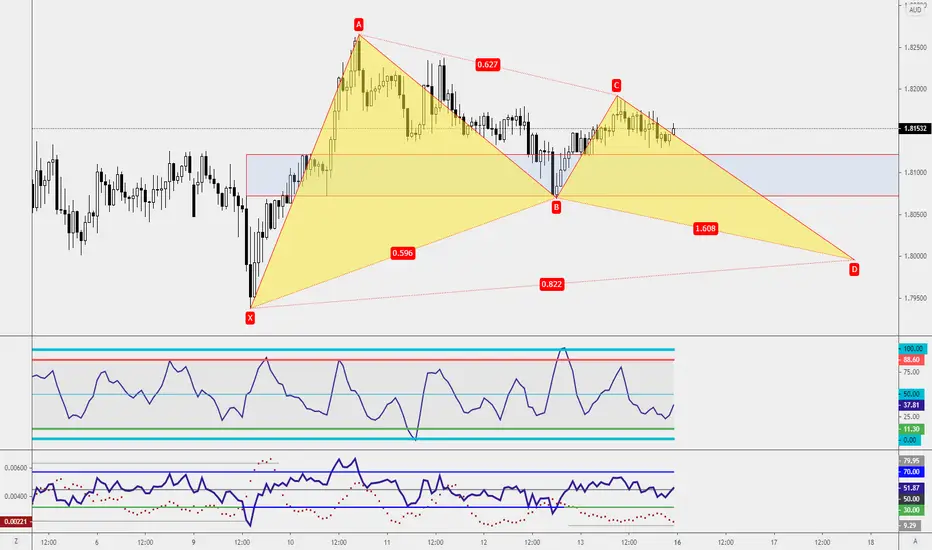
GBPUSD-Weekly Market Analysis-Jan22,Wk2Compare to EURUSD, the GBPUSD Bearish Deep Gartley Pattern isn't as promising.
There are 2 reasons for that:
1) The candle break and close above Point D, the PRZ.
2) Point BC has a violation.
You can DM me on the reason for the violation and I let you know if you are on the right track.
However, if you are a 4-hourly chart trader, you can wait for candle confirmation to engage a counter-trend trade not because of a Double Top but a retest of previous high with RSI Divergence.
Deepgartleypattern

NZDUSD - Bullish Deep Gartley @ XI know, I know... Lots of Harmonic Traders will not take this trade. But personally, I've tested this particular formation for more than 5years and it works perfectly for me so I'm going to take it.
Deep Gartley Pattern at X is my favourite setup as it gives 1 of the best reward:risk ratio which happens to be the top 3 filters in my list. Combo with long shadow candles and counter-trend level off the daily chart became the best setup I could find.
I've made my decision within seconds when I spotted this setup. Trading doesn't require you long hours starring at the screen and waiting for it to hit target or losses, you just let it run and set an alert at the right place.
These became easy when you have a good coach that teaches you how to and where to.
Check out my signature at the bottom

GBPUSD-Weekly Market Analysis-Dec21,Wk1If you had watched the video analysis, you would have seen how the wick of the candlestick touches the Bearish Parallel Channel and reverse. That's when you know you have plotted the trendline or channel accurately.
Within this 1-hourly chart, from X to A leg, there is an AB=CD Pattern hidden within the setup. Are you able to spot it? This is a quick check on your proficiency in the Harmonic Patterns.
1.3377 Is the completion of the Bearish Deep Gartley which happen to complete within the sell zone of both the 1-hourly and 4-hourly chart.
It is a great opportunity for a trend trading opportunity.

GBPUSD - Type2 Bullish BatA Type 2 Bullish Bat Pattern completed at 1.3420. Why is it important to know if it is a Type1 pattern or a Type2 pattern?
Well, a Type 2 pattern simply means that the Harmonic Pattern has reached Target1(at the minimum), this means that some of the traders who were on it, has already got off the ride, lesser traders in that direction means weaker movement.
You have to be able to accept that the movement might be slower than the Type1 setup and the movement may even go against you.
Of courses there are other indications that would suggest if it is a good idea to engage it and I've used those filters, all is left to do is a candle confirmation at the completion price.
If the market reverse from the current price, we could expect a Bearish Deep Gartley Pattern complete at 1.3503. This is also a Great Zone to short the market because the Price Action Traders may hop on the bandwagon and the structure trader may head in for a short at the Resistance as well.

NZDUSD - Bearish Deep GartleyA Bearish Deep Gartley forms within the consolidation just before the bullish bat.
However, there is a bullish bat pattern has completed on the 1-hourly chart that allows me to apply my stretch trading management.
Let's see how this trade rolls out.

AUDCAD - Bullish Deep Gartley, StackI've engaged the AUDCAD trade on the M15 chart 0.9157 on a Bullish Gartley or a Bullish Deep Gartley Pattern to some who differentiate the two setups.
The Gartley Pattern gives me a second entry opportunity of the 4-hourly chart's Bat Pattern for a buying opportunity on the Bullish Bat.
That's why is ok to miss the trade and just be patient and wait for a second chance entry.
If you like this, share the analysis with your friends and community.

AUDCAD - Bullish Deep Gartley @ XA Bullish Deep Gartley Pattern complete at X might be a Harmonic Pattern that traders may forego. Well, for me this is 1 of the best setup as I got the lowest risk possible and highest return.
And to make things even better, I've engaged a single target short with 2unit when the candle break and close outside of my channel as a potential bearish flag formation.
In a way, this trade is risk-free for me. If you decide to engage the trade, you have to observe how the candle react when it approach this region.

EURJPY - Bullish Gartley PatternThe Deep Bullish Gartley Pattern on the 4-hourly chart happens to complete at the same level as the Deep Gartley Pattern on the daily chart. If you had missed the 1st trading opportunity, this might be a second chance to engage in the trade on this counter-trend setup.
For trend traders, there is a red slanted line, and that is known as the trendline. It was the same trendline you can see from the link within the tradingview post below, resulting after the market has broken and closed below the sideways consolidation.

USDJPY-Weekly Market Analysis-Aug21,Wk1A Bullish Deep Gartley Pattern is about to emerge on the USDJPY 1-hourly chart. If you are a support and resistance trader, you might be looking for a buying opportunity at 109.41. What's more important is to wait for the candlestick confirmation before engaging on that trade.
There is at least 1 harmonic pattern on each timeframe I'm trading at, the 1-hourly chart, 4-hourly chart and the daily chart. Are you able to spot all of them?
Share your analysis on the comment box.

EURUSD-Weekly Market Analysis-Jul21,Wk4Harmonic Patterns seems to be a rampage on the EURUSD Chart. I'm waiting for a shorting opportunity on the Bearish Deep Gartley Pattern on the 1hourly chart forming up at 1.1871.

USDJPY-Weekly Market Analysis-Jun21,Wk4A Bearish Deep Gartley Pattern has formed, for those who had missed the trade, don't stress up. It is possible that the market can retrace 37pips in the coming Monday for a second chance entry.
A break and a close below 109.93 increase the strength of the bearish movement, hence, the winning rate for traders who had engaged in this counter-trend trading opportunity.
This time, my student has a different view as mine, give him a like if you share the same view as he does.

Bearish Shark or Bearish Deep Gartley?Will this pair eventually be a bearish shark pattern or a type2 bearish deep gartley pattern? And all this will be determined by the candle close. Latest by Tuesday, 11May21 we will have an idea of this trading setup.

CADJPY - Deep Gartley at XTrading at X is 1 of the trading strategy I employ when it is a Deep Gartley Formation. It has proven that it does more benefit than harm to me.
I've engaged the trade with a very tight stop with a 2:1 for my 1st target.
Although the setup doesn't look promising but let see hot it spin out.

NZDUSD - Bearish Deep GartleyI'm waiting for the Deep Gartley Pattern that completes at X, it is 1 of my favourite setup that proven to work well on the currency pairs in the timeframe I've been trading.
What're your thoughts on this setup.

GBPUSD-Weekly Market Analysis-Dec20,Wk5On 16Dec, we have identified the ABCD pattern during our live session and right now, we have a Bearish Deep Gartley pattern that forms up within the consolidation zone of the ABCD pattern.
No doubt, this is a counter-trend setup, it is a stronger setup then the week before as there is more indicator line up to support the pullback trade.
The aggressive trader can wait for the pullback of 1.3580 to short the market, the conservative trader can wait to engage the market at 1.3608.
For me, it depends on the candle formation at that level.

GBPAUD - Deep Gartley PatternWaiting for a buying opportunity at the Deep Gartley Pattern as a structure retest on a countertrend setup of a bigger bat pattern(check chart link at the bottom).
AUDCAD - Bearish Deep Gartley AUDCAD has a Bearish Deep Gartley Pattern setup at X. I love trading at the level as it has an amazing Reward is to Risk Ratio. Traders who are looking to short can wait for a retest of the resistance level(red line) for a shorting opportunity. One thing traders have to take note is that there is a consolidation above the X level.

GBPUSD-Weekly Market Analysis-Nov20,Wk1Base on the Fundamental Analysis, I'm still bullish on GBPUSD, although the Technical Analysis doesn't show a prominent setup of such. On the 1hourly chart(link at the bottom), there was a bullish bat pattern setup and the market check-back, just that it did have a break and close below X which can be a concern for traders who are looking for buying opportunity.
On the M15 chart, we do have a Deep Gartley Pattern which completes at X. Although for the setup to complete it will most likely break and close below the trendline, the only attraction it has is that it produces a Great Reward is to Risk Ratio.

AUDCAD - Bearish Deep Gartley PatternA Bearish Deep Gartley pattern setup at X. While not many harmonic patterns traders trade this kind of setup, it's kinda perfect for me because
i) I've tested it extensively on the pairs I'm trading
ii) It provides an amazing Reward:Risk.
Pending Order has been set up on this trading setup, let's see how this trade roll out.

GBPAUD - Bearish Deep Gartley GBPAUD is on a bearish trend. Having this bearish Deep Gartley Pattern provides a shorting opportunity to engage the trade and the best part is the setup is within the sell zone.

FCPO TRADING: 143) A POSSIBLE DEEP BULLISH GARTLEY PATTERNhi, this is haidojo trading and the number is 143...consolidation breeds advanced patterns...likewise, now we might face a possible deep bullish gartley pattern...it is compatible with the formation of the "neckline" in my previous analyst...don't aim high on this one...even if it works, it will just rise back mildly...not that kind you wanto hold for swing trade...nor mid-term period...
for the bullish gartley pattern, buying range frm 2650-2560...Stop-loss below that range...tp 2685...no extended target...
higher resistance : 2750
immediate resistance : 2710
lower support : 2560-2605 the possible neckline for "head-and-shoulder"
WARNING!
RISK DISCLAIMER : this is juz a trading idea...trading stocks, futures or forex might incur a huge risk to your account/funds… DON’T LOSE MONEY THAT YOU CANNOT AFFORD …any idea(s) of trading in this episode SHALL NOT be regarded as a hint of BUYING or SELLING. It is MERELY a trading journal and it has been used for educational purpose only… trade at your own risk!
**your "LIKE" and "FOLLOW" are my main source of motivation to continue posting more valuable contents...TQ**

FKLI TRADING : 98) continuation of trade 93this is an update of the previous deep bullish gartley pattern...haidojo here, this is trade 98)...
current support right at 1587...it might hit D leg completion later ranging frm 1567-1560...let's see how it goes...
IF you dun trade advanced pattern, stay away...this is a counter-trend trade...and the 1st tp is 1587,
SL can be made a few points below 1560...
for more info, pliz look at trade 93...I will put it down in the link below...gud luck and gud trading...
WARNING : this is juz a trading idea... thr is no indication of buying nor selling...this is juz my personal trading journal, trade at your own risk!
**your "LIKE" and "FOLLOW" are my main source of motivation to continue posting more valuable contents...TQ**

GBPJPY - Bullish Gartley PatternOften not we will see that Gartley Pattern has a V-TOP or a V-BOTTOM setup, this causes conservative traders having a hard time to engage this harmonic patterns setup as a retest often never happens.
Right now we have the bullish Deep Gartley pattern setup for a buying opportunity, let's see how this trade rolls out as a counter-trend trade.
