#HEX --- Scenario casting inverse Head and Shoulders to 5 centsa 5X has already occured
Why not another 5X
Through November's SEC hearing date
clearly smart has already front run positive developments
and we know HEX can do extreme price moves UP & DOWN
<3
DEFI

The buy zone is where there is complete apathyand hardly anyone is around.
#HEX has been the ultimate rollercoaster of emotions for everyone involved with this coin
I believe there is still further downside
and a VERY distinct possibility we add another zero to the price.
It is at only these low prices once can possible ride up a 100X + on this coin
Just my two hearts
can u imagine confirmation of a multi year legal fight with the SEC in November...
That is how we could totally see another 70-80% destruction of value..
at which point all the bad news will definitely be reflected in the price.
<3

PPBLZ. Still bullish after whale out.In addition to the formation of a triangle and a global downward channel, the price forms another, more global and more downward channel. Notice how exactly the price touched resistance after sold out of one of the main whales - this means the channel is valid, since at such a time interval the price did not violate the channel structure.
Now as before, I remain bullish on PPBLZ .

By break wedge(LDO)📊Analysis by AhmadArz:
wait for breake wedge
🔗"Uncover new opportunities in the world of cryptocurrencies with AhmadArz.
💡Join us on TradingView and expand your investment knowledge with our five years of experience in financial markets."
🚀Please boost and💬 comment to share your thoughts with us!

On the Bullish Road, DYDX has to stop at some station | LongBiasOn week chart
DYDX has grown through 1 year and reached to 4,363 on Nov 2023
Now, DYDX is pulling back to lower to accumulate awhile before going up
My view for this bullish around 6,3 that's #SupplyZone
DYDX has #Support around 2,17 this zone is #Apex between two trend lines
Time will tell

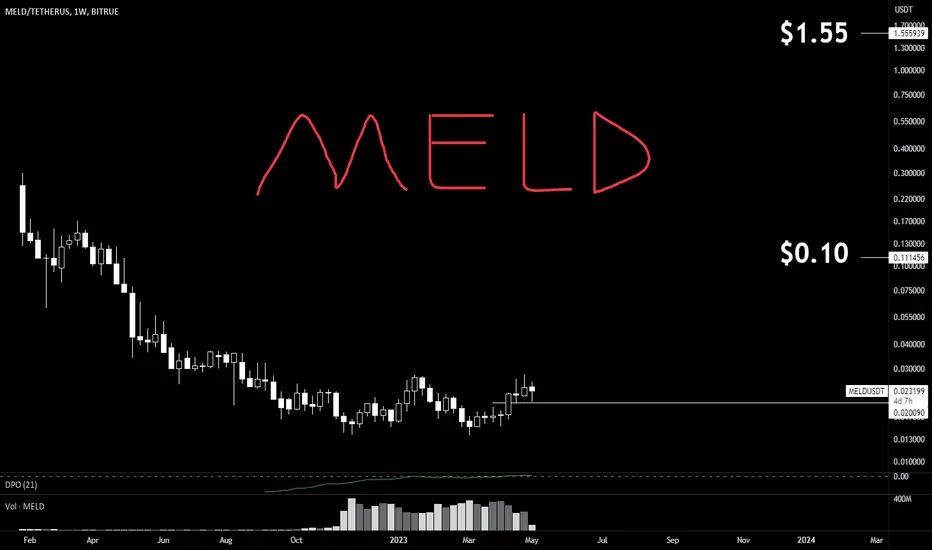
MELD: $0.023 | a Cardano De-Fi Protocolproject is decent
float is healthy 37% of which is active
cap is $34M under valued for now
team .. reminds me of QTUM
eventually price discovery shall be rewarding for current investors
Chromia Technical Analysis - 1000%+ Gain Potential What Is Chromia (CHR)?
Chromia is a relational blockchain platform that aims to make it easy for people to build decentralized applications (DApps). It was founded by ChromaWay, a company that has been working on blockchain solutions since 2014 for various sectors such as finance, real estate, gaming and public services. ChromaWay is also known for creating colored coins, which are user-defined assets on a blockchain that can represent anything from currencies to stocks to collectibles.
Chromia’s vision is to enable a new generation of DApps that can scale beyond what is currently possible and address real-world problems in various domains such as gaming, social media, finance, healthcare, education, governance, and more.
Some examples of DApps on Chromia include: My Neighbor Alice (ALICE), a multiplayer blockchain game; LAC PropertyChain, a land registry system; Green Assets Wallet, a platform for green bond verification; Hedget (HGET), a decentralized options protocol; Corite (CO), a music streaming service; Chain of Alliance (COA), a strategy game; Vault12, a digital asset custody solution; Domenation, a blockchain gaming project.
Price Levels to watch
Support Level: $.2091
Break out Zone: $.3195
Target 1: $.5903
Target 2: $.8893
Target 3 (Major Resistance): $1.06
Extended Target 1: $1.86
Extended Target 2: $2.403
Extended Target 3: $3.7785

Uniswap / governance protocol poised for success in bull-runAfter multiple bounces along the Purple support zone (3.32) - it seems inevitable that we are going to test the next resistance level at $7.72.
If we can successfully break that level my next targets are as follows
Target 1: $10.17
Target 2: $20.20
Mid/Long term target 1: $29.60
Mid/Long term target 2: $35.74
UNI is the governance token for Uniswap. UNI was introduced on 16th September 2020 through a retrospective airdrop to users who have interacted with the protocol either by swapping tokens or by providing liquidity.
The UNI token allows token holders to participate in the governance of the protocol. Key decisions such as usage of the treasury or future upgrades can be decided through a governance vote.
What is Uniswap?
Uniswap is a decentralized exchange (DEX) that makes it easy for users to swap an ERC-20 token for another ERC-20 token without the need of a centralized intermediary. With a DEX, traders do not have to deposit their tokens on an exchange and be exposed to the security risks of a centralized exchange.
Users just need an Ethereum wallet like Metamask and they can immediately start swapping tokens. Users can then swap tokens directly without the need of an orderbook. This works using an Automated Market Maker (AMM) where Liquidity Providers (LP) deposit tokens into the smart contract and this liquidity then provides a price quote to traders without relying on any professional market makers. Liquidity Providers are compensated with a 0.3% trading fee for providing liquidity on the protocol

$WIFI MAP - Future Super DATA protocol - Massive potential.A solid project that has already had great success in the Web 2 Space, Large adoption and critical use case.
Projected Targets and support levels:
Support zone $.0470 - $.00638
Target 1: $.0988
Target 2: $.1919
Fib Extension 1: $.2705
Fib Extension 2: $.3959
WiFi Map is a super app with the core asset of a community-driven decentralized wireless network that incorporates a database of 4.5 billion WiFi hotspots. Which has already achieved great success in Web2 space, reaching 150,000,000 million users, MAU 3,000,000 million and DAU 300,000 users, and is now ready to revolutionize the Web3 space with the vision of becoming a global virtual network operator.
CSE:WIFI and in-app wallet. An ERC-20 token on the Polygon network and the currency underpinning the entire WiFi Map ecosystem. CSE:WIFI will be stored on the proprietary in-app wallet as well as third-party wallets. There will be a 20%-40% discount available for redeeming services via the token inside the app, in addition to lockup and staking rewards. Furthermore, the tokenization of the platform will bring redeemable rewards for those who rise up through the ranks of the leaderboard and create further incentives for community members to contribute to the platform by adding hotspots, verifying credentials and running speed tests.
Participate-to-earn: earn tokens for adding hotspots, verifying credentials, and running speed tests
Beneficial terms for partner services: enjoy special terms when accessing partner services including power banks.
Tipping: leave CSE:WIFI tokens as a gesture of thanks to the person who added your favorite hotspot.
eSIM cashback: when you purchase eSIM data, you’ll receive 3–5% instant cashback in CSE:WIFI tokens. When you redeem CSE:WIFI tokens for eSIM data, you’ll receive a 15–20% token cashback reward.
Hold-to-earn: hold CSE:WIFI in your in-app wallet to earn eSIM data.
WiFi Map DAO: 10% of all redeemed CSE:WIFI flows into a DAO, where the WiFi Map community can decide on the best way to grow the ecosystem.

HNT Ballooning to new Heights - Potential Price TargetsHelium Network is an extremely promising venture, Not only due to its revolutionary vision but also its solid team and feverish community of supporters.
Solana Phone is likely to bring the price to new highs, very soon.
Here are my current price points for HNT
Support zone: 5.28 - 6.883
Resistance Level: 7.82
Target 1: 11.11
Resistance Level: 12.02
Target 2: 13.79
Helium (HNT) is a decentralized blockchain-powered network for Internet of Things (IoT) devices.
Launched in July 2019, the Helium mainnet allows low-powered wireless devices to communicate with each other and send data across its network of nodes.
Nodes come in the form of so-called Hotspots, which are a combination of a wireless gateway and a blockchain mining device. Users who operate nodes thus mine and earn rewards in Helium’s native cryptocurrency token, HNT.
Helium’s goal is to prepare IoT communication for the future, identifying inadequacies in current infrastructure from its birth in 2013.

TOTAL DEFI MARKETCAP LONG-TERM TOTAL DEFI MARKETCAP LONG-TERM
parallel channels within parallel channels :D
2024 is a candidate to be the year of defi again.
Best DE-FI projects:
AAVE/USD
MAKER/USD
COMP/USD
UNISWAP/USD

DefiBOX! +44,000% or -100%. Choose your side!BOX!
The project is still very small. Capitalization (cap) $3 million. 4.3 million tokens were issued out of 5 million.
It is traded only on the gateio exchange and on its own defibox service.
The volume of trades has increased nicely. In addition, we can see a clear global trend (white line) on the log graph.
As you can see, I set very big goals. Additionally, he indicated how much capitalization is needed to achieve such growth. The order has an asset capitalization of only $3 million, which is so small that it is imperceptible in the crypto world.
1 billion (1B) capitalization is a conditional position in the top 100 assets (measured by the market cap in 2021). If we even take smaller values, then a $370 million cap in an active market is not very difficult.
The project recently launched bRAM (conditionally wrapped RAM resource in token format). It works under the EOS ecosystem, has a TVL of $26 million, and is developing the USN stable.
Bought for ~$500. This is high risk, in fact, an investment in a name that may or may not be very successful - there simply won't be enough money. Therefore, in such I invest imperceptibly little relative to the deposit.

Link headed up?!If you find this information inspiring/helpful, please consider a boost and follow! Any questions or comments, please leave a comment! Also, check out the links in my signature to get to know me better!
BIST:LINK update. 🧵
Followed the path on the left and bounced
close to the level provided.
Now we get to find out what it is.
PTT and W5 MLT for the conservative bull count.
Falling back from here, could lean X/B complete...
But, hope it keeps climbing.


Break and Retest | Long BiasKSM has broken and retested the trend line for this bullish
I expect KSM will go up to $47
Time will tell

$ALGO UPDATED - Resistance Break Inevitable Just a quick update on our previous EURONEXT:ALGO trade, So far, it has performed as expected, hit resistance within the past week, and was rejected slightly back to it, We're currently expecting the current resistance level to break over the next 48 hours.
Levels to focus on and set alerts at
Updated Target level 1(Major Resistance): $0.2398
Updated Target level 2: $0.3610
Updated Target level 3: $0.5077
Targets from last chart remain the same, Expecting us to break UTL1 (Updated Target level 1) within the next 48 hours, after that major resistance I expect a sharp break upwards towards UTL2 before a potential cook off wick and then continuing to next targets, expect the first two targets to be broken within the week.

SUPPOMAN thinks #TITANX #TIT Can 100X. I agree!The game theory is deep
The game theory is sticky
A new crypto community has formed already and is growing #Metcalf's Law
and I believe u can see 100X of value being created
It's listed market cap is low ... becuase of the staking and mining
and it appears #defi builders are building products for this protocol
I agree with Suppoman
TitanX can do big numbers
********
PLEASE DO NOT BUY NOW
IT is cheaper to mine the coin currently.
If you do not understand what I am talking about... than please research on Youtube on how this defi protocol works.
best of Luck

Cosmos To the Cosmos? Bullish Play on ATOMFirst Resistance Zone - $8.70 - $10.05
Target 1: $10.05
Target 2 - Resistance
Heavy Resistance level (Previous top) - $14.15
Absolutely love this project - Solid fundamentals, Founding in 2014 (Crypto Og's) And targeting some of the prime problems in the ecosystem.
In a nutshell, Cosmos bills itself as a project that solves some of the “hardest problems” facing the blockchain industry. It aims to offer an antidote to “slow, expensive, unscalable and environmentally harmful” proof-of-work protocols, like those used by Bitcoin, by offering an ecosystem of connected blockchains.
The project’s other goals include making blockchain technology less complex and difficult for developers thanks to a modular framework that demystifies decentralized apps. Last but not least, an Interblockchain Communication protocol makes it easier for blockchain networks to communicate with each other — preventing fragmentation in the industry.
Cosmos’ origins can be dated back to 2014, when Tendermint, a core contributor to the network, was founded. In 2016, a white paper for Cosmos was published — and a token sale was held the following year. ATOM tokens are earned through a hybrid proof-of-stake algorithm, and they help to keep the Cosmos Hub, the project’s flagship blockchain, secure. This cryptocurrency also has a role in the network’s governance.

NAVI - Low-Cap High Potential Play - 50x Potential Long termExtremely undervalued token, I would like it to break the first outlined resistance before allocating capital towards this asset.
This is a high risk play, I wouldn't recommend investing more than you are willing to throw in the trash can, That being said the growth potential is huge at a market cap of just below 2 million USD This easily has the potential to 50X in a bull market scenario.
Here are my Initial Targets / Supports / Resistances
Support Level 1: $.05226
Major Resistance to break: $.07649
Target 1: $.12456
Major Resistance 2: $.25411
Mid Term Target 1 (2 weeks - 2 months) : $.27857
Major Resistance Zone (Chop potential): $.27857 - $.32316
Mid - Longterm Target (2 months - 1 Year) : $.49001
What is Atlas Navi (NAVI)?
Atlas Navi is the first Drive to Earn navigation app that uses A.I. and the smartphone camera to avoid traffic by detecting road conditions, accidents, traffic in each lane, available parking spaces, police vehicles and rerouting drivers to avoid problematic roads.
It features licensed 3D NFT vehicles and a sustainable Drive to Earn mechanism and in-app economy that rewards users for each mile driven.
Atlas Navi has received a $1,200,000 grant from the European Union to develop its technology over the course of 2 years, starting in December 2019.
With over 12 years of transportation software experience, the team and company behind Atlas Navi are among the best in the industry and well positioned to disrupt the navigation app market with A.I. and blockchain technologies.
Atlas Navi is available to download for free on the Apple App Store and Google Play or by going to www.AtlasNavi.com Join over 400,000 drivers already using it to navigate and earn whilst driving.

$INJ Updated Target levels / Resistance and supportsAfter the great success of CRYPTOCAP:INJ since our last call I wanted to update some price targets.
It has had an absolute rip since my first call yielding about 100% gain in about a month.
I can see its success continue, but we need to break over the yellow updated resistance level outlined in this chart. (33.77)
Another Critical component of this trade to pay attention to is the recent fud posted to twitter yesterday.
This is the tweet I am referring to/ x.com
It claims that collusion among market makers is the only thing keeping the price up.
Another particularly alarming fact is the TVL compared to FDV
11m to 3 billion - which is absolutely horrendous.
I personally will take profit on a good portion of my position and let the rest ride at critical points outlined.
No point being greedy in this market. Plenty of opportunities await.

CiRUS $0.11 Finding Value while Following the Moneya gateway or WEB 3.0 play that covers almost everything to find ones preferrence
from Defi NFT etc..
WiFM whats in it for you.... it rewards you from your DATA location bowsing history sites frequented etc,
the team is solid young professional and experienced yet low key...
with the guidance of MERLiNs or senior advisors to keep them tamed on track and FOCUS
could be fliped by MarcA to Unicorn ++ to big funds by 2025 or sooner when the FED decides to halt or ease RATE hikes

TITANX #TIT New #DEFI breakthrough?Or just a new Ponzi for this next bull cycle?
"TitanX.win Pumpamentals
The sole design purpose for TITAN X is to reduce supply, add programmatic buy pressure through smart contracts & drive demand to the ecosystem through various avenues and game theory mechanics."
I believe this will attract a significant flow of funds from the #HEX #RichardHeart ecosystem
As it does on the surface appear to improve on the basic mechanics of what Richard designed all those years ago ...
explore and research before doing anything with it.
AND please do not buy this token.
It is cheaper to "MINE" the coins
AGAIN DO NOT buy from the market

Massive Move is coming | Long BiasOn month chart
I found the same consolidation phase between LINK and AAVE
So I think AAVE will breakout soon like LINK
Wait for breakout and take the big chance on Defi
