CoW Protocol About to Enter Bullish Zone (214% Easy Target)'Next target' has 484% profits potential. This target is projected to hit mid-term, that is, within 3 months (90 days)... Boost & keep reading below!
Good afternoon my fellow Cryptocurrency trader, I hope you are having a wonderful week and day.
COWUSDT is about to enter the bullish zone, when the action moves above EMA55. The magenta line on the chart.
This altcoin is already bullish because it is no longer bearish. The low happened 7-April and as you can see, the market has been sideways since early February. 150 days. More than 5 months.
Notice how daily trading volume is almost flat but some days stand out with increased buying. You see green bars shooting up but never red bars. This reveals a bullish bias. We are witnessing the early days before a major bullish breakout. One that will lead to 200% and up to 500% profits mid-term. Long-term, there can be more.
Thank you for reading.
Another easy trade, huge profits, easy chart. Buy and hold.
Namaste.
DEFI

TradeCityPro | UNI Builds Pressure Below Key Resistance Zone👋 Welcome to TradeCity Pro!
In this analysis, I’ll be reviewing the UNI coin — one of the notable DeFi tokens, currently ranked 27th on CoinMarketCap with a market cap of $254 million.
⌛️ 4-Hour Timeframe
On the 4-hour chart, as you can see, UNI has formed a bottom around the 6.043 level, which is considered its key support zone. After reaching this level, the price began an upward move, though the trend appears very weak.
✔️ Currently, there’s a resistance zone just above the price that has previously caused multiple rejections. Once again, the price is moving toward this zone.
📊 The volume during this latest upward leg is very low, which is not a good sign for initiating a bullish trend. If the price reaches this resistance level with such low volume, there's a high likelihood of another rejection.
🔽 If that happens, we could consider opening a short position based on this rejection. However, my main trigger level for a short is the break below 6.896 — I personally would wait for this level to be breached before entering a short position.
✨ The next key support, in case 6.896 is broken, is the 6.043 zone. This is a major support level and could serve as the target for the short trade. If this level is broken as well, it could mark the beginning of a strong downward trend.
🔍 On the other hand, if volume starts to pick up and the resistance zone is broken, we could open a long position. The target for this could be around 8.678 — or even a setup in anticipation of a breakout above 8.678.
🔔 Which scenario you choose depends largely on your market perspective. If you're looking for a short-term trade, the first scenario is more appropriate. But if you're aiming for a long-term position with a wider stop loss, the second scenario would be the better choice.
💥 In either of the long scenarios, I strongly recommend confirming the move with volume. For further confirmation, you can also check if RSI enters the overbought zone.
📝 Final Thoughts
This analysis reflects our opinions and is not financial advice.
Share your thoughts in the comments, and don’t forget to share this analysis with your friends! ❤️

TradeCityPro | 1INCH Tests Supply Zone After Strong Bounce👋 Welcome to TradeCity Pro!
In this analysis, I want to review the 1INCH coin for you. It’s one of the DeFi coins, with a market cap of $256 million, ranked 162 on CoinMarketCap.
⏳ 4-Hour Timeframe
As you can see in the 4-hour timeframe, this coin is sitting on a support floor at the 0.1668 zone and has formed a range box at this bottom.
🔔 There’s a key supply zone at the top of this range box, which I’ve marked as a range for you, and currently, the price is inside this zone.
📊 Given the significant buying volume that has entered this coin, the price has penetrated into this range and is testing it for the several-th time.
✨ If this range is broken, we can confirm the bullish reversal of this coin and open a long position. Volume has already given us confirmation, and if RSI enters the Overbuy area, that will be our momentum confirmation.
🔼 The next resistance levels for this coin—which we can consider as targets—are 0.2031 and 0.2207.
✔️ If the price gets rejected from this zone, it may move back down toward the 0.1668 floor. For a short position, we can enter if 0.1668 is broken.
📉 However, if we get confirmation of rejection from the zone, we can look for an early entry trigger in the lower timeframes.
📝 Final Thoughts
This analysis reflects our opinions and is not financial advice.
Share your thoughts in the comments, and don’t forget to share this analysis with your friends! ❤️

#QNTUSDT #4h (Bitget Futures) Bull flag near breakoutQuant regained 50MA support after breaking out of the falling wedge, bullish continuation seems likely.
⚡️⚡️ #QNT/USDT ⚡️⚡️
Exchanges: Bitget Futures
Signal Type: Regular (Long)
Leverage: Isolated (6.0X)
Amount: 4.6%
Current Price:
100.30
Entry Zone:
99.22 - 96.92
Take-Profit Targets:
1) 106.59
2) 112.99
3) 120.11
Stop Targets:
1) 90.95
Published By: @Zblaba
GETTEX:QNT BITGET:QNTUSDT.P #4h #Quant #RWA quant.network
Risk/Reward= 1:1.2 | 1:2.1 | 1:3.1
Expected Profit= +52.1% | +91.3% | +134.8%
Possible Loss= -43.6%
Estimated Gaintime= 1-2 weeks

Do you want to have glory? Do want to see Valhalla?#HODL
These next few years will could change your life.
#ETHEREUM is cheap right now.
#ETH still can do tens of X's

AAVE — Rising Wedge + Resistance Grind = Risk of PullbackStill one of the strongest DeFi leaders. Bullish market structure, but this persistent grind into diagonal resistance usually ends with a sharp pullback — and that's the zone I'm watching.
Eyes on $210–$237 for bids.
Targets: $400 and $600.
Set alarms and chill — opportunity comes to those who wait.

DeFi Index Completes Irregular Flat Correction; Bulls Back?DeFi Index may have a completed irregular flat correction within an uptrend, which may cause another rally this year, according to Elliott wave theory.
Cryptocurrencies are recovering and DeFi Index is now bouncing back above EW channel, so a five-wave impulse into wave (C) of an irregular (A)(B)(C) flat correction in blue wave B can be finished. It means that a higher degree blue wave C can now be in play, which can rally this year all the way back to March 2024 highs. Is this the beginning of an ALTseason?
A basic bullish irregular flat correction is a three-wave (A-B-C) pattern where wave B exceeds the start of wave A and wave C dips below wave A before the overall bullish trend resumes.

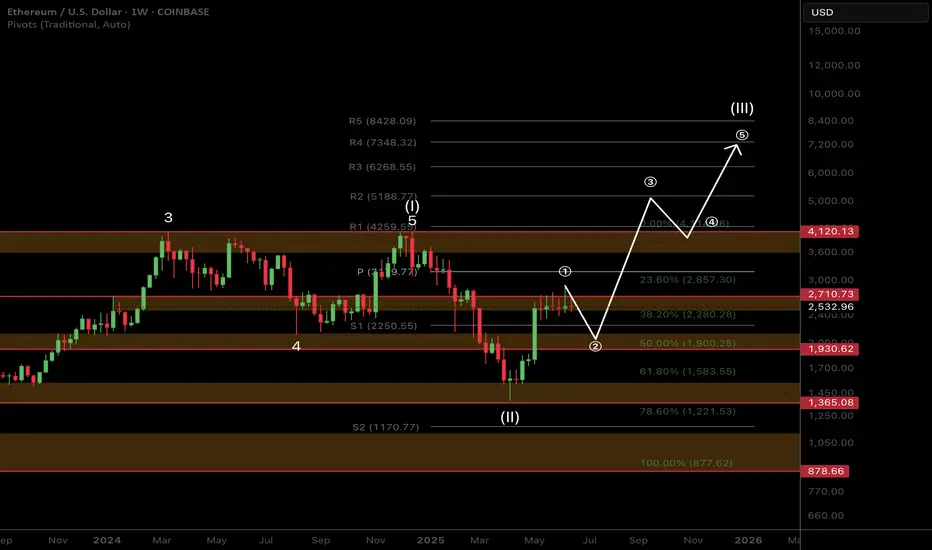
ETH Macro Analysis☕ 𝙂𝙈. CRYPTOCAP:ETH Macro analysis update...
📈 𝙇𝙤𝙣𝙜 𝙩𝙚𝙧𝙢 outlook remains unchanged and recent price action printing a doji. Target is still $7k for this cycle.
📉 𝙎𝙝𝙤𝙧𝙩 𝙩𝙚𝙧𝙢 outlook has investors looking lower towards the $1900 target but this isn't guaranteed to be reached and price action may front tat $2200.
War escalation's and retail selling are keeping price suppressed. ETF inflows and staking continue to grow!
The time for patience continues. Money is made in the sitting, weathering volatility, not flipping in and out of trades on every bit of news and price movement
𝙏𝙚𝙘𝙝𝙣𝙞𝙘𝙖𝙡 𝘼𝙣𝙖𝙡𝙮𝙨𝙞𝙨
Price is consolidating at its recent highs. Consolidation under resistance has high probability of breaking out, the longer it remains the higher the probability.
Elliot Wave (EW) analysis suggests a motif wave ended at the $2700 resistance, with a wave 2 retracement underway, likely a shallow one.
Safe trading
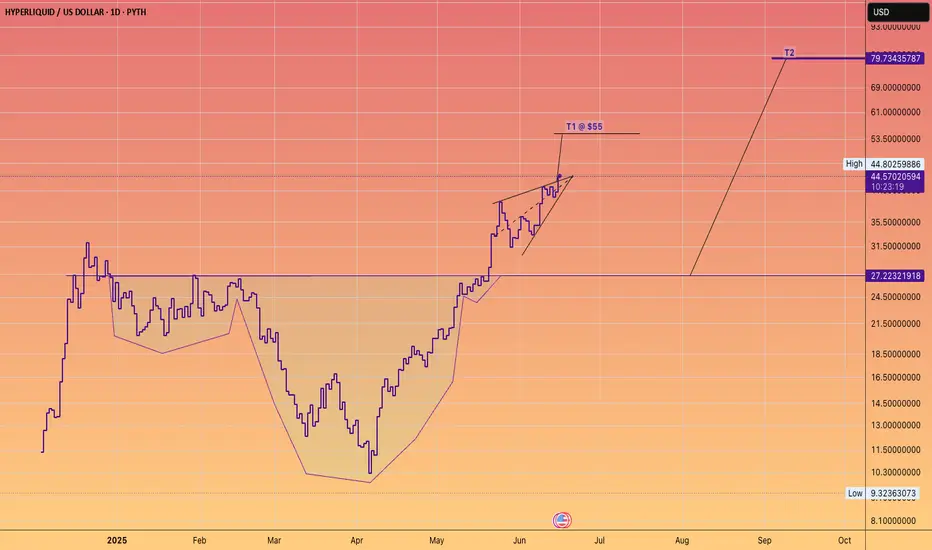
Don't fight the HYPE train!The James Wynn saga was wonderful advertising for the platform.
(Maybe it was staged).
Either way #Hyperliquid goes higher.
SOL/USDT at Key Inflection Point – Breakout or Rejection? Part 2Solana (SOL) is trading at a pivotal zone where price structure, harmonic patterns, and key technical indicators converge. This setup outlines three potential scenarios, guided by Fibonacci levels, auto trendlines, and momentum indicators.
Green Scenario (Confirmed Bullish Continuation)
A sustained hold above $155, especially if followed by a breakout through $156.50 with rising volume, would confirm the green path. This scenario reflects short-term bullish momentum strengthening, as RSI remains near 60 and PVT continues to climb. If confirmed, price may extend toward $160, with secondary targets in the $165–$172 range, aligning with the upper ascending trendline and harmonic extension.
Orange Scenario (Sideways-to-Bullish Consolidation)
This scenario becomes increasingly likely if SOL remains range-bound between $153.50 and $157.80. This consolidation zone overlays the 50–61.8% Fibonacci levels, Bollinger Band basis, and several key trendline intersections. With RSI holding in the 55–65 range and PVT stable, this setup would favor re-accumulation before another breakout attempt. Price action above $155 continues to support this scenario as the base case.
Red Scenario (Bearish Breakdown)
A breakdown below $153.50, especially if followed by a breach of $150 on high sell volume, would invalidate the bullish thesis. This scenario opens downside risk toward $147.35 and potentially $144.00–$140.00. RSI would likely drop below 50, and a flattening or declining PVT would confirm distribution. This path aligns with the broader red trendline and would indicate a rejection of the recent bullish breakout.
Indicators Used:
Bollinger Bands (BB 20, 2)
Relative Strength Index (RSI 14) with moving average overlay
Price Volume Trend (PVT)
Auto-generated trendlines
Harmonic Patterns (ABCD and XABCD)
Fibonacci Retracement and extension levels
Bias:
Short-term bullish if price holds above $155. Market structure, RSI, and PVT favor upward continuation or consolidation. A break below $153.50 would shift the bias toward neutral or bearish.
Strategy Outline:
Bullish if price breaks and holds above $156.50
Targets: $160 / $165 / $172
Bearish if price breaks below $150.00
Targets: $147.35 / $144.00 / $140.00
Scalping opportunity in the $153.50–$157.80 zone while awaiting directional confirmation
**This analysis is for informational and educational purposes only and does not constitute financial or investment advice. Trading cryptocurrencies involves significant risk and may not be suitable for all investors. Always conduct your own research and consult with a licensed financial advisor before making trading decisions. The author is not responsible for any losses incurred from reliance on this analysis.**

LINK MARINES are becoming a dwindling force.It was likely a fabricated tag solely for Crypto Twitter, conceived by early ICO investors. Something to rally a war cry behind.
Similar to the LINK Crypto dominance chart.
There’s a continuation head & shoulders pattern with a logarithmic target indicated.
Indeed, the token might increase in dollar value.
However, with 700 employees to compensate through token sales,
The salaries are excessive given the stagnant growth of token holders, and I must say, the decline in holders over the years makes it difficult to sustain the price/valuations.
If a #DEFI season was to occur, I would probably take advantage and unload old bags into the pumps.

API3 loves to scam pump when DeFi coins runBINANCE:API3USDT
Mini range and trend support holding so far.
— Holding above $0.65–0.70 = base for a squeeze toward $1.40–2.00.
— Flip $1.10–1.20 = mid-term trend shift.
— Main resistance at $2.33, then macro targets $3.2–5.5.
— Lose trend support? Expect new lows inside the channel.
Key level: watch how it acts above $0.65.

UNI to the Mooni - Unleashing Banking into DeFi - Send itUniswap has powered trillions of dollars of exchange volume over the years, but, while its achieved economies of scale, it's been held back from mainstream use and value accrual due to the existing banking system's de facto and now uncovered to be de jure prohibition on interaction and SEC's systematic administration by enforcement campaign to destroy on-chain freedom of choice in the new digital exchange economy.
How big does it in the age of when the President of the USA has launched his own coin? Now that every bank in the world is about to "plug-in" to our Matrix?
Bigger than you can possibly imagine. That's the answer old boy.
But first, send it to $35.
That's a Livermore Accumulation Cylinder by the way

Bitcoin’s Decentralization Is a Fairy TaleBitcoin was born as a revolutionary, decentralized currency, promising financial freedom and independence from traditional banking systems. Yet, as we analyze its real-world distribution, it becomes clear that Bitcoin’s decentralization is more myth than reality.
🔍 The Illusion of Decentralization
Bitcoin operates on a decentralized blockchain, meaning no single entity controls the network. However, when we examine who actually owns Bitcoin, we see a highly concentrated wealth structure that mirrors traditional financial inequality.
📊 Bitcoin’s Wealth Concentration
The top 0.01% of Bitcoin wallets control over 37% of total supply.
The top 1% of Bitcoin holders control over 40% of Bitcoin.
The top 2% of Bitcoin wallets control over 95% of total supply.
The bottom 98% of wallets hold less than 5% of Bitcoin.
The bottom 50% of wallets hold less than 0.03% of Bitcoin.
10,000 Bitcoin investors own 5 million BTC, worth $230 billion.
Institutional investors and early adopters dominate Bitcoin ownership.
This means that a tiny fraction of wallets dominate the entire market, while millions of small holders own completely insignificant amounts.
💰 Bitcoin vs Traditional Wealth Inequality
Bitcoin was supposed to be more equitable than traditional finance, but its wealth distribution is even more extreme than global financial inequality.
Bitcoin’s wealth gap is far worse than traditional financial inequality, proving that decentralization does not mean fair distribution.
📉 How Did Bitcoin Become So Centralized?
1. Early Adopters Accumulated Massive Holdings
Bitcoin’s first miners and tech-savvy investors acquired BTC when it was nearly worthless.
Many of these wallets still hold huge amounts, making redistribution difficult.
2. Institutional Investors Took Over
Hedge funds, exchanges, and corporations now control a massive portion of BTC.
Bitcoin ETFs and custodial wallets concentrate ownership even further.
3. Lost & Dormant Bitcoin Shrinks Circulating Supply
An estimated 29% of Bitcoin is lost or inactive, meaning fewer coins are available.
This makes the remaining BTC even more concentrated among active holders.
🚨 The Harsh Reality: Bitcoin Is Not Financial Freedom
Bitcoin was supposed to empower individuals, but in practice, it has become a playground for the wealthy.
Decentralization in theory ≠ decentralization in reality.
Institutional investors and exchanges hold a massive portion of BTC.
Bitcoin’s fixed supply (21 million BTC) makes redistribution nearly impossible.
Bitcoin is not the democratized financial system it was promised to be—it’s just another asset class where the rich get richer.
NASDAQ:MSTR NYSE:CRCL NASDAQ:COIN TVC:GOLD TVC:SILVER INDEX:BTCUSD NASDAQ:TSLA TVC:DXY NASDAQ:HOOD NASDAQ:MARA

TradeCityPro | TON: Eyes Breakout from Daily Range Top👋 Welcome to TradeCity Pro!
In this analysis, I’m going to review the coin TON for you. The TON project is developed for Telegram and operates on a Layer One blockchain, enjoying significant popularity within the Telegram community.
✔️ The coin currently has a market cap of 7.95 billion dollars and ranks 18th on CoinMarketCap.
📅 Daily Timeframe
On the daily chart, as you can see, there’s a range box formed between the levels of 2.851 and 3.513, and price is oscillating between these two zones.
⚡️ I’ve marked the top of the box as a zone as well. This is a major supply zone, and a breakout above it could trigger a bullish trend.
🧩 Personally, I’m watching this coin closely. If buying volume enters and the trigger is activated, I’ll either enter a long position or buy it in spot.
📈 For a long position, the breakout of the 3.513 zone that I marked seems appropriate. If this zone breaks, we can open a long position.
🔍 The target for this position can be set around 4.123. This level is also a good spot trigger. If we enter a long at 3.513 and price moves up to 4.123, we can use the profit from the futures trade to buy this coin in spot.
✨ This way, we’ll have purchased a reasonable amount of the coin using profits, without needing any unusual risk or capital management because the capital was already managed beforehand.
📊 There’s also an ascending trendline visible on the chart that the price has responded to well. If the price gets rejected from the 3.513 zone and breaks this trendline, we can open a short position once the trendline trigger is activated, targeting the 3.024 and 2.851 levels.
📝 Final Thoughts
This analysis reflects our opinions and is not financial advice.
Share your thoughts in the comments, and don’t forget to share this analysis with your friends! ❤️

DEFI altcoin - The Trump Crypto ConnectionThe relationship between decentralized finance (DeFi), the Trump family, and Kevin O’Leary in 2025 centers around their public involvement in the crypto and blockchain space, particularly highlighted by their participation in events like DeFi World 2025 and specific DeFi projects tied to their names or influence.
The Trump family, notably Donald Trump Jr. and former President Donald Trump, has increasingly engaged with DeFi and cryptocurrency. Donald Trump Jr. spoke at the DeFi World 2025 Conference in Denver on February 26, alongside Kevin O’Leary, signaling a growing interest in blockchain’s potential to shape finance. Posts on X from DeFi confirm their appearances, with Trump Jr. scheduled at 3:00 PM and O’Leary at 3:45 PM, reflecting a shared platform to promote DeFi’s future. Beyond this event, the Trump family is linked to World Liberty Financial (WLFI), a DeFi project launched in September 2024. WLFI aims to democratize crypto lending and borrowing while reinforcing the U.S. dollar’s dominance, operating on Aave’s v3 protocol.
Kevin O’Leary, a Canadian investor and “Shark Tank” star, has been a vocal DeFi advocate since at least 2021, when he invested heavily in DeFi Ventures (later renamed WonderFi), targeting 4.5–8% yields on crypto assets. His participation in DeFi World 2025 alongside Trump Jr. underscores his ongoing commitment. O’Leary sees DeFi as a way to bypass financial middlemen, predicting it could transform trading within years. His practical involvement contrasts with the Trump family’s more symbolic and policy-driven engagement, though both share a bullish stance on crypto’s future.
Fully diluted Market Cap of only $2.64Mil.

TradeCityPro | ATOM: Major Support Test in Cosmos Ecosystem Coin👋 Welcome to TradeCity Pro!
In this analysis, I’m going to review the ATOM coin for you. This project is part of the Osmosis network ecosystem.
🔍 ATOM, with a market cap of $1.68 billion, is currently ranked 51st on CoinMarketCap.
📅 Daily Timeframe
As you can see in the daily timeframe, ATOM is currently sitting on a very significant support zone. It has tested this area multiple times, and once again, it’s hovering around that level.
⭐ If the price finds support here and begins to move upward, we can consider entering a long position with a trigger at 4.588. The main bullish trigger will be the 5.380 level, and if that breaks, spot buying can also be considered.
✨ As I always mention with spot triggers on altcoins, it’s best to wait for Bitcoin dominance to start declining before entering. If that happens, ATOM could potentially move toward targets at 7.514 and 10.4.
⚡️ If the key support at 4.075 breaks, we can open a short position targeting 3.501. The 35.68 level on the RSI is a critical support, and a break below it would serve as a momentum confirmation.
📊 Also, keep an eye on market volume. It has been declining recently, and once volume starts flowing in on either side, we can prepare to act on the corresponding trigger.
📝 Final Thoughts
This analysis reflects our opinions and is not financial advice.
Share your thoughts in the comments, and don’t forget to share this analysis with your friends! ❤️

TradeCityPro | APT: Triangle Squeeze Near Crucial Support Zone👋 Welcome to TradeCity Pro!
In this analysis, I’ll be reviewing the APT coin. The Aptos project is one of Ethereum’s Layer 2 solutions.
✔️ This project’s token currently holds a market cap of $3.1 billion and ranks 32nd on CoinMarketCap.
📅 Daily Timeframe
On the daily chart, you can see a very strong support level at 4.718, which has been tested multiple times. The price has once again reached this zone.
💥 A descending trendline can also be drawn, showing clear reactions from the price. The area between this trendline and the 4.718 support forms a triangle pattern.
⭐ If the 4.718 support breaks, a short position could be considered. A breakdown below 37.78 on the RSI would serve as strong confirmation of bearish momentum.
📉 The initial target for the short would be 4.338. However, if a new bearish leg forms and the market heads toward lower lows, a drop toward the 3.12 support level is also possible.
📊 Confirmation of a bullish reversal would come from a breakout above the descending trendline. If this trendline is broken and the 6.152 trigger activates, it would justify opening a long position or even buying in the spot market.
🛒 When it comes to spot purchases, the most important factor is a trend reversal in Bitcoin dominance. Personally, I do not buy any altcoins on spot until Bitcoin dominance shifts downward on the daily chart — I only trade them in futures.
📝 Final Thoughts
This analysis reflects our opinions and is not financial advice.
Share your thoughts in the comments, and don’t forget to share this analysis with your friends! ❤️

CETUS Hack Giving Opportunities Within SUICRYPTOCAP:SUI SUI is one of the fastest growing L1 chains. Previously extreme intra SUI dominance within swapping volume by KUCOIN:CETUSUSDT CETUS. This hack is a direct threat to the confidence of not just the application but the chain itself just like Ethereum was exposed during the MakerDAO hack.
Volume market wants to know their funds are secure to certain degree and predictable. Volume flow is more than fine with centralisation, esp with low barriers. Should the deposits be mostly secured and exploit fixed then it can bring confidence roaring back not just to CETUS but more importantly, SUI.
CETUS dominance within SUI is falling to rising applications. My favourite is Bluefin with its low barriers to account creation like google login. KUCOIN:BLUEUSDT BLUE has rising dominance within SUI volume market.

TradeCityPro | CORE: Watching Trendline and RSI for Next Move👋 Welcome to TradeCity Pro!
In this analysis, I’ll be reviewing the CORE token. This project is one of the DeFi infrastructure developers for Bitcoin and also runs its own Layer 1 blockchain.
💥 The token currently holds a market cap of $826 million and is ranked 86th on CoinMarketCap.
⏳ 4-Hour Timeframe
As seen on the 4-hour chart, CORE is in an uptrend supported by an ascending trendline, with price consistently moving higher along it.
✅ In the last bullish leg, price only managed to retest the previous high around 0.8727 and is now undergoing a pullback.
⚡️ This shows signs of weakness in the bullish momentum. If the price fails to close above 0.8727 and drops back to the trendline, the risk of a trendline breakdown increases.
🔍 There’s also the potential for price to form equal highs and higher lows, forming an ascending triangle, which would favor a bullish breakout scenario.
🔑 Watch the RSI oscillator closely. Historically, every time RSI reached the 70 zone during a bullish move, the trend topped out and reversed. So if RSI manages to break above 70 this time, it could trigger a much stronger bullish leg.
📈 For a long position, potential entries include a breakout above 0.8727 or a bullish bounce off the ascending trendline.
🔽 For a short position, the first trigger would be a break of the trendline and activation of the 0.7560 support zone.
📝 Final Thoughts
This analysis reflects our opinions and is not financial advice.
Share your thoughts in the comments, and don’t forget to share this analysis with your friends! ❤️

$COOK+$MNT: Low risk buy + airdrop + yieldNYSE:COOK and TSX:MNT are DeFi gems with strong upside. NYSE:COOK governs mETH Protocol (TVL: $2.19B, 4th-largest ETH staking platform), TSX:MNT fuels Mantle L2 ( SEED_TVCODER77_ETHBTCDATA:3B TVL, 29% address growth, 44% new users).
With Methamorphosis Season 3 (until Sep 22, 2025) airdropping 250M COOK via Powder points and the Cook feast rewarding holders, you should not miss out on these.
Ways to farm farm S3 :
*Stake mETH/cmETH (0.02 ETH min, 10 Powder/day per mETH)
* Lock TSX:MNT , or engage with dApps (e.g., Karak, Pendle).
Best of luck!
Cheers,
Ivan Labrie.

TradeCityPro | S: Trendline Break Signals Key Support Retest👋 Welcome to TradeCity Pro!
In this analysis, I’m going to review the S coin—one of the Layer 1 coins for the Sonic network.
💥 This coin currently holds a market cap of $1.43 billion and ranks 58th on CoinMarketCap.
⏳ 1-Hour Timeframe
On the 4-hour chart, as you can see, there’s a large range box between the 0.3939 and 0.6147 levels where price has been moving sideways.
🔍 A key support zone also exists between 0.45 and 0.46, which has received strong bullish reactions, pushing the price upward toward the 0.6147 top via a trendline.
✔️ Currently, this trendline has been broken, and a new support level has formed at 0.4888, which has been tested several times.
✨ If this 0.4888 level breaks, a short position targeting the 0.45 zone and 0.3939 becomes viable.
📈 For a long position, the first trigger is the 0.5266 level. A breakout here would confirm support at 0.4888 and open the path toward the 0.6147 resistance.
🎲 The RSI oscillator is hovering near the 50 level. A sustained move above this could increase the likelihood of the bullish scenario playing out.
📝 Final Thoughts
This analysis reflects our opinions and is not financial advice.
Share your thoughts in the comments, and don’t forget to share this analysis with your friends! ❤️

Chinlink market on 19/May/2025Chainlink is playing at Order Block zone and after retest Order Block zone. It will visit (17$ - 18$). When it break this level, it will claim to (19$ -20$) to r claim it bull trend.
