The Bitcoin BounceBitcoin is clearly showing signs of an uptrend. Her highs and lows have steadily increased giving great opportunities for short term swings.
Currently, she has pulled back to 23,200. If she can stay above 22,400 and close bullish this could be another great time to buy.
You may question what timeframe I'm entering on. Or, how long will I hold the trade or what my stop loss will be.
Let me be quick and simple.
#1 I'm trend trading here. I'm going to trade with the flow of the uptrend hence why I am looking for a buy.
#2 I'm taking profits on the way up back to the highs and further.
#3 My stop loss will be located in an area where if price reverses I reverse with it.
Lastly, I'll enter on the daily timeframe because this is where I analyzed this setup.
I hope that was easy to follow. Speaking of following, be sure to follow me here on Tradingview.
Now go be great. Go on now!!!
DEFI

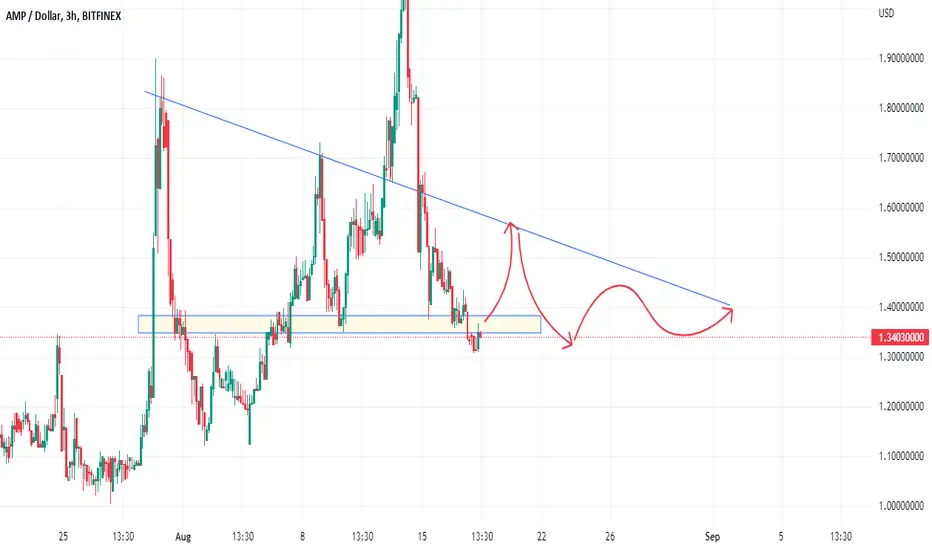
AMP defi Bitfinex forecast and ideaPlease write any advice or suggestions.
Dear friends, request any cryptocurrency pair, currencies pair for forex, and any index that you want to be analyzed and ask any questions.
Thanks for your attention
August 17 BTCUSD BingX Chart Analysis and Today's HeadlineBingX’s Bitcoin Chart
According to Glassnode, the Number of Ethereum addresses in profit (7d MA) just reached a 3-month high of 5224410.732. Bitcoin is almost flat over the past 24 hours. The largest cryptocurrency attempted to sustain above the psychological resistance at $25,000 for the past three days, but the price could not sustain the higher levels, indicating a loss in upside momentum. If the bears push the price below the 20-day EMA ($23,512), the BTC/USDT pair could find support at $22,000.
Today’s Cryptocurrency Headline
Aave Says On-Chain Wallet Address Censorship will Require DAO Consensus
DeFi lending protocol AAVE stated that wallet monitoring due to government sanctions cannot be implemented at the smart contract level unless the community agrees. Aave said: “As for on-chain, contract-level as it applies to the Aave Protocol, the Aave smart contracts are decentralized — no one person or entity can change, control, update or shut down the protocol. For any change to occur to the protocol, an AIP would have to be proposed, voted on, and approved by the Aave DAO.” The DeFi lender also clarified that the recent block on wallet addresses with indirect Tornado Cash interactions only occurred on its front-end app.
Disclaimer: BingX does not endorse and is not responsible for or liable for any content, accuracy, quality, advertising, products, or other materials on this page. Readers should do their own research before taking any actions related to the company. BingX is not responsible, directly or indirectly, for any damage or loss caused or alleged to be caused by or in connection with the use of or reliance on any content, goods, or services mentioned in the article.

LINA USDT About Linear Finance
Linear Finance is a cross-chain compatible, decentralized delta-one asset protocol that allows users to get synthetic exposure to various assets, including cryptocurrency, commodities, and market indices. Users can utilize our cross-chain swap functionality to instantly swap assets across leading blockchain environments and DeFi protocols with unlimited liquidity and zero slippage.

$ETH/USD 1W (#Coinbase) Huge rising wedge on supportEthereum is falling sharply while RSI is printing new ATL, time to be opportunist and place some juicy bids on 300MA and below!
Current Price= 1030.88
Buy Entry = 915.64 - 739.86
Take Profit= 1265.98 | 1632.40 | 1998.81
Stop Loss= 534.62
Risk/Reward= 1:1.5 | 1:2.75 | 1:4
Expected Profit= +52.94% | +97.21% | +141.47%
Possible Loss= -35.41%
Fib. Retracement= 0.236 | 0.382 | 0.5
Margin Leverage= 1x
Estimated Gain-time= 1 year
Tags: #ETH #ETHUSDT #WETH #Altcoin #PoW #Eth2 #PoS #Governance #SC #DApp #DeFi
Website: ethereum.org
Contracts:
#Mainnet
#ERC20 0xc02aaa39b223fe8d0a0e5c4f27ead9083c756cc2
#BEP20 0x2170ed0880ac9a755fd29b2688956bd959f933f8
#BEP2 ETH-1C9
#AVAXC 0xf20d962a6c8f70c731bd838a3a388d7d48fa6e15
#SPL 2FPyTwcZLUg1MDrwsyoP4D6s1tM7hAkHYRjkNb5w6Pxk

Trading opportunity for DYDXUSDTBased on technical factors there is a Long position in :
📊 DYDXUSDT
🔵 Long Now 2.370
🧯 Stop loss 2.080
🏹 Target 1 2.720
🏹 Target 2 3.100
🏹 Target 3 3.750
💸Capital : 1%
We hope it is profitable for you ❤️
Please support our activity with your likes👍 and comments📝

Trading opportunity for UNIUSDT UniswapBased on technical factors there is a Long position in :
📊 UNIUSDT Uniswap
🔵 Long Now 9.41
🧯 Stop loss 7.45
🏹 Target 1 11.60
🏹 Target 2 13.90
🏹 Target 3 16.10
💸Capital : 1%
We hope it is profitable for you ❤️
Please support our activity with your likes👍 and comments📝

Slowly but so strongOn daily chart
BINANCE:UNIUSDT has broken the resistance at 6.0 and went up to 9.6.
Next target at 12.25 with fibo clusters
+ 0.5 Fib Retracement of higher wave
+ 1.618 Fib Extension at 3.3
* Key Level at 12.25
* Invalidation Level at 12.25
Let's wait and see

BITCOIN - Comeback ? - • Sentiment is slowly improving in the markets, benefiting cryptocurrencies
• Bitcoin advancing slowly since the start of the 3rd quarter
• Series of higher lows and higher highs
• Ascending channel on daily chart
• Bulls need to break the 24700 level to confirm the higher highs pattern
• Second resistance to break is 26600

#HEX primed to pump! Heading to 7.6 cents. A near 50% Move!Bullish Hunt Volatility Funnel has formed.
The slow grind up is turning into Bullish upward pressure being built.
Expect a quick rise into the 7 cent area.
@TheCryptoSniper

Bitcoin next mouvementVoici selon moi les prochains mouvement du btc qui ira toucher pour la troisième fois la trendline descendante

#MKR to $1700. #Maker is forming a cup and handle...A little lopsided
But the bottoming principle of the pattern is still evident
Could be an accelerative move incoming.
Post #LUNA and #Celsius #Defi has shown considerable strength
And looks to continue upwards.

XTZTo understand XTZ & EOS is to understand zombie blockchain theory. Last year AVAX SOL ATOM where the winners against ETH via the defi pump where XTZ & EOS were to ETH back in 2017-2018 winners because they were competing vs ETH for smart contracts.
But since then there has been no FA news no developments. While ETH AVAX SOL ATOM ADA are constantly growing. So moral of the story is this coin will stay Zombified until either FA comes out or not.

$STX/BTC is about to explodeBuying volume is increasing and Bollinger Bands are really tight, and that means it's getting volatile.
STX is currently trading in my buying zone for 3 months. It's the 0.618 en 0.65 Fibonacci retracement from the last impulsive wave 1.
From Stacks' market history, it can be seen that stacks has a habit of showing explosive price rises.
As Bitcoin continues to move between 20k-24k and loses market dominance, it seems that this will give room for sats to rise significantly in value.
My expectation is that the 0.382 Fib will be a first point of resistance (2764 sats). Seen from the current price, this is a 45% increase in sats value.

#DEFI, On the edge of a bigger move #DEFI
On the edge of a bigger move
Attempting to break above the range that was established over the previous three months
UCTS is already bullish on lower timeframes and is signaling a 2D buy
⏳

Inverse H&S Formation?You can see an inverse H&S chart pattern is forming in DFI/USDT. We have broken the EMA 17 and SMA 30 already to the upside - the SMA 50 could offer a bit more resistance at currently 1.30 USD.
For me it seems like the crypto market could reverse (see also the BTC/USD chart) - not to approach the ATHs but to make a first move to the upside. We'll see.

Long SUSHI vs USDTDefi coins are looking good short to mid term so I'm going to take a long on SUSHI if it successfully breaks $8. We can see that every time it broke out and retest $8, it went at least to $15.
We'll see how things turn out later. If this is just a bounce or if the Defi sector has bottomed out...
So playing here the range, mid range T1 at $15, range high is T2 which is ATH for SUSHI at $23. If ATH breaks, then I will look for new targets.

Long Aave vs USDAave is one of the Defi bluechips and it's always leading the way for Defi coins. Fundamentaly a very strong coin.
Entered yesterday on the retest of the weekly level at $211 and if we are going to see a Defi season again, Aave should fly.
It made nice move up to $300 and it corrected that move yesterday IMO. So it should continue up now.
Good R:R for a long.

$BTC (Bitcoin) - Long-Term - AnalysisThis my personal opinion of what I anticipate Bitcoin doing. After completion of Supercycle Impulse Wave (I), we are expecting Supercycle Corrective Wave (II) to complete and bottom out somewhere around the range of $11k to $1k.
My analysis consists of Elliot Wave, Institutional Points of Interest, and anything technically relevant.

Inverted head and shoulders on farm coinLow mc and very very low max supply of 490k due to some token burns I see this coin x20 from here and trading at 5k a coin and 1k coin within months

ETH Weekly TA BullishETHUSD Weekly bullish. Recommended ratio: 95% ETH, 5% Cash. *Cryptos took a brief dip yesterday after news that Tesla had sold 75% of their Bitcoin holdings (~$936m) due to fears of China's Covid lockdowns (Tesla has a Gigafactory in Shanghai) and a need for cashflow. This came as a shock to the crypto community because in 2021 Elon tweeted that "Tesla has diamond hands". Ethereum is now up 86% from the local bottom ($875) on 06/13, and is now down 66% from its ATH ($4800) compared to being down 82% on 06/13. With the Merge currently scheduled for a September launch (~09/12/22) , this should continue to drive ETH higher in a "buy the rumor, sell the news" type of long trade. DXY appears to be undergoing a bearish correction, adding bullishness to money markets as Cryptos, Equities, the Euro and Gold are seeing a pick up in buying pressure. The ECB also raised their central bank interest rate for the first time in 11+ years by 50bps, it is now 0% amidst rising inflation; compared to how the Fed has responded to inflation, this rate hike was dainty considering the looming energy crisis due to Nord Stream's reduced capacity going forward for 2022.* Price is currently attempting to break above $1408 resistance with hopes of flipping it to support; this is after defending a crucial support at the uptrend line from June 2020 (which coincided with the 200 MA) at ~$1200. Volume is currently Moderate (high) and on track to favor buyers for a third consecutive session if it can close this week's session in the green, this is bullish! Parabolic SAR flips bullish at ~$3350, this margin is bullish! RSI is currently trending up at 38 with no sign of peak formation as it test 37 resistance. Stochastic remains bullish and is currently trending up at 33 with no signs of peak formation as it tests 27 resistance, the next resistance is at 52. MACD remains bearish and is currently trending up at -500 as it attempts to complete a trough formation, if it can cross above -420 it would be a bullish crossover (and the first time MACD would be bullish since before December 2021). ADX is currently trending sideways at 33 as Price pushes higher, this is neutral at the moment. If Price is able to close above $1408 resistance in this session and next, it will likely test $1944 resistance before the Merge. However, if Price breaks back down below $1408 resistance (still resistance until Price reclaims support) , it will likely retest the uptrend line from June 2020 at ~$1200 before potentially heading lower to retest $1k psychological support. Mental Stop Loss: (one close below) $1200.

ETH Daily TA Cautiously BullishETHUSD Daily cautiously bullish. Recommended ratio: 85% ETH, 15% Cash. *MINOR CORRECTION WATCH. Ethereum continues to rally (and should continue to leading up to September) on news that the Merge is likely to be ready for launch on Mainnet 09/19/22. Cryptos continue rallying as Equities are entering a big earnings season and recession fears are being allayed by Putin saying Russia will reopen the Nord Stream pipeline (albeit potentially at lesser capacity) . Yesterday, Congress passed the CHIPS for America Act granting $52b in government subsidies to advance the semiconductor industry in the USA, this briefly boosted chip and tech stocks. Though this still qualifies as a long overdue technical relief rally, it's important to note that Ethereum has reclaimed support of the descending channel from October 2021; because of this it's technically unlikely for ETH to retest $1k until after August if it were to.* Price is currently forming a Bull Flag as it trends down at $1500 after briefly touching $1600, the next resistance (minor) is at $1711. Volume remains Moderate (high) and is currently on track to favor sellers for a second consecutive session if it closes today's session in the red; this would increase the odds of a minor correction to $1427. Parabolic SAR flips bearish at $1127, this margin is mildly bearish at the moment. RSI is currently trending down at 63 after forming a peak at 69 (just below the 50/50 uptrend line from November 2018), the next support is the descending trendline from February 2020 at 55 support. Stochastic remains bearish for a second consecutive session as it trends down at 92, the next support is at 81. MACD remains bullish and is currently trending up at 52 with no signs of peak formation as it continues to make a strong case for flipping 28 resistance to support. ADX is currently trending up slightly at 31 as Price pushes higher, this is mildly bullish. If Price is able to continue up here without touching $1427 first, it will likely test $1711 minor resistance (which will be a critical resistance). However, if Price isn't done completing the Bull Flag, it will likely test $1427 support . Mental Stop Loss: (one close below) $1321.

Another Alt breaks on the weeklyJASMYUS is the second alt to make a significant break on the weekly.
There are some really nice defi charts that have gotten completely crushed. This is the first one I have noticed with decent trading volume to make a risk conscious break... others could soon follow (DAPPT, POWR, IDEX, SUKU). The best case scenario is for BTC to break last week's highs... that will give crypto some much needed fuel to push out of these ultra depressed levels.
Much like the Tezos (XTZ) from last week, this is a great place to buy JASMYUS for the long term... plus has enormous potential to make huge trade to take a little out for 80%+ limiting your overall downside and hold the rest for the long term.
