$AVAX: Avalanche – Snowballing Gains or Melting Away?(1/9)
Good evening, everyone! 🌙 CRYPTOCAP:AVAX : Avalanche – Snowballing Gains or Melting Away?
With AVAX at $23.07, is this blockchain beast a sleeper hit or a slippery slope? Let’s avalanche into it! 🔍
(2/9) – PRICE PERFORMANCE 📊
• Current Price: $ 23.07 as of Mar 25, 2025 💰
• Recent Move: Up from $18, below $40 highs, per data 📏
• Sector Trend: Crypto volatile, AVAX rides the waves 🌟
It’s a rollercoaster—hold tight for the drop! ⚙️
(3/9) – MARKET POSITION 📈
• Market Cap: Approx $9.56B (414.78M tokens) 🏆
• Operations: Scalable L1 for DeFi, dApps, subnets ⏰
• Trend: $1.121B DeFi TVL, whale buys, per posts on X 🎯
Firm in L1 race, but market’s a blizzard! 🚀
(4/9) – KEY DEVELOPMENTS 🔑
• Whale Action: 500K tokens moved, per posts on X 🌍
• DeFi Strength: $1.121B TVL holds firm, per data 📋
• Market Vibe: Bearish Fear Index (34), yet resilient 💡
Snowballing quietly amid crypto storms! ❄️
(5/9) – RISKS IN FOCUS ⚡
• Market Correction: Bearish pressure could sink it 🔍
• Competition: Solana, Ethereum vie for dApps 📉
• Macro Woes: Trade tensions, rates shake things ❄️
It’s a chilly slope—brace for ice! 🛑
(6/9) – SWOT: STRENGTHS 💪
• Scalability: 4,500 TPS, beats rivals 🥇
• DeFi Base: $1.121B TVL, solid ecosystem 📊
• Adoption: Enterprise use grows, per data 🔧
Got a snowy peak of potential! 🏔️
(7/9) – SWOT: WEAKNESSES & OPPORTUNITIES ⚖️
• Weaknesses: Volatility, high off $59 peak 📉
• Opportunities: Whale buys, subnet growth 📈
Can it snowball or melt under pressure? 🤔
(8/9) – POLL TIME! 📢
AVAX at $23.07—your take? 🗳️
• Bullish: $30+ soon, whales fuel it 🐂
• Neutral: Steady, risks balance out ⚖️
• Bearish: $18 looms, correction hits 🐻
Chime in below! 👇
(9/9) – FINAL TAKEAWAY 🎯
AVAX’s $23.07 price tags a volatile gem 📈, with DeFi strength but market risks 🌿. Dips are our DCA jackpot 💰—buy low, ride high! Gem or bust?
DEFI

CAKEUSDT (PancakeSwap): Sweet Gains or Stale Trade?(1/9)
Good afternoon, everyone! ☀️ CAKEUSDT (PancakeSwap): Sweet Gains or Stale Trade?
With CAKE at $2.599, is this DEX token a tasty treat or a flat pancake? Let’s flip the details! 🔍
(2/9) – PRICE PERFORMANCE 📊
• Current Price: $ 2.599 as of Mar 25, 2025 💰
• Recent Move: Consolidating $2.6-$2.8, up from $2.34, per data 📏
• Sector Trend: Crypto steady, DeFi mixed amid trade tensions 🌟
It’s a flip-flop—value might be cookin’! ⚙️
(3/9) – MARKET POSITION 📈
• Market Cap: Approx $760M (292M circulating) 🏆
• Operations: Leading BNB Chain DEX, yield farming, staking ⏰
• Trend: Deflationary model burns 102% minted, per data 🎯
Firm in DeFi, but volatility’s the spice! 🚀
(4/9) – KEY DEVELOPMENTS 🔑
• Recent Surge: Up 45% earlier in March, per X posts 🌍
• Platform Updates: Expanded NFT marketplace, per web data 📋
• Market Reaction: High volume ($230M daily), showing interest 💡
Adapting to DeFi trends, cooking up growth! 🍳
(5/9) – RISKS IN FOCUS ⚡
• Regulatory Risks: Crypto scrutiny could hit DEXs 🔍
• Market Volatility: Crypto swings could drag price down 📉
• Competition: Other DEXs like Uniswap challenge, per data ❄️
It’s a risky recipe—watch the heat! 🛑
(6/9) – SWOT: STRENGTHS 💪
• DEX Leader: Top on BNB Chain, strong user base 🥇
• Deflationary Model: Burns tokens, potentially boosts value 📊
• High Volume: $230M daily, per data, shows activity 🔧
Got a sweet spot in DeFi! 🏦
(7/9) – SWOT: WEAKNESSES & OPPORTUNITIES ⚖️
• Weaknesses: Price volatility, regulatory fears 📉
• Opportunities: DeFi adoption, new features like lending 📈
Can it rise or get burned? 🤔
(8/9) – POLL TIME! 📢
CAKE at $2.599—your take? 🗳️
• Bullish: $3+ soon, DeFi booms 🐂
• Neutral: Steady, risks balance gains ⚖️
• Bearish: $2 drops, market sours 🐻
Chime in below! 👇
(9/9) – FINAL TAKEAWAY 🎯
CAKE’s $2.599 price reflects consolidation, with strengths in its platform and deflationary model, but risks from market volatility and competition persist. DCA-on-dips could be a strategy to average in over time, banking on long-term growth. Gem or bust?

Trading opportunity for RONUSDTBased on technical factors there is a Buy position in :
📊 RONUSDT
🔵 Buy Now
🪫Stop loss 0.6950
🔋Target 0.9900
📏 R/R 1,8
💸RISK : 1%
We hope it is profitable for you ❤️
Please support our activity with your likes👍 and comments📝

FireHoseReel " XVSUSDTWelcome to FireHoseReel ! ❤️
Today we're gonna dive into the XVS coin and break down what the project is all about. Stick with us
This coin has shot up 40% after breaking its upward channel, and then it had a solid climb but pulled back 50% because of profit-taking and heavy selling. It created a key demand zone, and a lot of market makers, retail traders, and exchanges have been buying in the $4.70 to $5.30 range. The next targets for this coin could be $11.50 and $12, and we could see a price increase of up to 90% !
XVSUSDT is the trading pair for the Venus token (XVS) against Tether (USDT). Venus is a decentralized finance (DeFi) protocol built on the Binance Smart Chain (BSC) that allows users to borrow and lend cryptocurrencies.
With Venus, users can supply assets to the platform to earn interest or take out loans using their crypto as collateral. The XVS token serves as the governance token for the Venus protocol, allowing holders to participate in decision-making processes related to the platform’s development and operations.
Hope you guys found these analyses useful! Wishing you all the best 🔥 Don't forget about money management and risk management. Love you all, friends ❤️

Trading opportunity for PENDLEUSDTBased on technical factors there is a Buy position in :
📊 PENDLEUSDT
🔵 Buy Now
🪫Stop loss 1.800
🔋Target 2.550
📏 R/R 2
💸RISK : 1%
We hope it is profitable for you ❤️
Please support our activity with your likes👍 and comments📝

Scallop (SCA) Potential 200x Gains by next bull run
Current Market Overview:
Current Price: $0.07
Market Cap: $8M
Target Market Cap: $200M+
Potential Growth: 25x - 200x
Showing strong accumulation signals, indicating that most weak hands have already exited. With whales now in control, the price action suggests an imminent breakout in the coming bull run.
Key Observations:
✅ Deep Accumulation Phase: The price has been suppressed for a long time, suggesting all early holders have been flushed out.
✅ Whale Accumulation: With fewer retail traders, whales can now dictate price action, leading to a controlled rally.
✅ Bull Market Catalyst: If the Bitcoin cycle and altcoin season play out as expected, SCLP could experience parabolic growth.
Price Targets Based on Market Structure:
TP1: $0.25 → Initial breakout level (6.5x from current price)
TP2: $0.60 → Strong resistance (15x)
TP3: $6.00 → Major psychological level (85x)
TP4: $28.00+ → Full bull cycle potential (400x+)
Market Cap Projections:
At $1.75 (25x Growth): ~$200M market cap
At $6.00 (85x Growth): ~$700M market cap
At $28.00 (400x Growth): ~ SEED_TVCODER77_ETHBTCDATA:3B market cap

TradeCityPro | ATOM: Cosmos Trends and Key Resistance Insights👋 Welcome to TradeCityPro!
Today, I'm going to analyze the coin ATOM, part of the Osmosis projects and the Cosmos ecosystem, which is currently ranked 49th with a market cap of $1.8 billion.
📅 Daily Timeframe
In the daily timeframe, as you can observe, after reaching a peak at $10.363, a downward trend started, which continued down to the area of $3.562.
✨ Currently, the price is in a corrective phase, having risen from the low of $3.562, and is moving upward. The last major peak is located at $5.082, and the corrective leg could continue up to this area.
💥 The RSI oscillator has moved above the 50 zone, potentially injecting upward momentum into the market, which could help the price reach $5.082.
🔍 However, there is a strong resistance range between $5.082 and $5.683. As long as the price is under this range, the buying power is weaker than the selling pressure. But if the price breaks through $5.683, it could move higher.
✔️ The next resistance levels are at $7.469 and $10.363, with $10.363 being particularly robust and visible in higher timeframes as well. The main trigger for a spot purchase would be the breakout of $10.363.
⭐ Conversely, if the price rejects from $5.082, the main short trigger would be $3.562. A break below this level could initiate the next downward leg.
📝 Final Thoughts
This analysis reflects our opinions and is not financial advice.
Share your thoughts in the comments, and don’t forget to share this analysis with your friends! ❤️

UniversOfSignals | Ethereum – The Never Ending Bear Trend?👋 Welcome to the UniversOfsignals channel!
Current Market Structure – Bearish Trend Dominates
Ethereum (ETH) is currently in a well-defined downtrend, consistently rejecting imbalance zones (highlighted in blue on the chart). Each time price reaches one of these zones, we see a rejection followed by a move lower. This has been a repeated pattern, confirming that sellers remain in control and that ETH is struggling to gain any meaningful bullish momentum.
The presence of a clear descending trendline further supports this bearish structure, as ETH continues to respect this resistance and fails to break higher. Until we see a strong shift in price action, the trend remains intact, and lower prices are likely.
Rejection of Imbalance Zones – No Bullish Confirmation Yet
The imbalance zones act as strong resistance, and so far, every attempt to push above them has resulted in rejection. This means that until one of these imbalance zones is invalidated (i.e., price breaks and holds above one), we cannot consider any bullish scenario.
Each rejection strengthens the bearish case, reinforcing the idea that ETH is likely to continue making lower lows and lower highs. Unless buyers step in with significant strength and push ETH beyond a key resistance level, the safest approach is to assume that the downtrend will continue.
When Can We Consider a Bullish Scenario?
For ETH to turn bullish, we need to see at least one of the following:
Breakout above an imbalance zone – This would indicate a shift in market structure and potential strength from buyers.
Higher highs and higher lows forming – A sign that momentum is shifting away from the current bearish trend.
Price reclaiming key resistance levels – If ETH can reclaim lost ground and sustain above it, it may indicate a potential reversal.
Until one of these conditions is met, there is no reason to be bullish. Any upside move that fails to break a key resistance should be considered a shorting opportunity rather than a bullish reversal.
Key Bearish Confirmation – Lower Prices Expected
As long as ETH keeps rejecting imbalance zones and making lower highs, the market structure remains bearish. The next downside targets are likely to be the previous support levels, with price potentially dropping towards the $1,600-$1,500 range if selling pressure continues.
The projected red price movement on the chart suggests that ETH could consolidate for a bit before continuing its descent. This aligns with the current trend and price behavior.
Historical Context – ETH at 2-Year Lows
ETH is currently trading at a price level last seen two years ago, reflecting significant weakness. Despite temporary rebounds, price action remains suppressed, and we are not seeing the kind of momentum that would indicate a strong recovery.
While some may view this as a “cheap” buying opportunity, the reality is that ETH is showing no bullish strength in its current price action. Without a confirmed trend reversal, simply being at a low price does not make it a good buy. Catching a falling knife is risky, and it is better to wait for confirmation before considering long positions.
Final Thoughts – Patience is Key
ETH remains in a strong bearish trend, and every rejection confirms lower prices.
No bullish confirmation yet – price needs to break a key level before we consider upside potential.
Expect further downside unless market structure changes.
ETH is at historical low levels, but low prices alone do not mean bullish momentum is coming.
As traders, the best approach is to wait for confirmation and trade with the trend. Until ETH proves otherwise, the bearish structure remains dominant, and downside targets remain in play.
__________________________________________
Thanks for your support!
If you found this idea helpful or learned something new, drop a like 👍 and leave a comment, I’d love to hear your thoughts! 🚀
Make sure to follow me for more price action insights, free indicators, and trading strategies. Let’s grow and trade smarter together! 📈
Also let me know if you want to see a chart of another coin. I will create it for you.

TradeCityPro | ENAUSDT Ready to Go!👋 Welcome to the TradeCityPro channel!
Let's go together to analyze and review one of my favorite coins and DeFi coins that we are likely to have and experience a movement in the coming days
🌐 Overview Bitcoin
Before starting the analysis, I want to remind you again that we moved the Bitcoin analysis section from the analysis section to a separate analysis at your request, so that we can discuss the status of Bitcoin in more detail every day and analyze its charts and dominances together.
This is the general analysis of Bitcoin dominance, which we promised you in the analysis to analyze separately and analyze it for you in longer time frames.
📊 Weekly Timeframe
On the weekly time frame, after we hit the 1.2788 level, which was our ATH, we got rejected from it and engulfed the previous weekly candle.
This was also an exit point or a take profit for us, and after this, it is very logical to withdraw some of our capital, and the reason is that the buyers could not do anything and push the price above this level!
📈 Daily Timeframe
On the daily time frame, but after we followed a parabolic move and its slope reached the end of the road, we were rejected by the important resistance of 1.2788
This rejection caused our parabolic move to end and after its failure, we went for an upward move again, but we were rejected by the resistance and went for the support of 0.7857
After the failure of this support and the pullback to it, we went for a rejection again from this resistance and are currently suffering between 0.3282 and 0.4833, with the difference that there is still more presence of sellers for this event
To buy at risk, you can also make a long position at risk after the level of 0.4833 because we can only be active in DeFi and take our coins to DeFi. Now that we are talking about DeFi, you can in this space Also set the liquidity range of the money and we can exit to activate the spot below the level of 0.3282!
📝 Final Thoughts
Stay calm, trade wisely, and let's capture the market's best opportunities!
This analysis reflects our opinions and is not financial advice.
Share your thoughts in the comments, and don’t forget to share this analysis with your friends! ❤️

Trading opportunity for AEROUSDTBased on technical factors there is a Buy position in :
📊 AEROUSDT
🔵 Buy Now
🪫Stop loss 0.4780
🔋Target 0.5870
📏 R/R 1,5
💸RISK : 1%
We hope it is profitable for you ❤️
Please support our activity with your likes👍 and comments📝

Trading opportunity for QTUMUSDTBased on technical factors there is a Buy position in :
📊 QTUMUSDT
🔵 Buy Now
🪫Stop loss 1.950
🔋Target 2.580
📏 R/R 2
💸RISK : 1%
We hope it is profitable for you ❤️
Please support our activity with your likes👍 and comments📝

Fundamental Analysis on MultiversX (EGLD | from $20 to $3,180?Fun experiment on crypto fundamental analysis —
I asked Grok 3 AI to evaluate MultiversX (EGLD) [ CRYPTOCAP:EGLD ].
It was a long conversation with interesting outputs.
MultiversX received an 8/10 score.
For Grok, it's a top pick for building apps and for mid to long-term investing.
I shared the complete results and logic in my account on 𝕏 ( vinibarbosabr ).
You can find it at highlights , if you want.
The conclusion is that, per Grok, CRYPTOCAP:EGLD could hit:
Medium term (1 to 5 years):
$10 billion to $30 billion market cap @ $318 to $955.
Long term (5 to 10 years):
$50 billion to $100 billion mcap @ $1,590 to $3,180.
Now, let's dive into the analysis!
In summary, Grok evaluated a list of objective and well-documented MultiversX attributes, giving it a score 8 out of 10. The AI said EGLD does not make a good short-term buy, due to poor price action at around $500 million of capitalization, while saying it is a top-pick for mid and long term fundamental investing eyeing a $100 billion market cap.
From a tech perspective, Grok 3 agrees MultiversX is one of the most advanced blockchains to date. When asked if it would have MultiversX among its AI top picks to build a project, the answer was yes.
First, Grok 3, one of the most advanced AI models to date, evaluated eight categories of blockchain fundamental analysis. MultiversX scored 7.875 on average, with the AI rounding it up to 8 out of 10 points.
Scalability got a 9/10 score, considering the fully implemented sharding technology, transactions per second (TPS) capacity, and performance. With 30,000 current TPS on mainnet, a 263,000 TPS achieved on a testnet, and a theoretical capacity superior to 1 million TPS thanks to its adaptive sharding—increasing with demand—MultiversX is one of the most scalable blockchain networks.
Decentralization got an 8/10 score, showing strong decentralization, but with room for improvements. The network has over 5,500 nodes, of which, 3,200 are active validators, losing only to Ethereum (ETH). Notably, MultiversX has a Nakamoto Coefficient of 9 for liveness, meaning nine entities have over 33% of all the nodes.
Speed and Finality got an 8/10 score, with sub-second finality in the roadmap for 2025, currently taking 6 seconds. The improvement, according to Grok AI, would put EGLD transactions among the fastest layer-one (L1) blockchains.
Security got an 8/10 score, with its proof of stake architecture, ESDT tokens being native assets, and onchain 2FA. Yet, the model warns against possible stake accumulation above the 51% threshold as a potential risk for the future. Which is the same risk for all blockchain networks’ security.
Cost and Accessibility got a 9/10 score, due to approximately $0.002 cost per transaction, below the industry’s average. MultiversX tech stack also offers developers the possibility to offer gasless (no fees) transactions to the end user. Still in accessibility, the chain has one of the lowest hardware requirements for its capacity in the space, which also contributes to decentralization.
Developer Experience (DevX) got a 9/10 score, with a top-down focus on development and a grassroots “build” culture. MultiversX offers familiar tools like Rust framework and WebAssembly, flexibility in programming languages, and a strong open source ethos. Comprehensive documentation and an active community further support developers, making it attractive for building applications and smart contracts.
Ecosystem and Adoption got a 7/10 score, as a small ecosystem’s size and adoption relative to larger blockchains could limit its current reach and utility. Still, the ecosystem is growing, together with implementations and partnerships, having big names associated with EGLD.
Economic Model (Tokenomics) got an 8/10 score, considering a capped EGLD supply, with full distribution by 2030. Moreover, Grok AI mentions a 30% network fees going to the developer of the used smart contract, incentivizing builders.
All things considered, we asked Grok 3 AI what would be the ideal market cap for EGLD, MultiversX base token. Notably, Grok was considering a $565 million capitalization, ranked 95 in CoinMarketCap, trading around $20 per token.
Based on fundamental analysis, a comparison with other leading blockchains at higher ranks, would put MultiversX among them, Grok said. This, however, looking at the mid and long term, as the market would need time to adjust accordingly.
For the medium term (one to five years), the AI predicts EGLD could reach a market cap between $10 to $30 billion, positioning the cryptocurrency next to Cardano (ADA), Polkadot (DOT), and Avalanche (AVAX).
For the long term (five to ten years), Grok is even more bullish, siding MultiversX with Solana (SOL) and Ethereum. In this case, EGLD could reach between $50 to $100 billion market cap.
In conclusion, Grok AI agrees that MultiversX is one of “the most technically advanced blockchain today.” It has achieved a remarkable fundamental analysis score and offers an interesting investment opportunity for mid and long-term investors.
Furthermore, it features among one of the AI’s top picks of decentralized infrastructures to build applications and smart contracts.
Nevertheless, investing is risky and fundamental analyses can often be complex and highly nuanced. Investors and builders should do proper research and due diligence before making important decisions. The short-term for EGLD is also risky, as mentioned by Grok in the analysis.

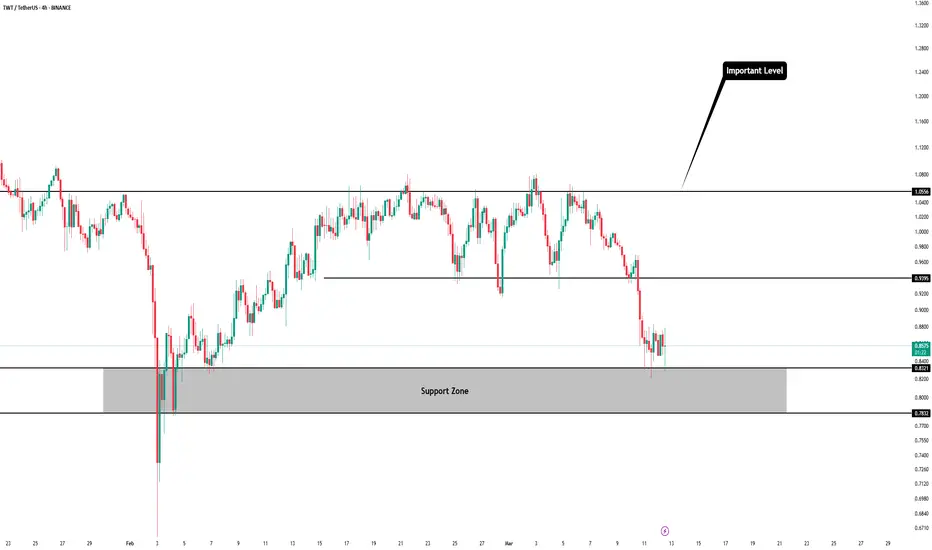
univers Of Signals | TWT: Navigating Trust Wallet's Market Moves👋 Welcome to univers Of Signals !
In this analysis, I'll be reviewing the TWT coin, a part of the Trust Wallet project, which is currently ranked 126th on CoinMarketCap with a market cap of $358 million.
📅 Daily Timeframe
As you can see in the daily timeframe, we're observing a very large range box from 0.7832 to 1.5725, where the price is currently near the bottom of this box.
✅ The floor of this box is a significant support range from 0.7832 to 0.8321 and is acting as a demand zone for the price.
🔽 Currently, the price has reached the 0.8321 area, tested it once with a shadow, and received support from it. If this area breaks, we'll enter the support zone, and we'll need to see how the price reacts to this zone.
📊 The market volume is very low, and for now, it seems there isn't enough strength and momentum in the market to break this area, but if a selling volume enters the market and the RSI goes into oversell, the likelihood of breaking this area increases. In this case, the next support will be at 0.6215.
🛒 For buying this coin, I recommend waiting until it exits the range box it has created, as this would indicate upward momentum entering the market. Currently, there is no momentum in the market. Thus, the best trigger from my perspective is the breakout at 1.5725.
📈 However, for a long position or a risky spot purchase, you could enter upon the breakout of 1.0556. I mainly consider this trigger for futures, and for spot purchases, I would wait until the main resistance is broken.
⏳ 4-Hour Timeframe
In the 4-hour timeframe, as you see, we had a box between 0.9395 to 1.0556, which has been cleanly broken from below, and you could open a short position with price consolidation below this area.
💥 Currently, the price has reached the next support at 0.8321 and has shown some reaction. The RSI is currently in oversell, and if it receives support from this area, it could return to the normal range.
📉 For short positions, the triggers at 0.8321 and 0.7832 are suitable. The 0.8321 trigger is riskier, and I suggest waiting until the 0.7832 support is lost before opening a more secure position.
🔼 For long positions, there's a very suitable ceiling at 1.0556, and breaking this area could lead to opening a long position.
📝 Final Thoughts
This analysis reflects our opinions and is not financial advice.
Share your thoughts in the comments, and don’t forget to share this analysis with your friends! ❤️
Bitcoin Uptrend Continuation AnalysisQuick analysis of BTCUSD downside targets. Remains to be seen whether the near-term Bitcoin lows will hold, but if they don't, a "bear trap" setup could be in play. There's a daily demand zone (77075-74305) wedged between the 50% and 61.8% Fibonacci retracements. The bear trap will be dependent on momentum, but watch this area if we get a flush below 78180. If bullish divergences form, bulls could look to trap bears and buy within said range.
That said, keep the focus on longer-term charts. Larger timeframe buy zones are ~70K. Should the weekly RSI take a dive < 40, look for reversal signals on smaller timeframes before getting long. The high of the corrective segment denoting ideal buys is 73808 and the anchor low securing the long-term uptrend is 49351. Entries within that range, which is wide, are viable. Also multiple support/resistance "flip zones" in play circa the abovementioned levels.
Bitcoin found some support ~50% Fib retrace, anchored VWAP, and sub-daily demand. It could hold here (trying to put in a intraday higher low as I type this), but I'm hoping it trades lower before higher.
Godspeed!
JHart

(TOTAL) total crypto mcap "candles on record [history"worst red candles on record in the past four years and various progresses of positive growth measured from lowest in between points.

TradeCityPro | Deep Search: In-Depth Of Uniswap👋 Welcome to TradeCity Pro
Today, we have a Deep Research on the Uniswap project. In this analysis, I will fully review this project. First, let's go over the project's details, and then I'll analyze UNI technically.
🔍 What is Uniswap?
Uniswap is a decentralized exchange (DEX) operating on the Ethereum blockchain that allows users to swap ERC-20 tokens without relying on traditional order books. Instead, it uses an Automated Market Maker (AMM) model, where liquidity providers add funds to pools and earn trading fees.
Uniswap was founded by Hayden Adams and launched in 2018. Since then, it has gone through multiple upgrades, with Uniswap V3 being the most recent version, offering improved capital efficiency.
🗝 Key Features:
Decentralized & Permissionless: No central authority controls trading.
Liquidity Pools: Users provide liquidity and earn a share of trading fees.
AMM Model: Uses the x*y = k formula to maintain price balance.
Non-Custodial: Users retain control over their assets.
No Listing Fees: Anyone can list tokens, unlike centralized exchanges.
🔍 UNI Token Overview
UNI is the governance token of Uniswap, allowing holders to vote on protocol upgrades and treasury decisions.
🔹Tokenomics
Total Supply: 1 billion UNI
Inflation Rate: After September 2024, a 2% perpetual annual inflation will be introduced.
Circulating Supply: UNI is released gradually over 4 years.
Current Circulating Supply: About 550M UNI
🔹Token Allocation
Governance: 45% - 450M UNI
Team: 21.3% -212.66M UNI
Investors: 18%- 180.44M UNI
Community Token Distribution:15%- 150M UNI
Advisors: 0.69%- 6.9M UNI
Now that we have reviewed the project, let’s move on to the chart to analyze it from a technical perspective.
🔹Uniswap’s Evolution: V1, V2, V3
Uniswap V3 Innovations
-Concentrated Liquidity: LPs can set price ranges for providing liquidity.
-Multiple Fee Tiers: Traders can select different fee levels (0.05%, 0.3%, 1%).
-Capital Efficiency: More precise liquidity allocation for better returns.
—
🔒Token Unlock & Vesting Schedule
Current Unlock Progress
- Unlocked: 55% (549.94M UNI)
- Untracked: 45% (450M UNI)
- Locked: 0% (All tokens are being tracked or unlocked)
—
🔹Vesting Schedule
Group - Vesting Duration - Unlock
Team : 47 months (ended Aug 2024) -2.08% monthly
Investors: 47 months (ended Aug 2024)- 2.08% monthly
Community Distribution:Fully unlocked- 100% at TGE
Advisors: 47 months- 2.08% monthly
⚠️Important: The untracked 450M UNI tokens can be unlocked at any time, making them a potential source of market volatility.
—
Uniswap Governance & DAO
The Uniswap DAO allows token holders to participate in protocol decisions.
Governance Process:
1) Proposal Submission – Requires 25,000 UNI votes to enter deliberation.
2) Consensus Check – Needs 50,000 UNI votes to proceed.
3) Final Governance Vote – 40M yes-votes required for approval.
Uniswap DAO Treasury
$1.6 Billion worth of assets.
Previously largest DAO, now second (behind BitDAO).
—
❗️Security & Risks
🔹Security Measures
1) Smart Contracts Audited – Regular security reviews.
2) Decentralized Governance – Protocol updates are voted on by UNI holders.
3) Non-Custodial – Users always control their own funds.
🔹Risks
1)Ethereum Gas Fees – High network congestion leads to expensive swaps.
2) Impermanent Loss – LPs may lose value if token prices shift.
3) Governance Risks – Power concentrated among whales.
4) Smart Contract Exploits – DeFi platforms remain high-risk targets.
🖼NFT Expansion – Uniswap Acquires Genie
Uniswap acquired Genie, an NFT marketplace aggregator, to integrate NFT trading into its ecosystem.
🔹Genie Features:
-Aggregates NFTs from multiple marketplaces.
-Batch NFT purchases in one transaction (reducing gas fees).
-Plans for USDC airdrops to early Genie users.
Uniswap had previously launched NFT-backed Unisocks (2019), linking real-world assets to NFTs.
—
👛Best UNI Wallets
MetaMask
Trust Wallet
Ledger
Coinbase Wallet
SafePal
Solflare
OKX Wallet
—
💲Uniswap Team & Key Investors
Hayden Adams: Founder & CEO
Mary-Catherine Lader: COO
Marvin Ammori: CLO
💵Major Investors
Coinbase Ventures
Defiance Capital
Paradigm
ParaFi Capital
Delphi Digital
💰Total Funding Raised: $188.80M
🎯Uniswap's 2025 Roadmap and UNI Token Developments
In early 2025, Uniswap introduced Uniswap v4, marking a pivotal evolution in its protocol. This version emphasizes developer flexibility through the integration of "hooks," modular plugins that allow for tailored functionalities such as dynamic fees and automated liquidity management. These enhancements position Uniswap v4 as a versatile platform for DeFi developers, fostering innovation and adaptability within the ecosystem.
Unichain: Uniswap's Layer-2 Scaling Solution
To address scalability and transaction efficiency, Uniswap launched Unichain, its proprietary Layer-2 solution, on January 6, 2025. Built on the OP Stack, Unichain aims to deliver faster transactions and reduced fees, enhancing the overall user experience. The mainnet launch follows a successful testnet phase that processed over 50 million test transactions, underscoring its readiness for broader adoption.
—
🔹Several reputable platforms for creating liquidity pools
Uniswap
Pancakeswap
Raydium
Shibaswap
Biswap
MDEX
Balancer
Thena
Quickswap
Defiswap
Honeyswap
Warden
—
🔹Certik: 94.28
📈On-Chain Analysis of UNI
Analyzing Uniswap’s on-chain data, we observe key trends in profit and loss positioning, whale activity, and network engagement:
Around the $7.40 price level, approximately 39.55 million UNI tokens are in a loss position, indicating a potential resistance zone. Meanwhile, support levels remain weak due to a lower volume of profitable tokens.
Large transactions show slight spikes during price declines, suggesting a lack of strong buying interest from major investors.
Whales hold 51% of the total supply, making their trading activity crucial. Currently, addresses with holdings between 100 million to 1 billion UNI and 10 million to 100 million UNI are engaging in selling, adding downward pressure on price.
Network activity, including active and new addresses, is on a declining trend, signaling reduced user engagement and transaction volume.
Based on on-chain metrics, there is no significant buying pressure or demand at the moment, raising concerns over short-term price recovery.
📊Uniswap TVL Analysis
Since early December, Uniswap's Total Value Locked (TVL) has shown a slight increase, rising from 1.72 million ETH to 1.94 million ETH. However, this growth remains considerably lower compared to the levels observed in 2021, reflecting a slower pace of liquidity accumulation.
Now that we have reviewed the project, let’s move on to the chart to analyze it from a technical perspective.
📅 Weekly Timeframe
In the weekly timeframe, we observe a long-term range-bound trend with a slight upward slope. Currently, the price is experiencing a downward move, with the primary support at 5.841.
💫 If this level breaks, the price may continue declining, and the next key support is at 4.025. On the other hand, if RSI does not drop below 38.74 and the price holds above 5.841, we can have more confidence in a potential price increase.
🎲 In this scenario, the key resistance levels are 11.638 and 18.794. The main trigger for buying is the breakout of 18.794, and the major sharp price movement will occur after breaking the ATH resistance at 42.92.
🔽 The critical support level that should not be lost is 4.025, as breaking below this level could result in a sharp bearish movement, and in that case, we will use Fibonacci tools to determine the bearish targets.
📅 Daily Timeframe
Now, let’s move to the daily timeframe for a more detailed view.
🔍 As seen in this timeframe, after price consolidation below 12.559, the second corrective wave has begun, and the price has currently fully retraced the previous bullish wave, reaching 6.670.
📉 If this level breaks, the next key supports are 5.556 and 4.025, with 4.025 overlapping with the 1.5 Fibonacci extension.
⚡️ If the price finds support at the current level, an appropriate trigger for a long position would be the breakout of 43.54 in RSI, which can serve as a momentum confirmation. Once RSI breaks this level, we can look at lower timeframes to define a precise entry trigger.
🔽 On the other hand, if RSI enters the Oversold zone, the likelihood of breaking 6.670 or even 5.556 increases.
🛒 For a spot buy, the current valid trigger is a breakout of the $10 level, which is the last local high in this timeframe. The exact number for this breakout level will be determined based on price action and its reaction when it approaches the area.
💥 If the price experiences further decline and establishes new highs and lows, the spot buy entry should be based on the breakout of the newly formed high in the downtrend.
📝 Final Thoughts
This analysis reflects our opinions and is not financial advice.
Share your thoughts in the comments, and don’t forget to share this analysis with your friends! ❤️

TradeCityPro | LDO: Comprehensive Market Analysis and Prediction👋 Welcome to TradeCity Pro!
In this analysis, I want to review LDO for you. It is one of the key DeFi platforms, and its token currently holds a market cap of $945 million, ranking 72nd on CoinMarketCap.
📅 Weekly Timeframe
On the weekly timeframe, we can see a range box between the $0.957 and $3.389 levels, where the price has been fluctuating for almost two years.
🔽 If you already hold this coin, I recommend activating your stop-loss in case the $0.957 level is broken and waiting for bullish momentum to re-enter the market before buying again.
📈 If the price holds above the $0.957 support, it could rally back toward the top of the range at $3.389. The key trigger levels between the current price and the top of the box are $1.447 and $2.488.
🚀 The main buying trigger is at $3.389, as breaking this level could lead to significant capital inflows, potentially initiating a long-term bullish trend.
📅 Daily Timeframe
On the daily timeframe, a range box between $1.447 and $2.387 had formed, which was broken to the downside, leading to a bearish leg. The main support level is $0.957, and if it fails to hold, the price could enter a new bearish cycle.
🛒 For spot buying, there isn’t a clear trigger yet, so we need to wait for a new structure to form. However, if the price rallies sharply, you could consider entering on a break above $1.489.
💫 As seen on the chart, the red candle volume is significantly higher than the green candles, indicating strong seller dominance. Additionally, the RSI is near the 30 level, and if it breaks below this zone, the bearish scenario becomes more likely.
📝 Final Thoughts
This analysis reflects our opinions and is not financial advice.
Share your thoughts in the comments, and don’t forget to share this analysis with your friends! ❤️

Incoming BNB chain forks with 0,75s block time!BNB chain upcoming forks significantly reducing block times, increase TPS and decrease fees!
The Pascal hard fork in March 2025 is a big milestone in BNB Chain’s evolution setting the stage for the two upcoming BNB Chain forks:
1. Lorentz (April 2025): Reduces block intervals to 1.5 seconds
2. Maxwell (June 2025): Further reduces block intervals to 0.75 seconds
Very bullish for all BNB chain projects and it´s main token BNB and defi platforms like CAKE. Finally Ethereum compatible chain's direct hit to Solana's heart and it's performance. The Maxwell fork in June will be game changer for crypto industry.
Almost instant defi experience with decreasing Ethereum activity might lead to 2025 be a BNB chain season.

Univers Of Signals | SUI👋 Welcome to Univers Of Signals Channel!
Let's analyze and review one of the most popular coins in the market, sui, and update our previous analysis and find new triggers
🌐 Bitcoin Overview
Before starting today's altcoin analysis, let's look at Bitcoin on the 1-hour timeframe. Since yesterday, Bitcoin experienced a correction, which was necessary for the market, and it pulled back to the 102135 range. The next trigger for a long position will be a breakout above 104714.
Yesterday's correction, coupled with an increase in Bitcoin dominance, caused noticeable declines in some altcoins. This highlights the importance of monitoring BTC pairs in your checklist these days.
📊 Weekly Timeframe
In the weekly time frame, it is one of the coins that is in good condition, it is really in the market and is still fluctuating on the high support levels.
After hitting 5.24, we made a new ceiling or ATH, and after that, due to recent market news, we experienced some drops, and this has also caused the price correction of this coin.
For re-buying, if we make a good support candle at this level 2.4, it will be a good trigger and the main trend will start again after we break 5.24. Also, after breaking 1.77, we can temporarily exit this coin and cash out!
📈 Daily Timeframe
In the daily time frame, it has been in relatively good conditions compared to other coins in the market and has experienced fewer declines and still has a lot of support to lose!
After breaking the 1.0333 level, which was our trigger spot, we made our purchase and experienced a move after its failure with the entry of momentum and recorded a new ceiling with this event!
Along with this trend, we can draw our Fibonacci levels, which are currently involved in the important level of 0.382, and after it rises and breaks the ceiling of 5.24, we can experience a powerful move!
If this level is broken, we can also hit the support levels of 1.7702 and 1.3859 and we need to form a structure to buy now, but after breaking the trend line and the 3.65 trigger, it can be a good point! For selling, I will continue to hold for now!
📝 Final Thoughts
Stay calm, trade wisely, and let's capture the market's best opportunities!
This analysis reflects our opinions and is not financial advice.
Share your thoughts in the comments, and don’t forget to share this analysis with your friends! ❤️

AAVE Retests Key Support – Bullish Reversal Ahead?CRYPTOCAP:AAVE is currently retesting a rising support line after breaking through a key resistance zone, which has now turned into support.
This structure suggests that the uptrend remains intact, and the recent dip could be a healthy pullback before a continuation to the upside.
DYOR, NFA

ETH in a LIVERMORE Accumulation cylinder.What is a Livermore accumulation cylinder?
The Livermore Accumulation Cylinder gained fame through the insights of Jesse Lauriston Livermore, a Massachusetts-born American investor celebrated as one of the most exceptional traders in history. His theory revolves around what is often referred to as an ascending broadening wedge, a phenomenon that unfolds over extended time frames.
What is an accumulation cylinder with a widening mouth?
First recognized by the iconic trader Jesse Livermore, who essentially laid the groundwork for technical analysis, the 'Accumulation Cylinder with Widening Mouth' is a unique and gradually developing pattern. In this scenario, the price oscillates between two diverging lines, creating a tension that can lead to a significant upward breakout.
Is Ethereum resolving its own Livermore cylinder?
This isn’t the first instance of cryptocurrency showcasing a Livermore cylinder: Ethereum might currently be in the midst of resolving its own version, and Bitcoin may have experienced a similar pattern back in 2017. While the charts may seem to align quite well, it’s crucial to remember that they are not a guarantee of future outcomes. Instead, they can serve as a valuable guide for managing risk, setting expectations, and establishing realistic profit targets. Many newcomers to crypto dream of achieving a 100x return, but as demonstrated by Bitcoin whales, true profits often come from strategically trimming and adjusting their positions, making only a few calculated moves from cycle to cycle.

Higher low + trendTwo sell-off recently and cake formed higher low compared to "big short" in Feb 2025. On the other hand there is long-term trend pointing the area 3.5-4.0usd as the next resistance. If broken the price can gain traction quickly as there is not much sell pressure in higher levels.

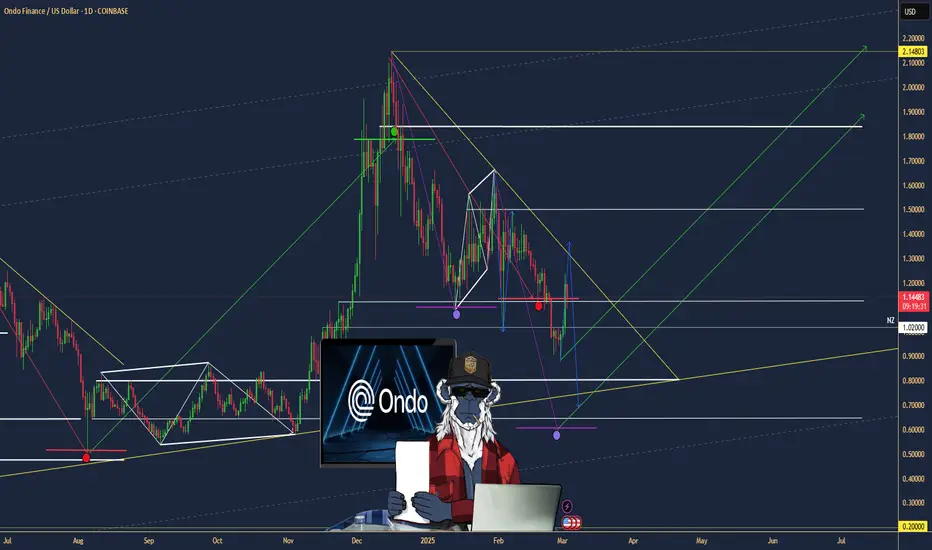
$ONDO: Ondo Finance – Tokenizing the Future or Facing Roadblocks
(1/9)
Good morning, champs! ☀️ LSE:ONDO : Ondo Finance – Tokenizing the Future or Facing RWA Roadblocks?
Ondo Finance just joined Mastercard’s Multi-Token Network, aiming to tokenize U.S. Treasuries! But with market volatility, is this RWA gem a buy or a wait? Let’s dive in! 🔍
(2/9) – PRICE PERFORMANCE 📊
• Recent Trend: Transaction volume spiked to 400M in Jan 2025, now ~300M 💰
• Market Insight: Up 1.6% recently (Daily Hodl, Feb 2025) 📏
• Sector: RWA tokenization surging with TradFi interest 🌟
It’s buzzing in the DeFi space! ⚙️
(3/9) – MARKET POSITION 📈
• Market Cap: Not specified; holds 40% of tokenized securities market 🏆
• Holdings: U.S. Treasuries, bonds via USDY, OUSG tokens ⏰
• Trend: Whales hold 88% of tokens, per IntoTheBlock 🎯
Firm, leading RWA tokenization! 🚀
(4/9) – KEY DEVELOPMENTS 🔑
• Partnership: Joined Mastercard MTN as first RWA provider (Feb 26, 2025) 🔄
• Expansion: Teamed with World Liberty Financial for RWAs 🌍
• Market Reaction: Steady growth in transaction volume 📋
Adapting, bridging TradFi and DeFi! 💡
(5/9) – RISKS IN FOCUS ⚡
• Volatility: Crypto market swings could hit token value 🔍
• Regulation: Compliance hurdles in tokenized assets 📉
• Concentration: High whale ownership (88%) risks dumps ❄️
Tough, but risks loom! 🛑
(6/9) – SWOT: STRENGTHS 💪
• RWA Leader: 40% tokenized securities market share 🥇
• Big Backers: BlackRock, Coinbase Ventures support 📊
• Tech Edge: Tokenizing U.S. Treasuries for DeFi 🔧
Got fuel in the tank! 🏦
(7/9) – SWOT: WEAKNESSES & OPPORTUNITIES ⚖️
• Weaknesses: High whale concentration, market volatility 📉
• Opportunities: TradFi integration, DeFi yield growth 📈
Can it tokenize to the moon? 🤔
(8/9) – 📢Transaction volume at 300M, Mastercard partnership live, your take? 🗳️
• Bullish: $2 soon, TradFi loves it 🐂
• Neutral: Steady, risks balance ⚖️
• Bearish: $0.90 looms, whales dump 🐻
Chime in below! 👇
(9/9) – FINAL TAKEAWAY 🎯
SMCI’s transaction volume and TradFi ties scream potential 📈, but whale concentration adds caution 🌿. Volatility’s our buddy—dips are DCA gold 💰. Grab ‘em low, climb like pros! Gem or bust?