Alikze »» INJ | Bullish Diamond Pattern - 1D🔍 Technical analysis: Bullish Diamond Pattern on Daily Timeframe, Sideway Price Movement
📣 BINANCE:INJUSDT In the analysis presented in the 12-hour timeframe , it was noted that the INJ currency is moving in an ascending channel.
🟢 After reaching the $25 area, the price corrected, which extended to the green box area, and then in the green box area, with demand, the price advanced to the supply area.
🟢 Currently, in the daily timeframe, the price corrected with a zigzag correction to the Fibonacci 1.618 area after reaching the supply area and the ceiling of the ascending channel.
💎 After that, the price had a sideways movement and has now formed an ascending diamond pattern.
💎 Therefore, we expect the price to continue its growth again in accordance with the movement path to the supply area before the $35 area.
🔔It should also be noted that if the price breaks the Fibonacci 1.618 area, the bullish scenario will be invalid and must be reviewed and updated again.
»»»«««»»»«««»»»«««
Please support this idea 💡 with a LIKE 👍 and COMMENT 💬 if you find it useful and Click "Follow" on our profile if you'd like these trade ideas delivered straight to your email 📧 in the future.
Thanks for your continued support.🙏
Best Regards,❤️
Alikze.
»»»«««»»»«««»»»«««
DEFI

(SOL) solana - ATHThe all time high was reached for Solana and right now the price is retracing the previous break of an all time high. At $3000/SOL that would be a 10x gain from the ATH right now. Is the path of Solana into the future going to look similar to Ethereum one day? And if so, how much time will pass before the billions of dollars flow into Solana if the outcome is a continued growth pattern as we have already seen? Solana surpasses BNB, passes $100B mcap, and despite the loss of previous years most competitive programmers to other chains, the interest in meme tokens on SOL chain seems to sustain the interest. How is it possible the world is still fascinated by meme cryptocurrency more than any other sector? At the start of 2024 there was a simple note passed along by Coinbase that stated the Dog-meme frenzy was not going away so easily as a core of the cryptocurrency defi culture. By the end of 2024 a lot of other random memes were present on Coinbase. Average meme culture has sprung onto Coinbase, USA's main crypto exchange. The shift from adding Ethereum tokens to Coinbase became all about Solana tokens. What will the future bring during 2025? How much influence does Coinbase have over the sector of defi cryptocurrency investing? Is it time for Ethereum to reach a new ATH?

CAKE on the way upCake just entered the tiny buy channel crossing 2.17usd with several local bearish targets on the way back to 4.5usd.
As you see on the chart the sell-off from the previous local top 4.5usd was mainly caused by panic sellers/whales, there are 8 fair value gaps (red squares) going down from 4.5usd whereas the growth to 4.5usd counts only 2 (green squares)! FVG (fair value gap) acts as a magnet in both directions, which means the red ones attract the price from below levels up and the green ones from upper levels down. In other words, if the price was unnaturally pushed down, it can jump the same way up and vice versa.
The price was pushed down significantly which may be an opportunity.

TradeCityPro | DEXE: Unveiling DeFi Synergies👋 Welcome to TradeCityPro!
In this analysis, I will be examining the DEXE coin, a DeFi protocol utilized by prominent projects such as Chainlink and Venus.
📅 Weekly Timeframe
In the weekly timeframe, we observe a strong and powerful upward trend that started at the base of 1.940 and has followed a curved trend line up to 17.493.
📈 Currently, after a correction down to 7.18, bullish momentum has re-entered the market, and the price has once again reached 17.493. The RSI is also entering the Overbuy territory, and with the increasing buying volume entering the market, everything is set for the price to move upwards.
✅ Should the price move and stabilize above 17.493, we can expect an increase in price, reaching Fibonacci targets such as the 1 and 1.618 Fibonacci Extension levels, approximately at the 43 and 133 zones.
🔽 In a correction scenario, if the price fakes breaking the 17.493 resistance and starts a new correction phase with a breach of the curved trend line, the correction phase will commence. Key supports are at 7.18, 5.072, and 2.767, and if the 1.940 support breaks, a bearish trend in the High Wave Cycle will start.
📅 Daily Timeframe
In the daily timeframe, we see a solid and powerful ceiling at 20.022, where after significant buying volume and a rise from 7.180, the price has reached and struck twice. If this area is breached, the price could move upwards and set new ATHs.
✨ Increasing buying volume and RSI entering Overbuy will greatly assist in driving the price up and initiating a trend. Conversely, in a price correction, a break of 50 in the RSI could deepen the correction and we could witness a significant price adjustment.
🧩 For a deep correction, the price needs to stabilize below 13.704. In this case, we can expect the correction to continue down to 7.180.
⏳ 4-Hour Timeframe
Let’s delve into the 4-hour timeframe to outline the triggers for futures positions.
🔼 For long positions, the only trigger currently present is breaking 20.767. If this area is breached or the price pulls back to this area, we can enter a long position. The RSI entering Overbuy, as mentioned in other timeframes, will aid price momentum.
📉 For short positions, it is crucial to note that the price is near its ATH, creating a very strong supply zone. Consequently, if the price is rejected from this zone, bearish momentum could enter the market. Therefore, we could take an early and risky entry for a short position at the break of 16.441 and wait for the main position at the break of 13.447.
📝 Final Thoughts
This analysis reflects our opinions and is not financial advice.
Share your thoughts in the comments, and don’t forget to share this analysis with your friends! ❤️

AAVE - DeFi leader
As I have stated in my previous analysis AAVE is one of the leaders in DeFi sector, and stays quite underpriced still. Just as I predicted, it reached my target and now I think it will go for .618 Fib. After that in theory there also will be a correction.
But if you look at Solana chart, it has gained a lot of attraction in this cycle and has made a new ATH. I think AAVE will be one of the few Altcoins which have the required potential to make new ATH also. Let's hope and monitor

Jupiter on Solana: Future Bet or Bursting Bubble?In a world where innovation is currency, the Jupiter on Solana project looks like a golden nugget against the desert backdrop. It's not just another crypto project, it's a heck of a massive solution that makes you wonder if traditional financial instruments are worth all your attention.
Let's start with the facts - Jupiter, is a decentralized exchange aggregator that not only connects liquidity, but does so with such efficiency that you start to question whether we even need centralized exchanges. See, Jupiter's trading volume has reached $1.5 billion, surpassing even 1inch, showing its dominance in the Solana space.
Now let's talk about speed and scalability. This thing - Jupiter - processes transactions at a pace that makes you feel like you're in the 21st century instead of the era of waiting for wire transfers. We're talking thousands of transactions per second, which makes Solana and Jupiter not just a player, but a leader in the DeFi game.
And don't forget the community. Jupiter has attracted over 955,000 accounts to its airdrop, which shows not only popularity but also trust in the platform. It's like when you find a company that not only promises but actually gives a return to its investors.
If we look at the charts, we can see that Jupiter is showing a long accumulation. According to my Fibonacci grid, I expect Jupiter to test the area at the $5.4 level. If Jupiter breaks through this level, we could see an even more significant rise, which would signal a new round of interest and possibly the start of a mainstream adaptation.
Horban Brothers,
Alex Kostenich

Executive Order 5555.Trump DeFi Force (TDF) has issued your orders.
You have 1 year to comply.
All your technical analysis are belong to us.
#PulseChain

TradeCityPro | INJ: Navigating the Waves of the DeFi Landscape👋 Welcome to TradeCityPro!
In this analysis, I'm going to review the coin INJ, which belongs to the Injective project, one of the intriguing networks in the DeFi sector. This coin has seen significant growth in recent years.
📅 Weekly Timeframe: Reaccumulation Box?
In the weekly timeframe, we observe a very strong and powerful upward trend full of bullish momentum that started from 1.2, even breaking the ATH to establish a new ceiling at 41.81.
🔍 Currently, after reaching 41.81, the price has pulled back to the support at 16.18 and formed a box between these two areas. The support at 16.18 overlaps with the 0.236 Fibonacci area, and we can also see an ascending trend line that coincides with this level, forming a PRZ that has so far supported the price.
🚀 If the resistance at 41.81 is broken, we can say that the long-term range box was a Reaccumulation phase, and the price could move towards targets of 135 and 494. However, it's important to note that this coin's market cap is currently $2.15 billion, and reaching a target of $494 would require it to enter the top ten coins by market cap, which might be challenging.
🔽 In case of further price corrections, there are solid supports available. If 16.18 breaks, the next Fibonacci support at 0.382 is around $10, and another substantial support is at $5.8.
🧩 Additionally, the RSI is boxed between 38.77 and 63.27, and breaking either boundary could significantly influence market momentum in that direction.
📅 Daily Timeframe: More Details
In the daily timeframe, we can see more details of the range box formed.
✨ The price is currently near the weekly trend line and has reacted to this area in this timeframe as well. The first resistance is at 26.75, and breaking this area could be a trigger for entering a long position or buying in spot. A break of 58.26 in the RSI would be a good confirmation.
🛒 The next buying trigger is at 34.76, which is more secure, and simultaneously breaking significant resistances in the TOTAL could drive the price towards higher targets.
⚡️ The most important resistance is at 45.32, and I suggest maintaining a long position before the price reaches this area as there is a high chance of a euphoric break. However, this area is a strong supply zone and could potentially push the price back down to the range box's floor.
📉 For short positions, we should first wait for the trend line to break. In this case, the first trigger is a break at 19.44, and the main trigger is breaking the support at 16.04.
📊 Regarding volume, I cannot provide much insight as both the market and volume are ranging, and specific data cannot be derived. However, it's evident that if volume increases in any direction, market momentum will likely follow.
⏳ 4-Hour Timeframe: Futures Triggers
Let's dive into the short-term triggers suitable for futures trading.
🎲 Given that the market has been range-bound in the weekly timeframe for a prolonged period, it has lost momentum. In this timeframe as well, the price remains confined within a range box.
📈 Long Position: You can enter a long position if the price breaks above 25.43. The target for this position would be 34.76. This is a solid trigger and, if aligned with Bitcoin's movements, could introduce bullish momentum into the market.
🔽 Short Position: For shorting, the only current trigger is at 18.82.The RSI oscillator and the SMA indicator cannot be relied upon for confirmation in this scenario, as the market lacks any trend or momentum.
🧲 As mentioned, the trading volume remains range-bound. Upon breaking any trigger level, the volume should increase in the direction of the breakout.
📝 Final Thoughts
This analysis reflects our opinions and is not financial advice.
Share your thoughts in the comments, and don’t forget to share this analysis with your friends! ❤️

TradeCityPro | MNT: Layer 2 Project's Market Movements👋 Welcome to TradeCityPro!
In this analysis, I will review the coin MNT, a layer 2 project that has experienced significant growth in recent months.
📅 Weekly Timeframe: Engaged with ATH Ceiling
In the weekly timeframe, as you can see, there is limited data, and since the inception of this coin, it has created a significant ceiling at 1.4264, which it has touched twice and is currently being rejected from again.
🧩 The main supports are at 0.5450 and 0.3278. The SMA25 also acts as dynamic support. Due to limited data in this timeframe, it's better to move to the daily timeframe for a more detailed chart analysis.
📅 Daily Timeframe: Beginning of the Next Correction Wave
In the daily timeframe, we observe a strong upward trend starting from a low of 0.5450, reaching up to 1.3997, and forming a range box between 1.0861 and 1.3997.
🔽 Currently, the price is breaking the floor at 1.0861. This area is critical as the price has historically reacted to it, and it coincides with the 0.382 Fibonacci level. If this floor breaks, the price could move towards the 0.618 and 0.786 Fibonacci levels.
✨ The RSI oscillator, with its break below 50, has activated a negative divergence in the market, and with the increasing volume of sales, the likelihood of starting the next correction wave is high.
🛒 If the price returns above 1.0861, the trigger at 1.3997 will be suitable for buying in spot. Otherwise, you should watch for the price reaction to upcoming supports.
⏳ 4-Hour Timeframe: Futures Triggers
In the four-hour timeframe, I will only examine futures triggers.
🔼 For long positions, the first trigger is 1.1478, which has shown to be a strong level as the price has already pulled back to it once, highlighting its importance. If this area and 54.85 are broken, more bullish momentum will enter the market, potentially moving the price towards the main resistance at 1.3997.
📉 For short positions, the first trigger is 1.0311, which the price has already reacted to. If the price consolidates below this area, we can expect it to reach 0.8718. Additional triggers might include Dow Theory and breaking lower lows for further positions.
📝 Final Thoughts
This analysis reflects our opinions and is not financial advice.
Share your thoughts in the comments, and don’t forget to share this analysis with your friends! ❤️

$ATOM (Cosmos) predictionWhat is NASDAQ:ATOM , and why am I interested in this technology?
They call themselves the "Internet of Blockchains," but in simpler terms, it's an SDK that makes it easier to create blockchains. So far, over 200 blockchains have been built using this SDK, including major players like CRYPTOCAP:INJ , LSE:TIA , and $FET.
### Why is this technology impressive?
- **Unmatched Reliability:** With over $100B worth of tokens running on its ecosystem without crashes or downtime, it’s a performance few can match, except for Ethereum.
- **Seamless Interoperability:** In a world where more and more Layer 1 blockchains are being created, NASDAQ:ATOM stands out for its ability to bridge blockchains, simplify staking, and enable smooth trading within its ecosystem—unlike blockchains that operate in isolation.
### Why hasn’t NASDAQ:ATOM performed well in 2024?
After massive pumps in 2021 and 2022, it’s still in a recovery phase. However, the bottom appears to be in, and the charts suggest it’s gearing up for a move upward.
I’ve marked a green box where I believe you can safely load up for a long position.
DYOR!

ATH/USDT Forming Higher Lows: A Must-Watch AI CoinATH/USDT is currently trading within a wide sideways zone. The price is moving upward, supported by a rising trendline marked in black, and consistently forming higher lows.
As an AI-driven coin with strong fundamentals, it’s worth adding to your watchlist.
DYOR, NFA

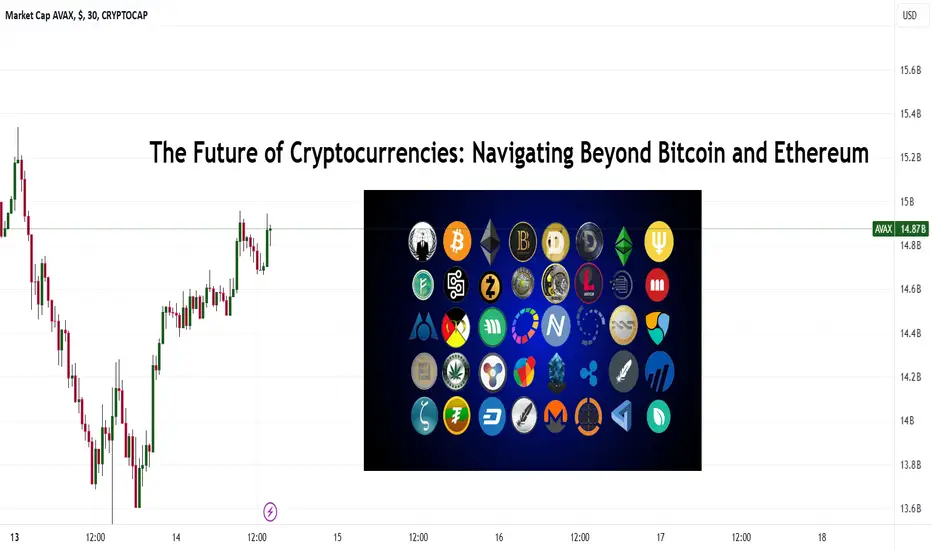
The Future of Cryptocurrencies: Navigating Beyond BitcoinI've been diving deep into the crypto world, and it's clear that Bitcoin and Ethereum aren't the only players anymore. As we're pushing through 2025, the crypto landscape is buzzing with altcoins, DeFi projects, and wild blockchain innovations. Here's how I've learned to navigate this exciting, yet sometimes wild, space:
Beyond Bitcoin and Ethereum
I used to think Bitcoin and Ethereum were the be-all and end-all of crypto, but man, was I wrong. Now, I'm exploring altcoins because:
-Diversification: I spread my crypto eggs across multiple baskets to catch the next big wave while keeping my portfolio balanced.
-Innovation: Altcoins are where the coolest new tech is happening. From privacy features to new ways of reaching consensus, it's like a tech playground out there.
Current Trends in Altcoins
-DeFi Developments: I've fallen down the rabbit hole of DeFi. Platforms like Aave or Compound? They're letting me lend, borrow, or farm yields directly on the blockchain. It's like the Wild West of finance, but I'm loving the autonomy and potential returns.
-Layer 2 Solutions: Ethereum's scaling problems got me looking at projects like Polygon (MATIC) and Solana (SOL). These are speeding up transactions and cutting costs, making blockchain tech more usable for everyday stuff, from gaming to buying digital art.
My Investment and Trading Strategies
Researching Altcoins:
-Technology: I geek out on the tech. Does it solve a real problem?
-Team: I check if the team behind it seems legit or if they're just in it for the quick buck.
-Community: A lively community is a good sign. It's like having a cheerleading section for your investment.
-Real-world Use: I'm all about coins that have a practical use. It gives me confidence in their longevity.
Portfolio Allocation: Here's how I juggle my crypto stash:
50-60% in Bitcoin and Ethereum for stability.
20-30% in well-established altcoins with solid fundamentals.
10-20% for the moonshots – those high-risk, high-reward projects that keep the thrill alive.
Managing Risks in Crypto Trading
- Volatility : Crypto can be a rollercoaster. I use dollar-cost averaging to smooth out the wild rides and set stop losses because, let's be real, I've learned the hard way that the market can tank when you least expect it.
-Security: I'm super paranoid about security. I keep my significant holdings in hardware wallets and do my homework on every ICO – because scam coins are real, folks.
Case Studies
- Success Story: I've been watching Cardano (ADA), which has been on fire with its focus on security and real-world applications, especially in Africa. It's been a good reminder that tech with purpose can go places.
-Cautionary Tale: The Terra (LUNA) crash was a wake-up call. It showed me how quickly things can go south in the crypto world, especially with stablecoins.
Technological Innovations
- NFTs: I've seen NFTs go from digital art to owning pieces of virtual land. They've changed my view on what digital ownership can be.
-Cross-Chain Solutions: Projects like Polkadot and Cosmos are fascinating because they're trying to make all these different blockchains talk to each other. It's like building a universal translator for crypto.
Looking Ahead
-Regulatory Landscape: I keep an eye on regulations because they could either make or break some altcoins I'm interested in.
-Integration with Traditional Finance: I'm seeing more and more traditional finance players dipping their toes into crypto. It's exciting to watch.
Next Big Use Case: I'm always on the lookout for the next big thing, like Web3, which could totally shift how we interact online.
If you want to know more, send me a DM or head over to my profile. If you liked this post, please don't forget to boost, share, and comment below.
Kris/Mindbloome Exchange
Trade What You See
DEEP BOOK - took a profit and wait for re-entryI bought DEEP in stages in the orange square zone all under $.009. The price reached 0.18 and 4H stochastic, and 1H MACD and RSI presented strong negative divergence. Therefore, I took my initial profit. I will wait for the price to correct and hopefully comes down to Fib 0.5 Level at $0.140. if momentum indicators reset for the upside move in that region, I will consider to buy more.

"INJ support at $17.30-$18.30, potential reversal to $27-$45." INJ/USDT Detailed Chart Analysis and Trade Plan
This analysis aims to provide an in-depth view of the current market structure for INJ/USDT, highlighting a potential reversal zone and long-term upside targets.
---
#1. Current Market Structure Analysis
- Support Zone: $17.30 - $18.30
- This range aligns with a visible **Fair Value Gap (FVG)** and a potential **bullish order block** from historical price action.
- INJ has consolidated around this zone, indicating a strong **buying interest** from previous liquidity sweeps.
- Why is this important?
- FVGs are areas where price has moved rapidly, often leaving inefficiencies that the market tends to revisit. Coupled with the order block, it strengthens the probability of reversal.
- RSI Oversold Signal:
- The **Relative Strength Index (RSI)** is at **38.49**, nearing oversold levels. Historically, bounces occur when RSI enters this zone, indicating that sellers may lose momentum.
- EMA Levels (Resistance):
- The **50 EMA ($23.62)** and **200 EMA ($23.52)** are acting as resistance. A breakout above these levels would likely confirm a stronger bullish reversal.
---
2. Reversal and Upside Targets
- Take Profit Levels:
- Target 1 (TP1): $27.30
- This corresponds to a prior liquidity zone where sell-side pressure emerged. Price may face resistance here before breaking higher.
- Target 2 (TP2): $35.00
- This level aligns with a significant **swing high** and an untested order block, providing a more ambitious long-term target.
-Target 3 (tp3) :45$-50$ for long term .
---
3. Key Levels and Trade Setup
| **Zone** | **Price Range** | **Action** |
|-----------------------|------------------|--------------------------|
| **Support Zone** | $17.30 - $18.30 | Look for long entries |
| **Stop Loss (SL)** | Below $16.80 | Risk management |
| **Take Profit 1 (TP1)** | $27.30 | Partial exit |
| **Take Profit 2 (TP2)** | $35.00 | Final exit |
**Position Scaling** | Add $45-$50 near confirmation signals to build a stronger position |
---
4. Sentiment and Fundamental Factors
- Injective Protocol's Key Strengths:
- Known for **high-performance Layer 1 blockchain** optimized for DeFi and decentralized exchange (DEX) applications.
- Recently, INJ has seen increased adoption with features like **decentralized perpetuals**, cross-chain bridging, and seamless liquidity.
- Bullish Catalysts to Watch:
- Ecosystem Growth: Partnerships or developments in **DeFi adoption** and higher trading volumes on Injective-based DEXs.
- Protocol Upgrades: Any enhancements that improve the scalability, security, or interoperability of the platform.
- Macro Market Trends: Bullish momentum in the broader crypto market could act as a tailwind for INJ.
---
5. Risk Management
- Entry Precision:
- Set limit orders near $17.30–$18.30 to capture entries at optimal levels.
- Risk/Reward Ratio:
- Assuming a stop loss at $16.80 and TPs at $27.30/$35.00, the
-risk/reward ratio exceeds 3:1, offering a favorable trade setup.
6. Final Notes
This trade is structured around the following:
- Strong confluence of technical indicators.
- Positive sentiment in the **DeFi space**.
- Potential for a broader crypto market rally.
If the price holds above the $17.30–$18.30 zone and breaks the EMAs, the likelihood of a bullish breakout increases significantly.

VELO is holding Very Strong!KUCOIN:VELOUSDT
VeloDrome Finance is behaving very strong with respect to the current slow and bearish market for the low time frame. All other alts had 30-40% dump while VELO is holding it's structure very nicely.
We can expect a break of the resistance very soon with a move of 50-70% bullish move ahead

Alikze »» JOE | Ascending channel - 1W🔍 Technical analysis: Ascending channel - 1W
📣 BINANCE:JOEUSDT It is moving in an ascending channel on the weekly time frame.
🟢 Given the positive reactions and demand in the bottom area of the ascending channel, the upward movement can continue its growth to the supply area and, if supported in the middle area of the channel, the movement can continue to the ceiling of the ascending channel.
💎 Furthermore, with the failure of the first ascending channel, it can continue its growth to the extent of the first channel to the large supply area.
⚠️ In addition, if the ascending channel breaks and consolidates below it, the upward scenario is invalidated and must be re-examined and updated. ⚠️
»»»«««»»»«««»»»«««
Please support this idea 💡 with a LIKE 👍 and COMMENT 💬 if you find it useful and Click "Follow" on our profile if you'd like these trade ideas delivered straight to your email 📧 in the future.
Thanks for your continued support.🙏
Best Regards,❤️
Alikze.
»»»«««»»»«««»»»«««

Altcoins Have Broken Out - In Case You Didn't Notice.Crypto Fam,
In case you didn't notice, altcoins have officially broken out of our bearish descending wedge. I am expecting 2025 to be a bull year and through April you should really see some massive pumping take place, especially with high MC memecoins.
Don't forget that my cycle theory is different this bull market but so far has proven correct. That is: BTC is bullish first often in sync with Solana, Solana Memecoins, and often accompanied by AI based alts/memecoins. The we see other memecoins pumping with continued strength from AI based coins. And finally we see the OG classic ALT follow the train. This seems to be the trend. I don't expect anything different this year.
As it pertains to ALTS on this chart, you can see I have drawn some resistance right around 1.13T MC. I would expect some pause here and maybe a slight pullback before the bulls gain enough momentum to break through. Then onward and upward we should proceed through April. I'll re-assess the macro outlook for all of crypto at this point.
✌️ Stew

LRC Long -> 1.36$Long Position on LRC/USDT
We have entered a long position at the current price of 0.1348 USDT. Based on our chart analysis, we expect the price to soon reach the marked levels.
At each target, we suggest taking partial profits to secure gains and reduce risk.
Targets:
0.50 USDT – First target, take partial profits here.
0.80 USDT – Second target, take more profits.
1.40 USDT – Final target, exit the remaining position.
A stop-loss should be placed below the recent low to manage risk effectively.

Trading opportunity for 1INCHUSDTBased on technical factors there is a Buy position in :
📊 1INCHUSDT
🔵 Buy Now
🪫Stop loss 0.4170
🔋Target 0.4530
📏 R/R 2,2
💸RISK : 1%
We hope it is profitable for you ❤️
Please support our activity with your likes👍 and comments📝

"JUP hits TP1! TP2 & TP3 in sight with $3–$5 long-term targets.Jupiter (JUP) has recently achieved its first target price (T.P1), signaling potential momentum toward subsequent targets (T.P2 and T.P3) and setting the stage for new long-term objectives in the $3 to $5 range.
The recent surge in JUP's value can be attributed to several key developments:
Exchange Listings: On January 31, 2024, Binance, a leading cryptocurrency exchange, listed JUP for trading. This listing significantly increased JUP's visibility and accessibility, contributing to a 57% price surge.
COINJOURNAL
Token Launch and Airdrop: Jupiter launched its native JUP token on January 31, 2024, accompanied by a substantial community airdrop targeting nearly a million Solana wallets. This initiative has been pivotal in attracting investor interest and driving trading volume.
COINJOURNAL
Increased Trading Volume: Following the token launch, Jupiter's platform experienced a significant uptick in activity, with trading volumes surpassing $1.4 billion within a 24-hour period. This surge underscores the growing adoption and utilization of Jupiter's services within the decentralized finance (DeFi) ecosystem.
CRYPTO WORLD NEWS
These developments have not only enhanced JUP's market performance but have also positioned Jupiter as a prominent player in the DeFi space, potentially attracting further investor interest and contributing to the pursuit of higher price targets.

We are in the Banana Zone. So Shill me an S coin.And I will promise to review it and take review it and chart potential Big Banana's
Lets set a deadline of Wednesday 8th of January midday UTC
Maximum of 2 coins per person.

FANTOM/USDT- AnalysisThe yellow scenario almost happened and it fell by 13%
In my opinion, the correction is finished and it starts moving upwards

TradeCityPro | DYDX: Daily Trend Line Reaction & Momentum Shift👋 Welcome to TradeCityPro!
In this analysis, I will examine the DYDX coin, which is associated with the DYDX exchange, one of the well-known decentralized exchanges (DEXs) with a focus specifically on futures.
📅 Daily Timeframe: Reaction to the Curved Trend Line In the daily timeframe, after a price drop and recording new lows, we observed a rounding at the bottom of the chart which gradually reduced the bearish momentum and selling volume in the market, followed by an influx of bullish volume and momentum.
✨ After breaking through $1.4362, the price moved upwards more freely, breaking the $1.8702 area and continuing its movement up to $2.5747. However, it could not stabilize in these areas and started correcting, eventually falling back to $1.4362.
📈 The market volume has been decreasing during the bearish phase, gradually diminishing, which indicates the strength of the bullish trend. In my opinion, if we observe a trend change in the shorter timeframes, the next price leg will begin.
🛒 The main price trigger for going long is breaking $2.5747, but an earlier and riskier trigger would be $1.8702. For spot purchases, the trigger at $2.5747 is suitable, but the main trigger will be at $4.3949.
📝 Final Thoughts
This analysis reflects our opinions and is not financial advice.
Share your thoughts in the comments, and don’t forget to share this analysis with your friends! ❤️
